The overall market trend in the past couple of days is still moving downward as we previously expected.
Let's take a look at the current trend structure.
On the 4-hour chart, from the perspective of MACD, a high-level death cross has already appeared.
This pattern has occurred before the last two declines, during which we successfully captured those two bearish opportunities.
Currently, the shape and rhythm of this wave are very similar.
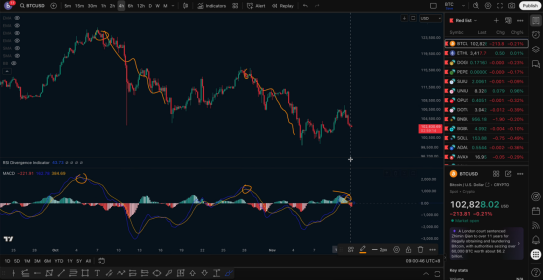
MACD is still above the zero line, and if the death cross continues to widen, the probability of the price testing the 94,000 level downward is very high.
Now let's look at the rebound structure.
The high point of this rebound just happens to be the 0.618 retracement level of the previous decline, which is 106,500.
This position is a very critical main area.
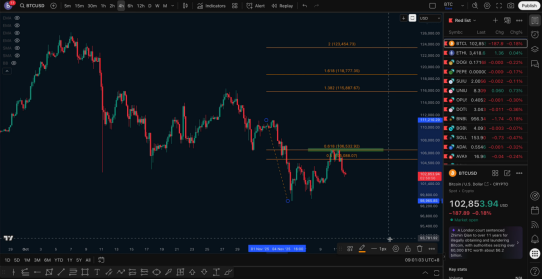
From the daily chart perspective, it corresponds to a multi-top neckline area.
Previously, this area was repeatedly tested, broken, and then reclaimed, until it finally broke below the 100,000 mark recently.
Therefore, the resistance in this area is very strong.
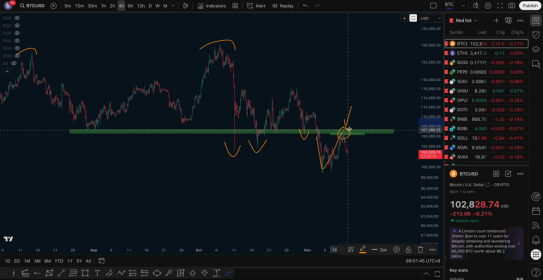
Yesterday's movement was actually a pullback after a breakdown, where the price re-validated the effectiveness of the resistance above.
If the bearish trend continues, the probability of further downward movement remains high.
Of course, we cannot rule out one scenario:
This segment may be a "downward continuation," which is a consolidation adjustment formed during the decline.
If the market moves in this rhythm, the price may first oscillate back to the lower channel, then rebound slightly, and then move downward again.
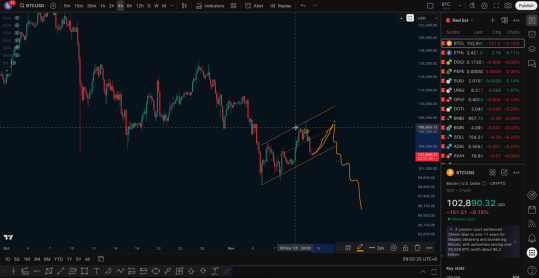
However, from the current structure, I believe this possibility is relatively small.
If you have positioned short orders at the high yesterday, you can now choose to move your stop loss for defense.
This is a more prudent approach.
In case the market rebounds again to the cost area, observe whether the market reaction shows significant pressure.
For short-term support, focus on the range of 100,000 to 98,000, which is the first phase target.
If it breaks down further, the next target for this round of bearishness will be around 94,000.
This position is not only the 0.618 retracement level on the daily chart but also where the previous upward gap is located, thus it has high reference value.
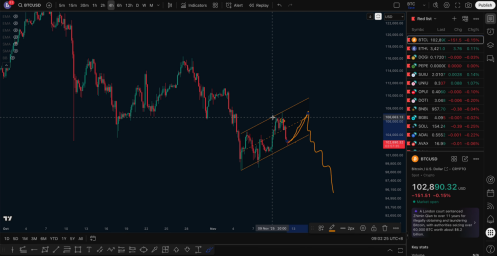
Overall, the trend remains bearish, and the strategy is still primarily focused on shorting during rebounds.
Now let's take a look at Ethereum.
Ethereum's movement this time is also very typical, characterized by a "sharp drop + slow rise" rhythm.
This structure often indicates that there will be a new round of decline.
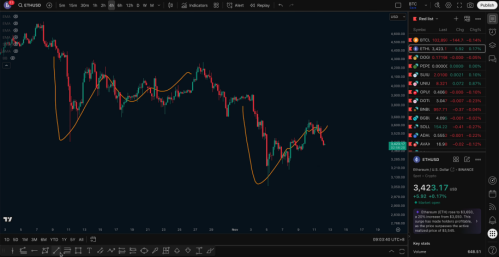
Currently, Ethereum is operating within a relatively standard ascending channel, and it has just tested the lower trend line.
If it continues to oscillate upward, just defend your position; it is not recommended to chase long.
The overall structure resembles a downward continuation, and the future outlook remains bearish.
Follow me for mutual progress!! (Article release may be delayed, for reference only)

免责声明:本文章仅代表作者个人观点,不代表本平台的立场和观点。本文章仅供信息分享,不构成对任何人的任何投资建议。用户与作者之间的任何争议,与本平台无关。如网页中刊载的文章或图片涉及侵权,请提供相关的权利证明和身份证明发送邮件到support@aicoin.com,本平台相关工作人员将会进行核查。


