Broad market participation = healthy market; centralized returns = the role of the index mechanism.
Author: Duality Research
Translated by: Deep Tide TechFlow
In just 11 days, the market erased the possibility of a rate cut in December, and in just one day, that possibility revived.
As we anticipated, Federal Reserve officials completely retracted their previous hawkish tone last week, raising the probability of a December rate cut by 40 percentage points.
From our first chart, we can see that this probability has now risen to 102%—more than four times what it was a few days ago, all occurring without any substantial new data. This undoubtedly calls into question the Federal Reserve's communication strategy.
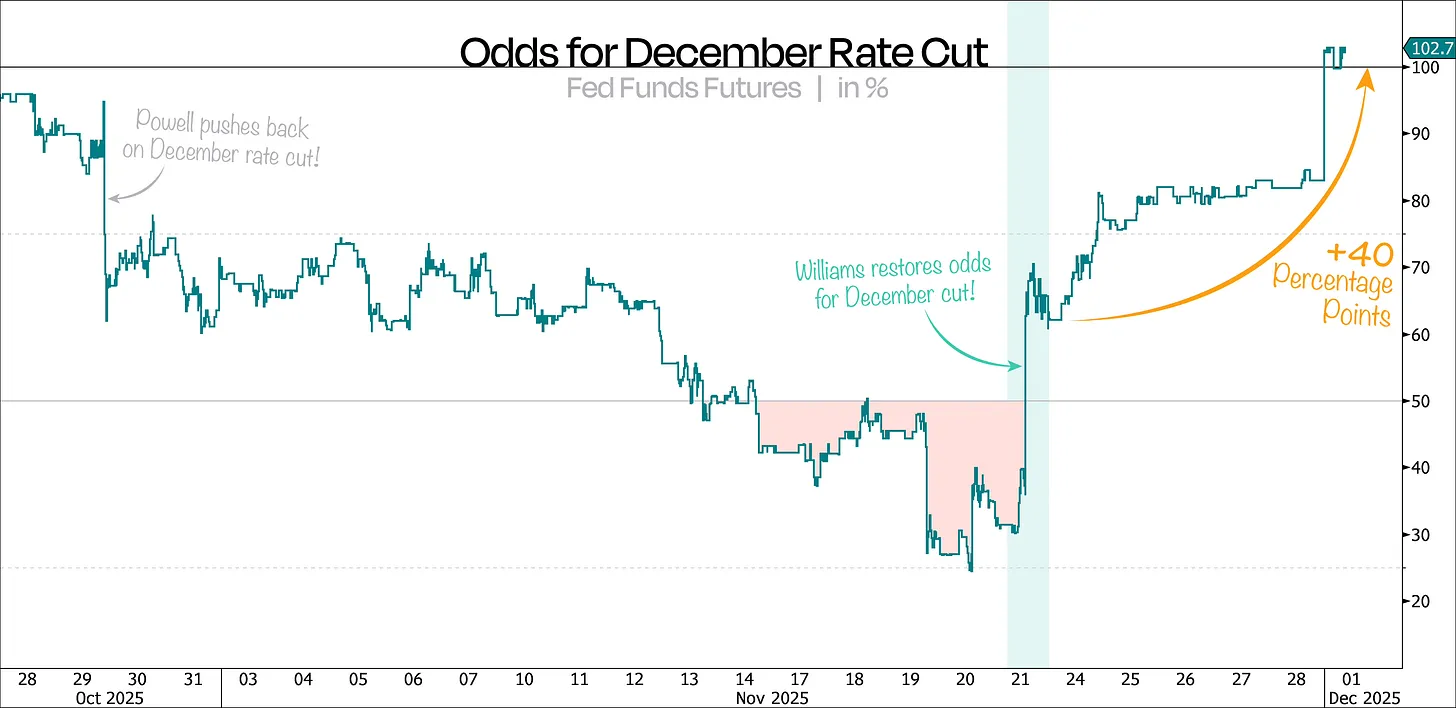
As we mentioned last time, this wave of market pullback was entirely driven by the Federal Reserve, so a dovish turn could significantly boost risk assets again.
Moreover, this rebound has shown to be very broad and with huge trading volume; it is no longer just an oversold bounce but a genuine buying push. The best way to prove this is to look at the 5-day change rates of the equal-weighted S&P 500 index and the Russell 2000 index.
Generally, the initiation of a major market movement is often accompanied by significant actions, and we have just witnessed the strongest 5-day consecutive rise since April. This is not only a good sign but also a rather loud signal that "the market is turning."
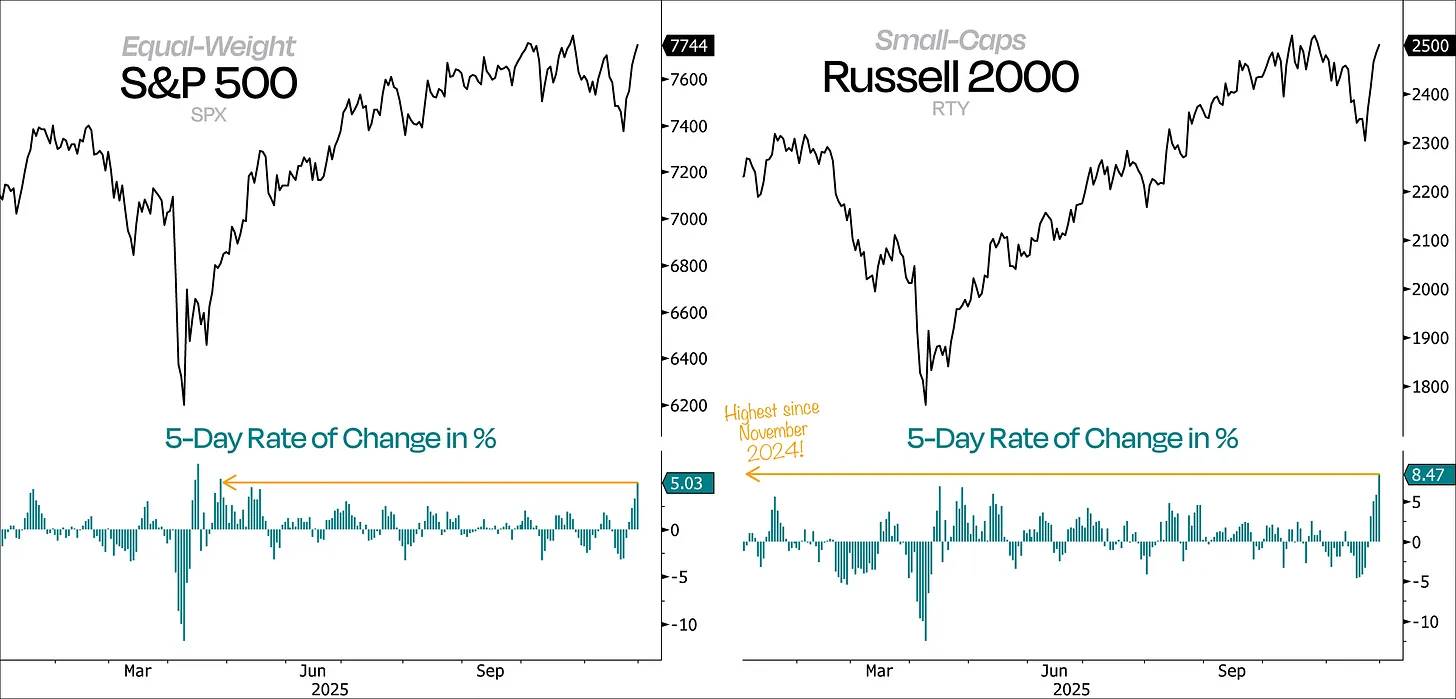
Even more exciting is that demand has surged at key levels, and the timing is just right. More importantly, even with Nvidia's stock price falling, the S&P 500 index has still proven its ability to continue climbing.
From our next chart, we can see that excluding the technology sector, the overall market seemed to weaken at one point. However, thanks to recent positive changes, the S&P 500 ex-tech index set a new all-time high just three days after experiencing its deepest pullback since breaking out in July.
Meanwhile, the technology sector is still over 6% away from its new high.
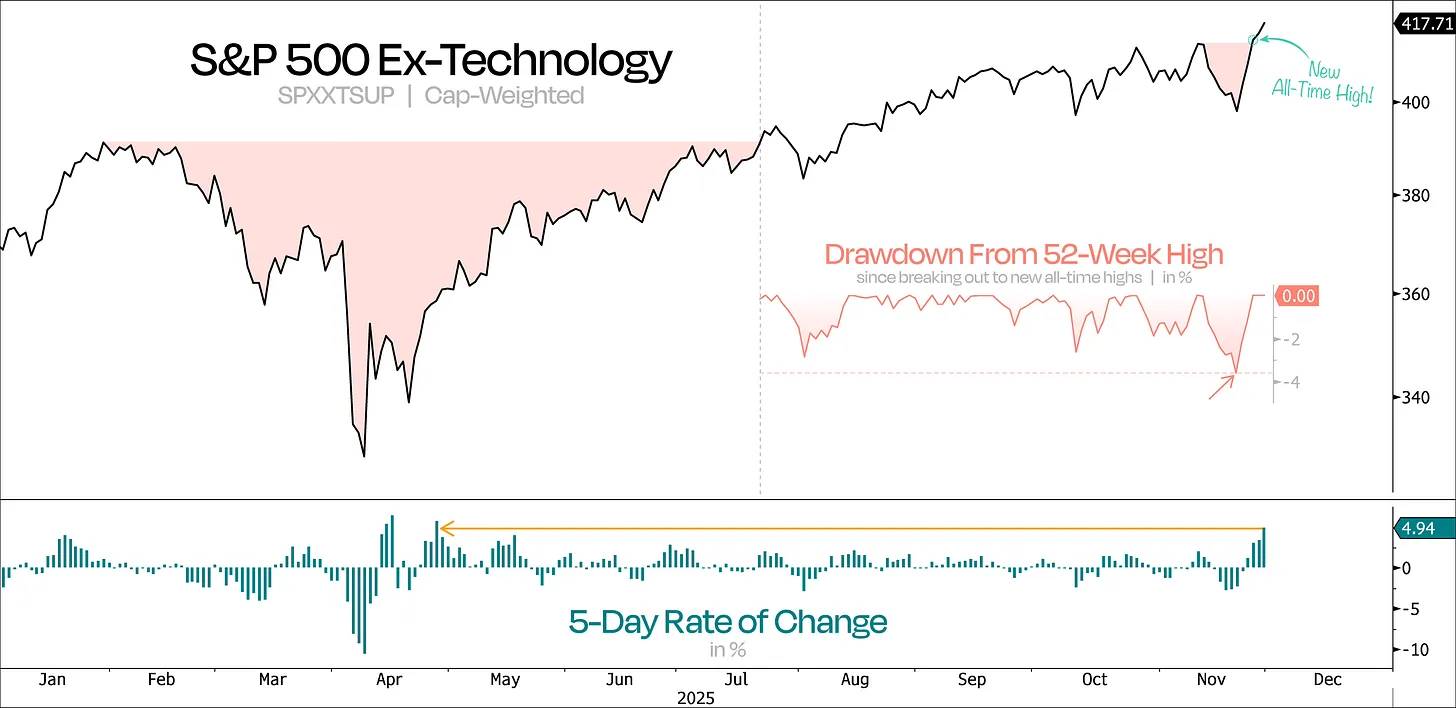
This is textbook "Shake ’n Bake" reversal—bears thought the game was set, only to be countered by strong momentum. Weak investors were washed out, and then the market welcomed a strong sustained rebound.
Recently, we have seen similar phenomena in several stocks related to the real economy, which previously seemed on the verge of collapse—this is not a good sign in a bull market.
Take regional banks and the retail sector as examples; they once fell below the anchored VWAP (Volume Weighted Average Price) since the April low, but then captured strong momentum, rebounding above the anchored VWAP of the September high.
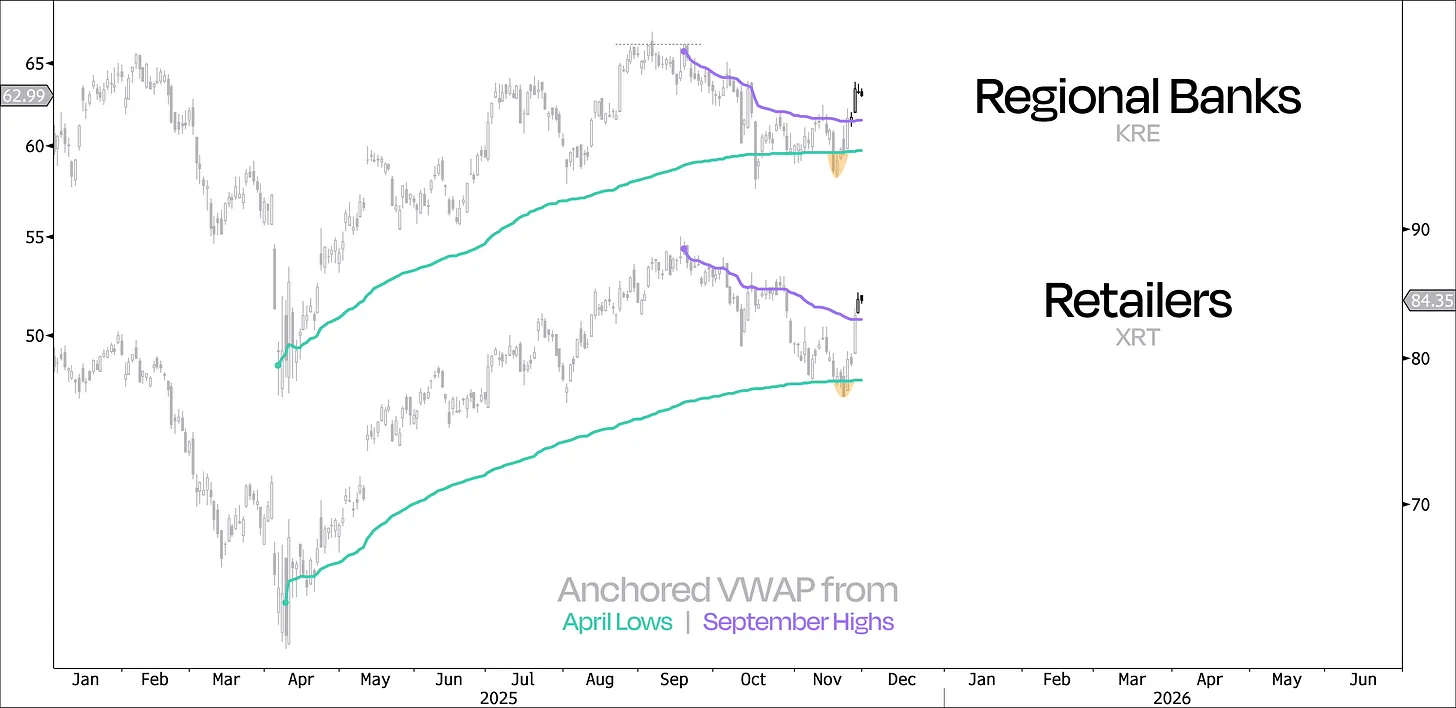
This situation has also appeared in several other sectors, such as home builders, equal-weighted consumer discretionary and industrial sectors, as well as small-cap stocks overall. This is a good sign for the rebound, especially since these sectors have lagged for most of this year.
The good news is that market participation is expanding, and since Nvidia's stock price reversal, the leading sectors in the market are exactly what we want to see. If this bull market is to extend further, now is the time.
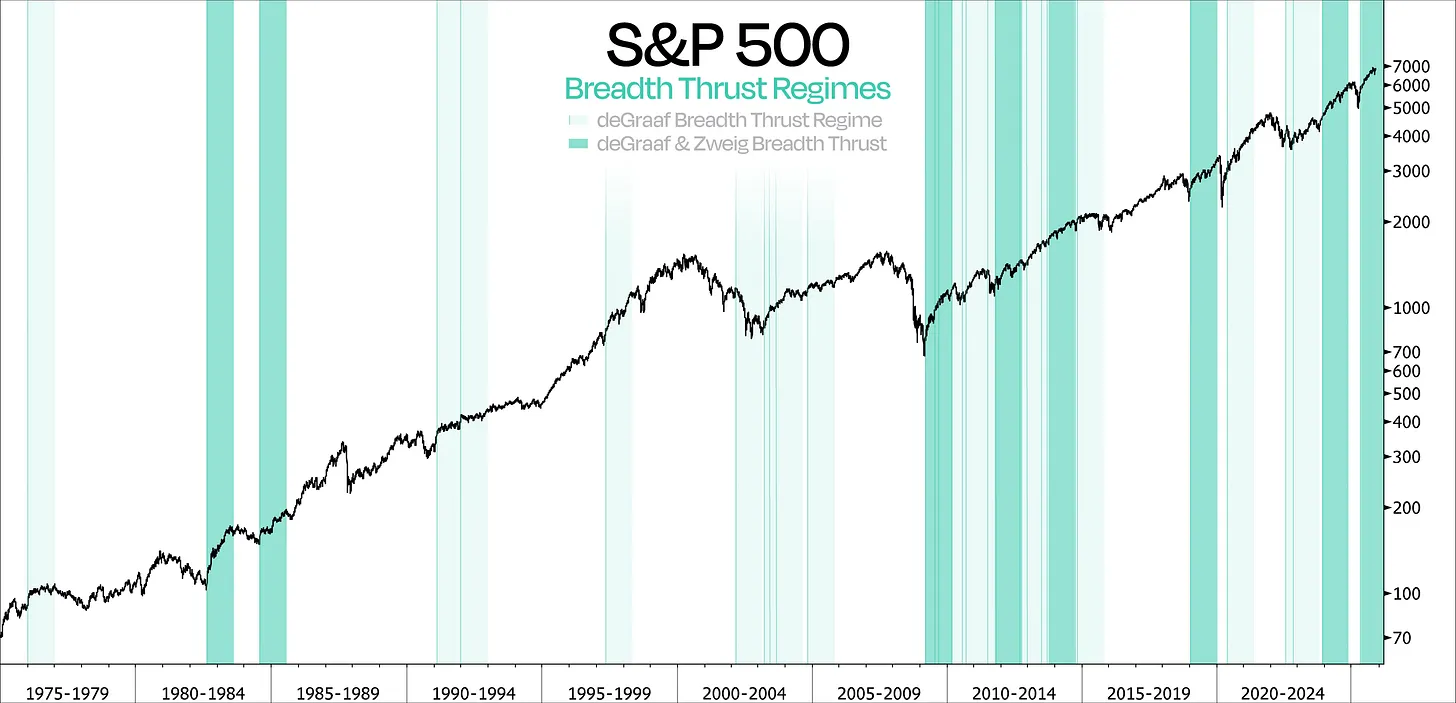
What could truly confirm and solidify this trend this week is the strong possibility of a "Zweig breadth thrust" or even a "deGraaf breadth thrust." Although these two methods differ in measuring market breadth, the message they convey is fundamentally the same— the market has rapidly shifted from "no one is buying" to "everyone is buying."
More importantly, historical data has proven the significance of such breadth thrusts—especially when both occur within a month. Statistics show that the S&P 500 index averages a 26% increase in the following year, and this has been the case every time. The most recent occurrence was on May 12, and since then, the S&P 500 index has risen by 17%.
In summary, when these breadth thrusts occur, they are particularly important because they are not only reliable and powerful but should also be key indicators in the investment toolbox.
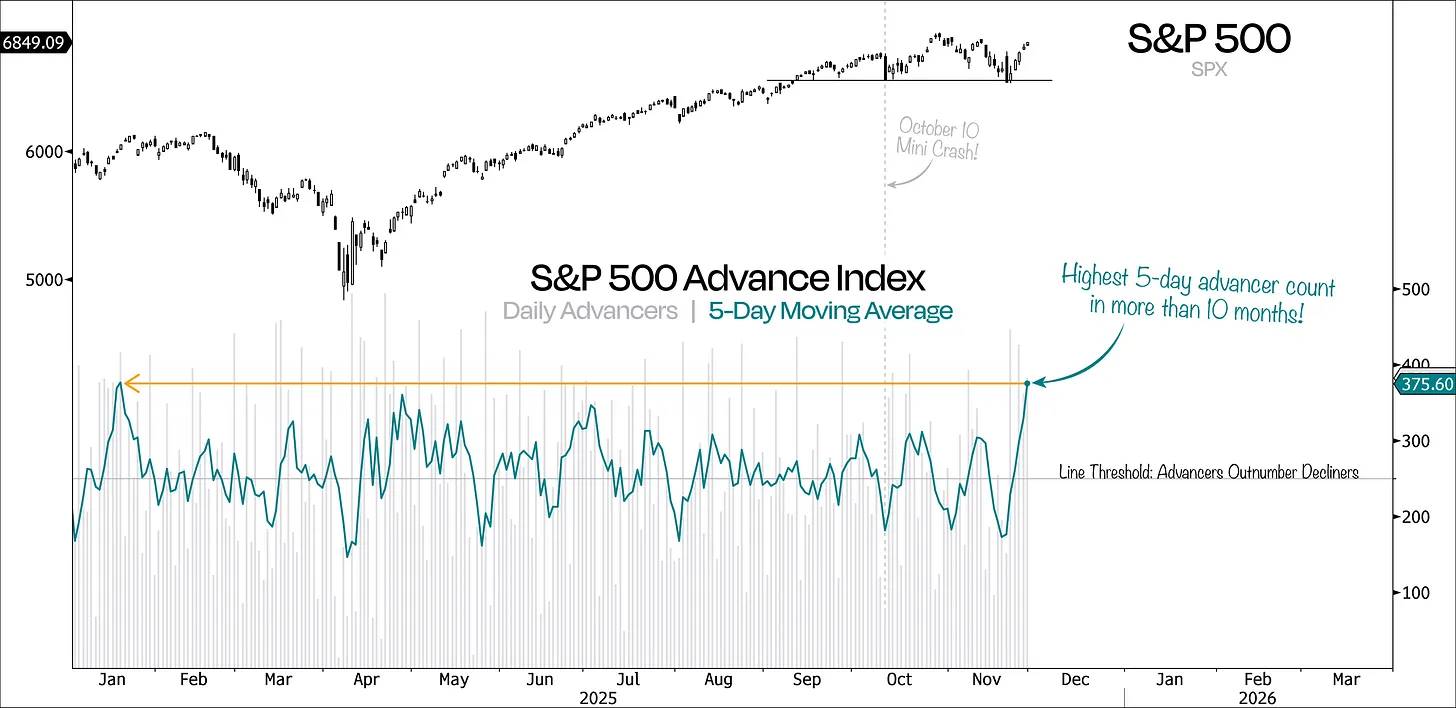
Overall, all of this points to a stronger and more sustainable rebound, far surpassing the initial attempt to rise after the October low. At that time, the S&P 500's upward momentum quickly fizzled due to insufficient market participation. This time, we see the number of stocks rising within a 5-day range has reached a new high in over a year, just a few days ago, this rolling average was at its lowest level in nearly four months.
The last time such a strong rebound occurred was in November 2023, when the S&P 500 rebounded strongly from a 10% pullback. More importantly, it was followed closely by a "Zweig breadth thrust."
Although market breadth is returning, we must also acknowledge that market participation did deteriorate in the months leading up to this rebound. This phenomenon has drawn widespread attention—and there are indeed reasons for it. However, breadth is equally important when viewed from a longer time dimension.
Traditional breadth indicators, such as the proportion of stocks trading above the 200-day moving average or the number of stocks hitting 52-week highs, often represent only "point analysis." A rapid and severe sell-off can almost instantaneously weaken these indicators, making them often unable to reflect more representative long-term participation.
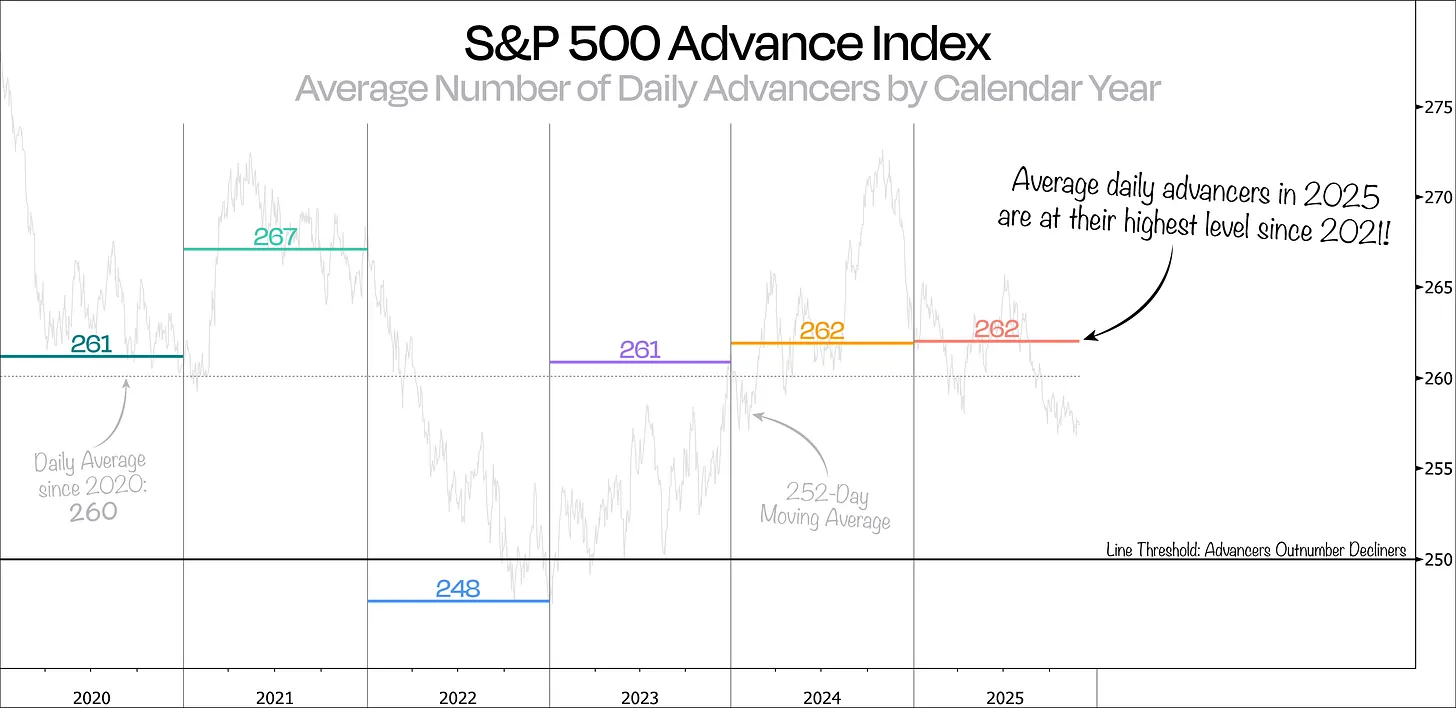
A better way to track long-term market participation is to observe the average number of advancing stocks per day throughout the year or use a rolling 252-day average.
From this perspective, the performance in 2025 has been quite strong—the average number of advancing stocks per day has reached its highest level since 2021. In other words, during this year's bull market, market participation has been stronger than in previous years.
It is worth noting that the rolling 1-year average (252 days) is still significantly below this year's average level. The reason is simple: the 252-day average still includes data from last December, when the average number of advancing stocks was only 204, showing extremely weak performance.
As we broaden our view further, the situation becomes even more interesting.
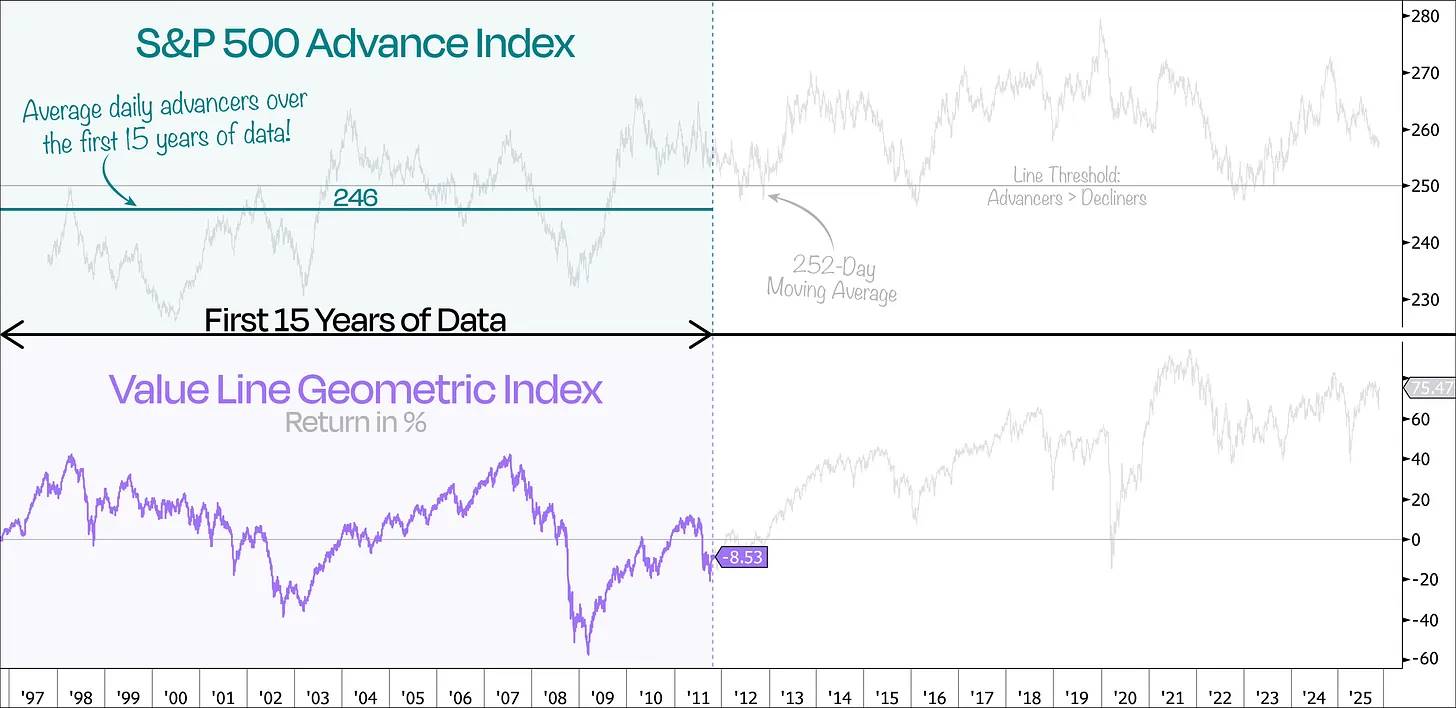
The next chart shows the complete data of the S&P 500 advancing index, broken down by 5-year average cycles. Contrary to what many might imagine, the rolling 252-day average actually shows that despite the rise of mega-cap stocks, overall market participation has strengthened rather than weakened.
Additionally, aside from 2025, which has shown near 30-year highs in the average number of advancing stocks per day, we can also see how narrow market participation was just before the peak of the internet bubble. In fact, one of the worst 1-year periods was right around the March 2000 bubble burst, when market participation was extremely low.
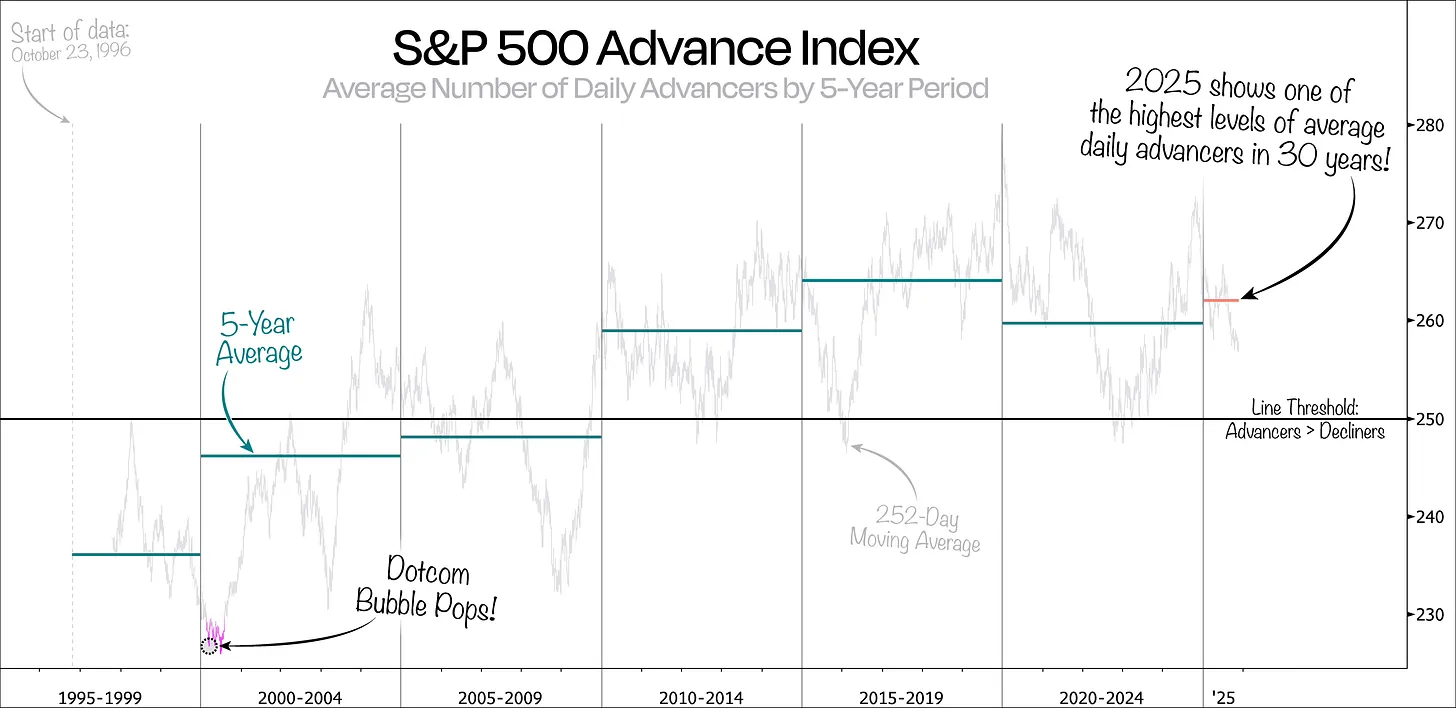
Although this set of data covers nearly 30 years, we can't help but notice that for most of the first 15 years, market breadth indicators remained below the critical line of 250— the dividing line where the number of advancing stocks exceeds the number of declining stocks.
In fact, when we plot the average number of advancing stocks over these first 15 years, the average number of advancing stocks in the S&P 500 was only around 246—meaning that on average, the number of declining stocks exceeded that of advancing stocks.
This phenomenon is consistent with the performance of the "Value Line Geometric Index," which tracks the average performance of ordinary stocks. During the same period, the average ordinary stock in that index declined by about 8.5%, while the S&P 500 overall rose by 75%.
So, what does this mean for us?
It can be said that today's market is fundamentally different from the past.
Indeed, there are occasionally a few mega-cap stocks that become the focus of the market—given their size, this is almost inevitable. But what is unique about the current market is that more stocks are participating in the market's rise.
However, it is important to note that broader participation does not equate to an even distribution of contributions. Large companies will still dominate the index's returns, but the participation of more stocks indicates a healthier market.
Conclusion: Broad market participation = healthy market; centralized returns = the role of the index mechanism.
免责声明:本文章仅代表作者个人观点,不代表本平台的立场和观点。本文章仅供信息分享,不构成对任何人的任何投资建议。用户与作者之间的任何争议,与本平台无关。如网页中刊载的文章或图片涉及侵权,请提供相关的权利证明和身份证明发送邮件到support@aicoin.com,本平台相关工作人员将会进行核查。


