On October 28th at 16:00, the AICoin editor conducted a graphic and text sharing on the topic of "Fibonacci + TD Strategy" in the 【AICoin PC - Group Chat - Live】. Below is a summary of the live content.
Today's explanation focuses on examples.
Building on the theory from the last session, our theory is:
Subscribe to a rich signal system in the indicator community, using Fibonacci to identify whether it's worth entering,
that is, to operate through a combination of manual and strategy signals.
In fact, this can also be applied to everyone's daily recognition. Many students may follow some teachers or friends' operations, so whether this operation is worth it can also be judged using Fibonacci to assess the signal value.
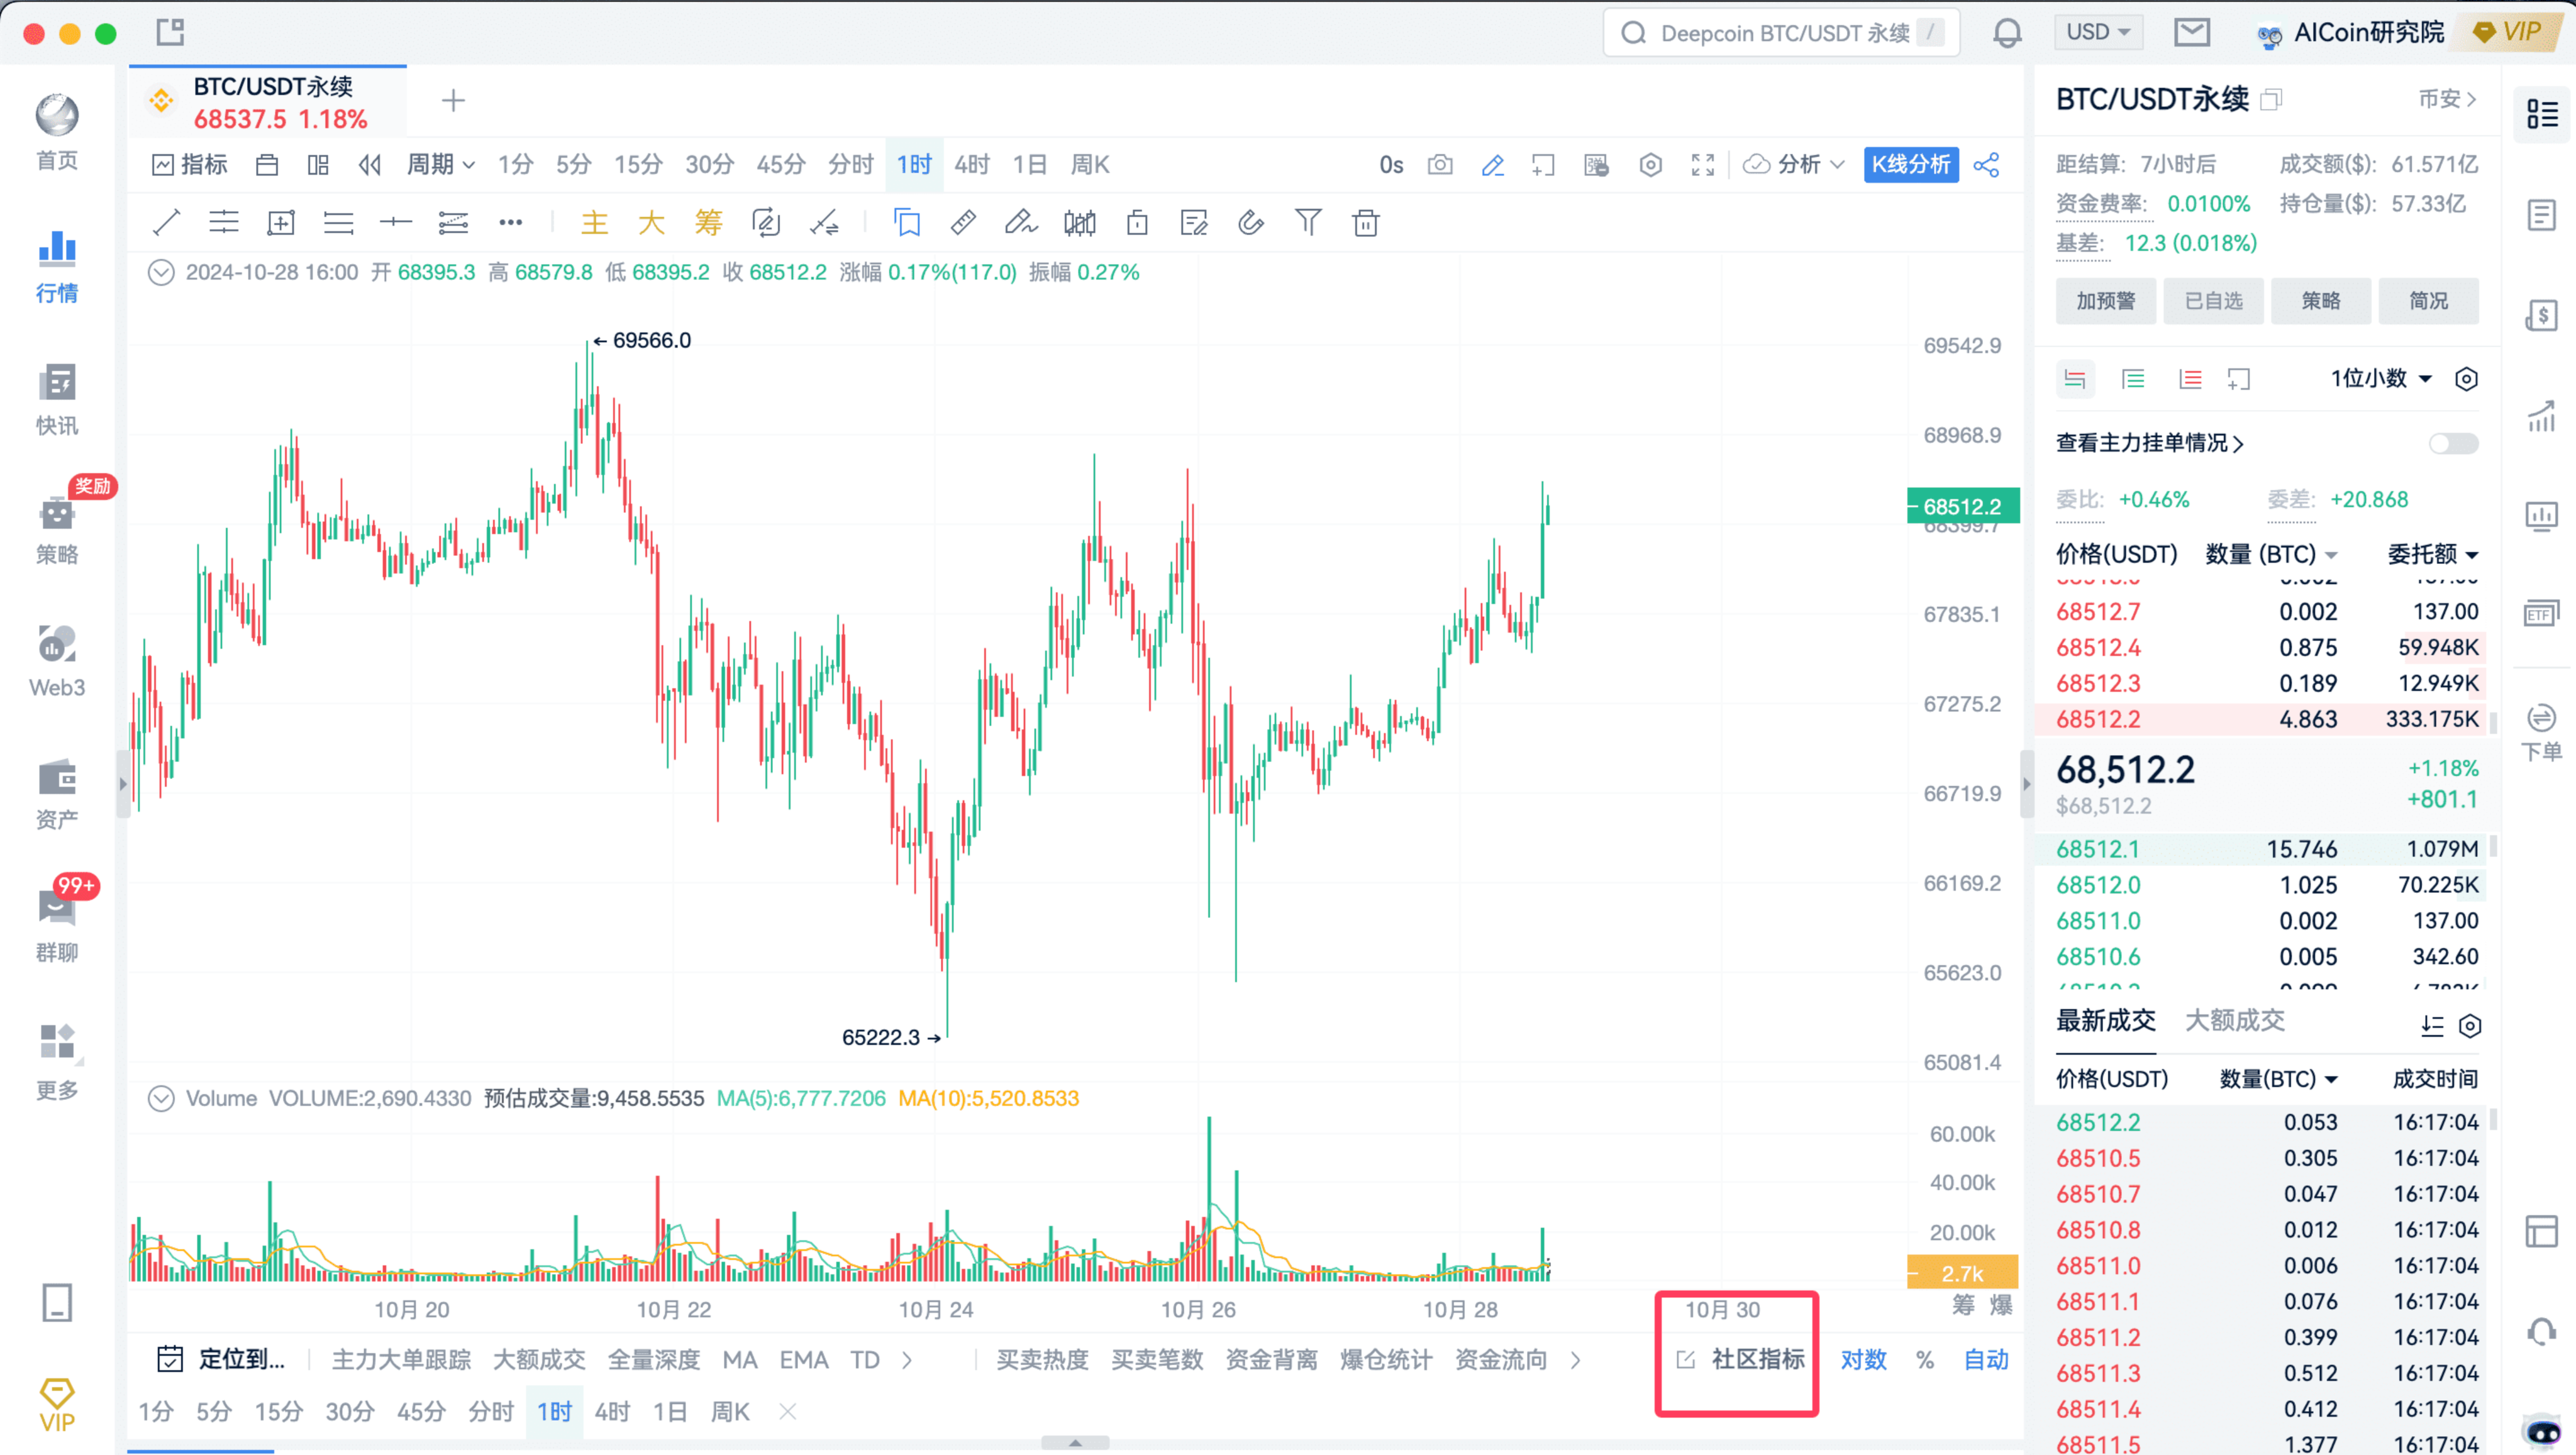
First, you can open Bitcoin and look at historical signals, then check real-time signals.
We will first analyze the signals on a 1-hour timeframe, and the practical indicator is TD.
- Click here
- Select this set
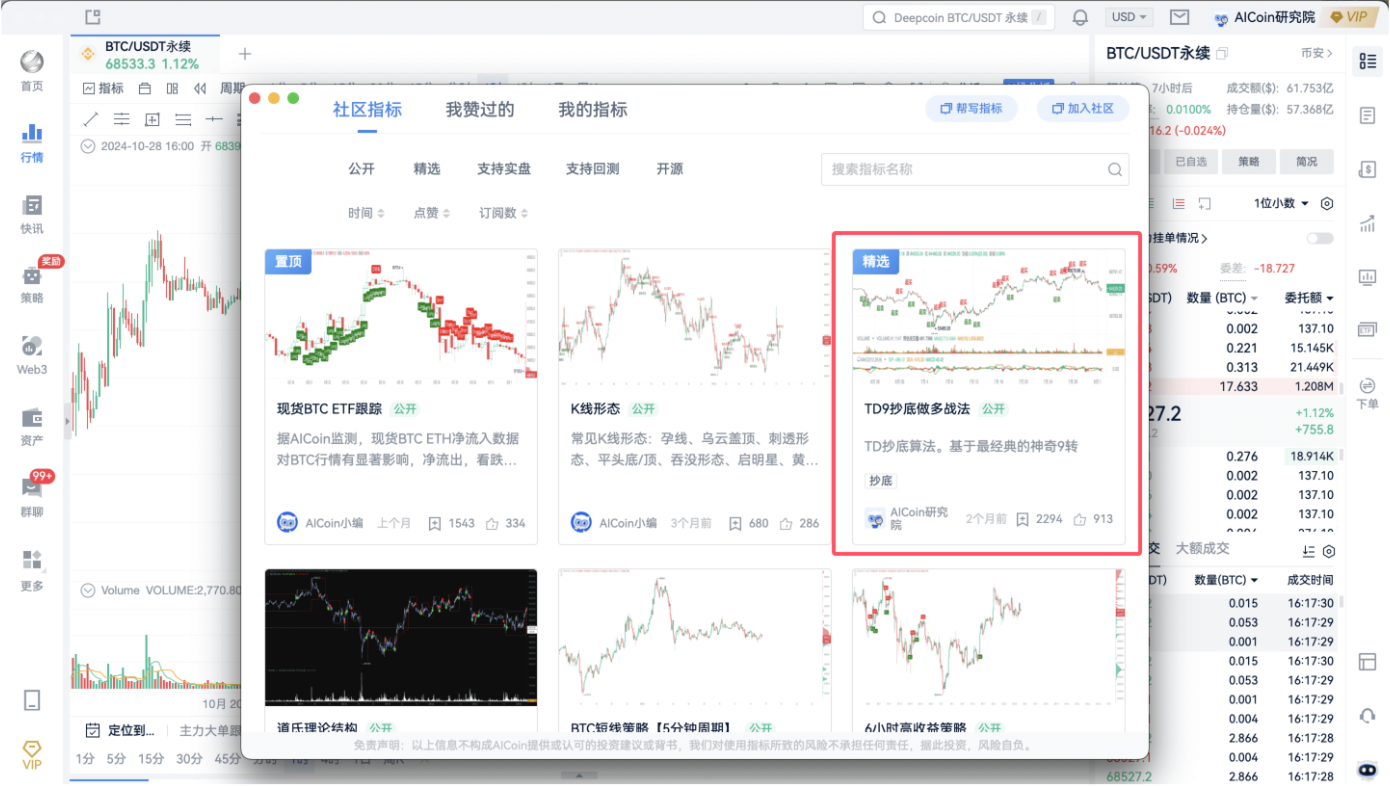
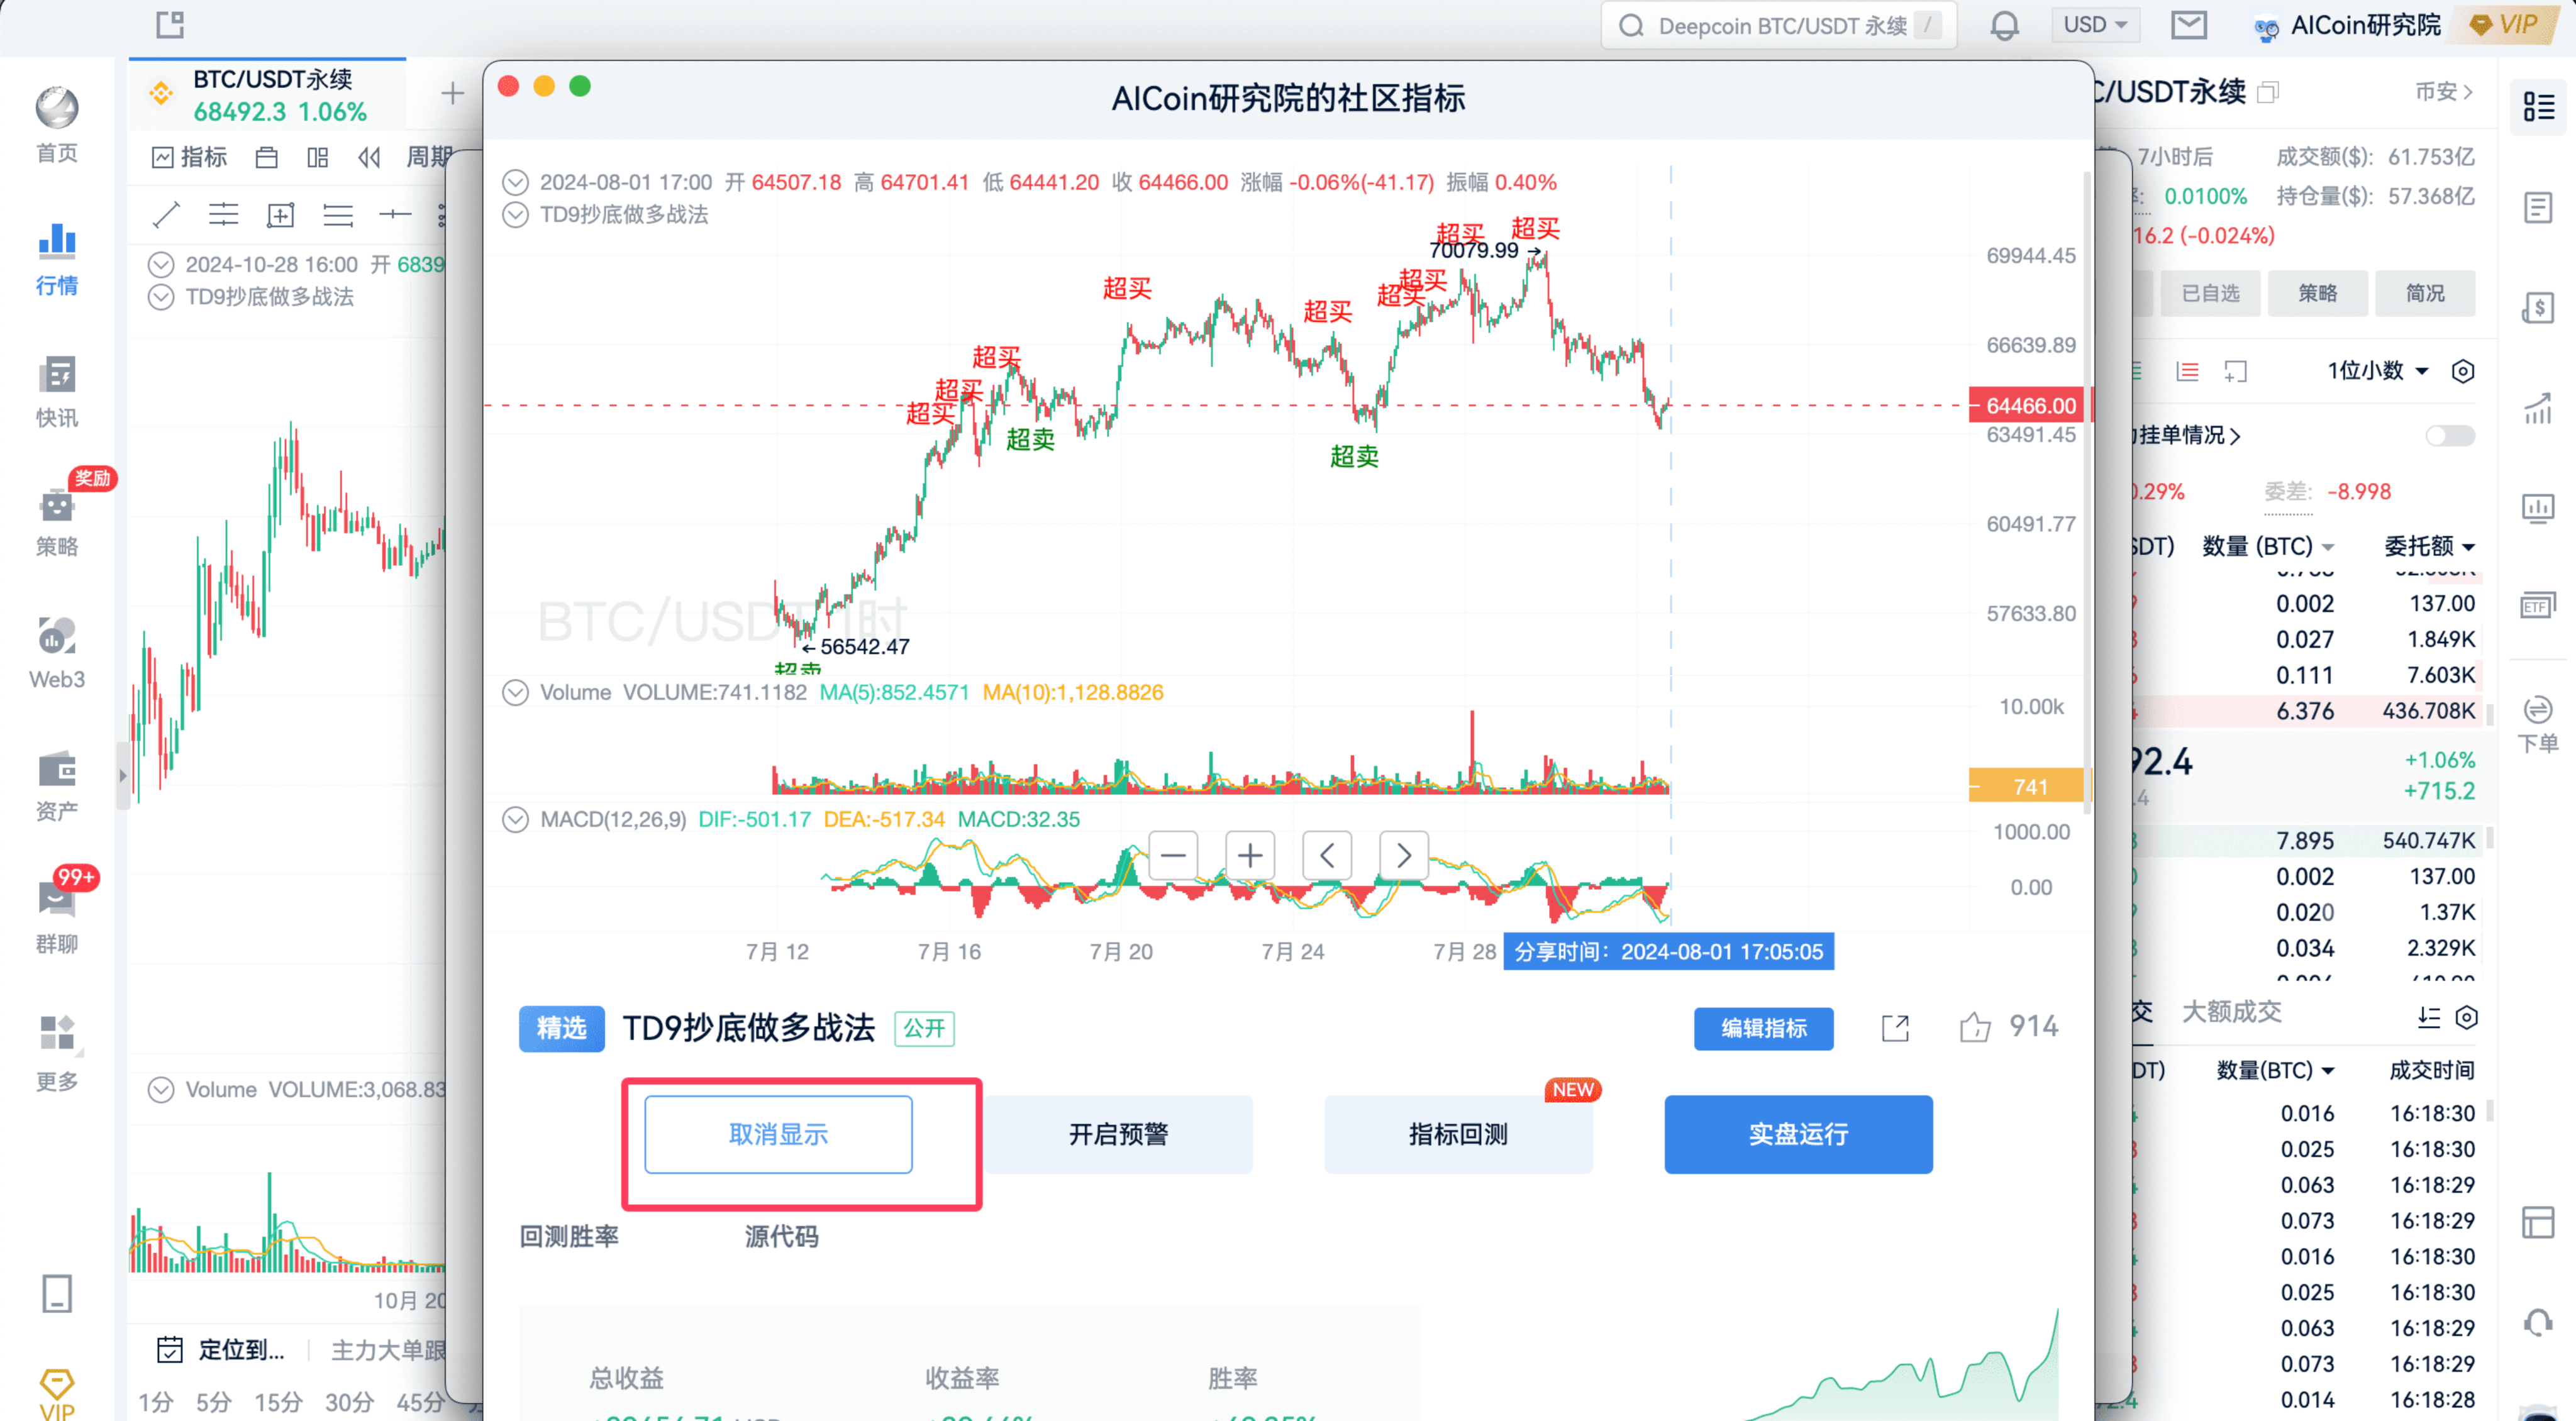
- After subscribing, it will display on the K-line
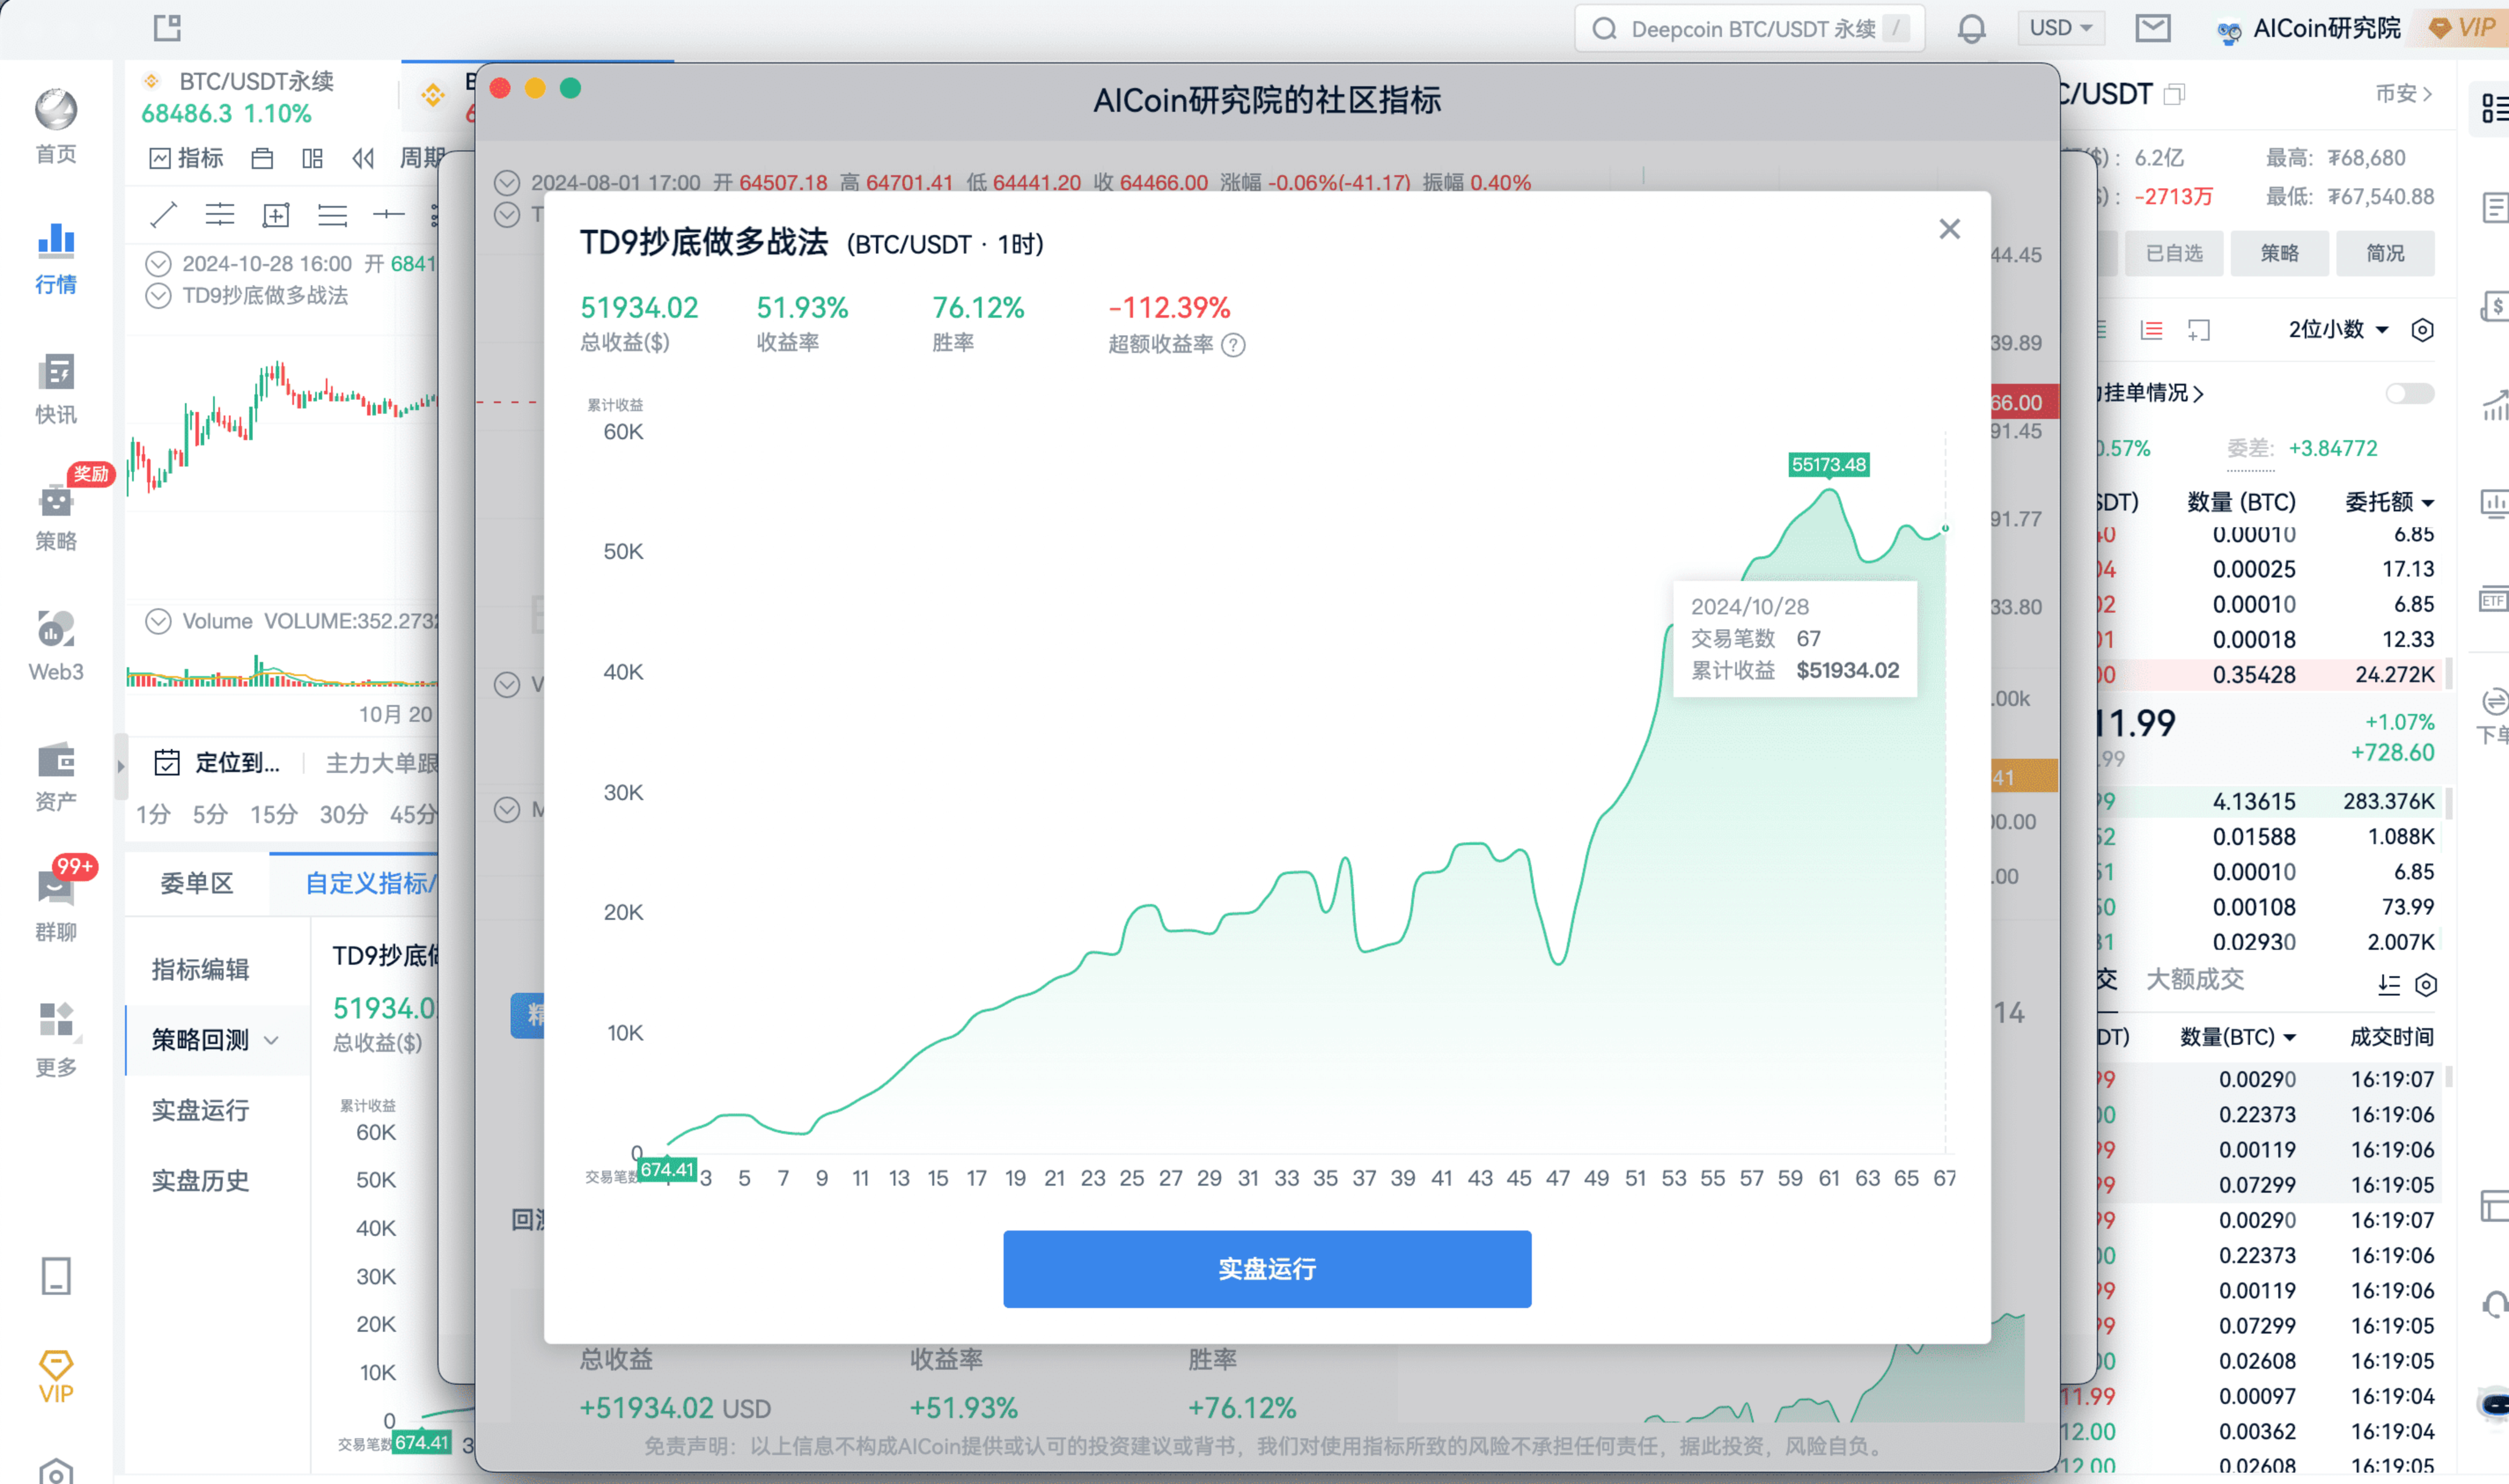
From backtesting, this set of indicators is very strong, with profits consistently rising.
This is the effect after subscribing.
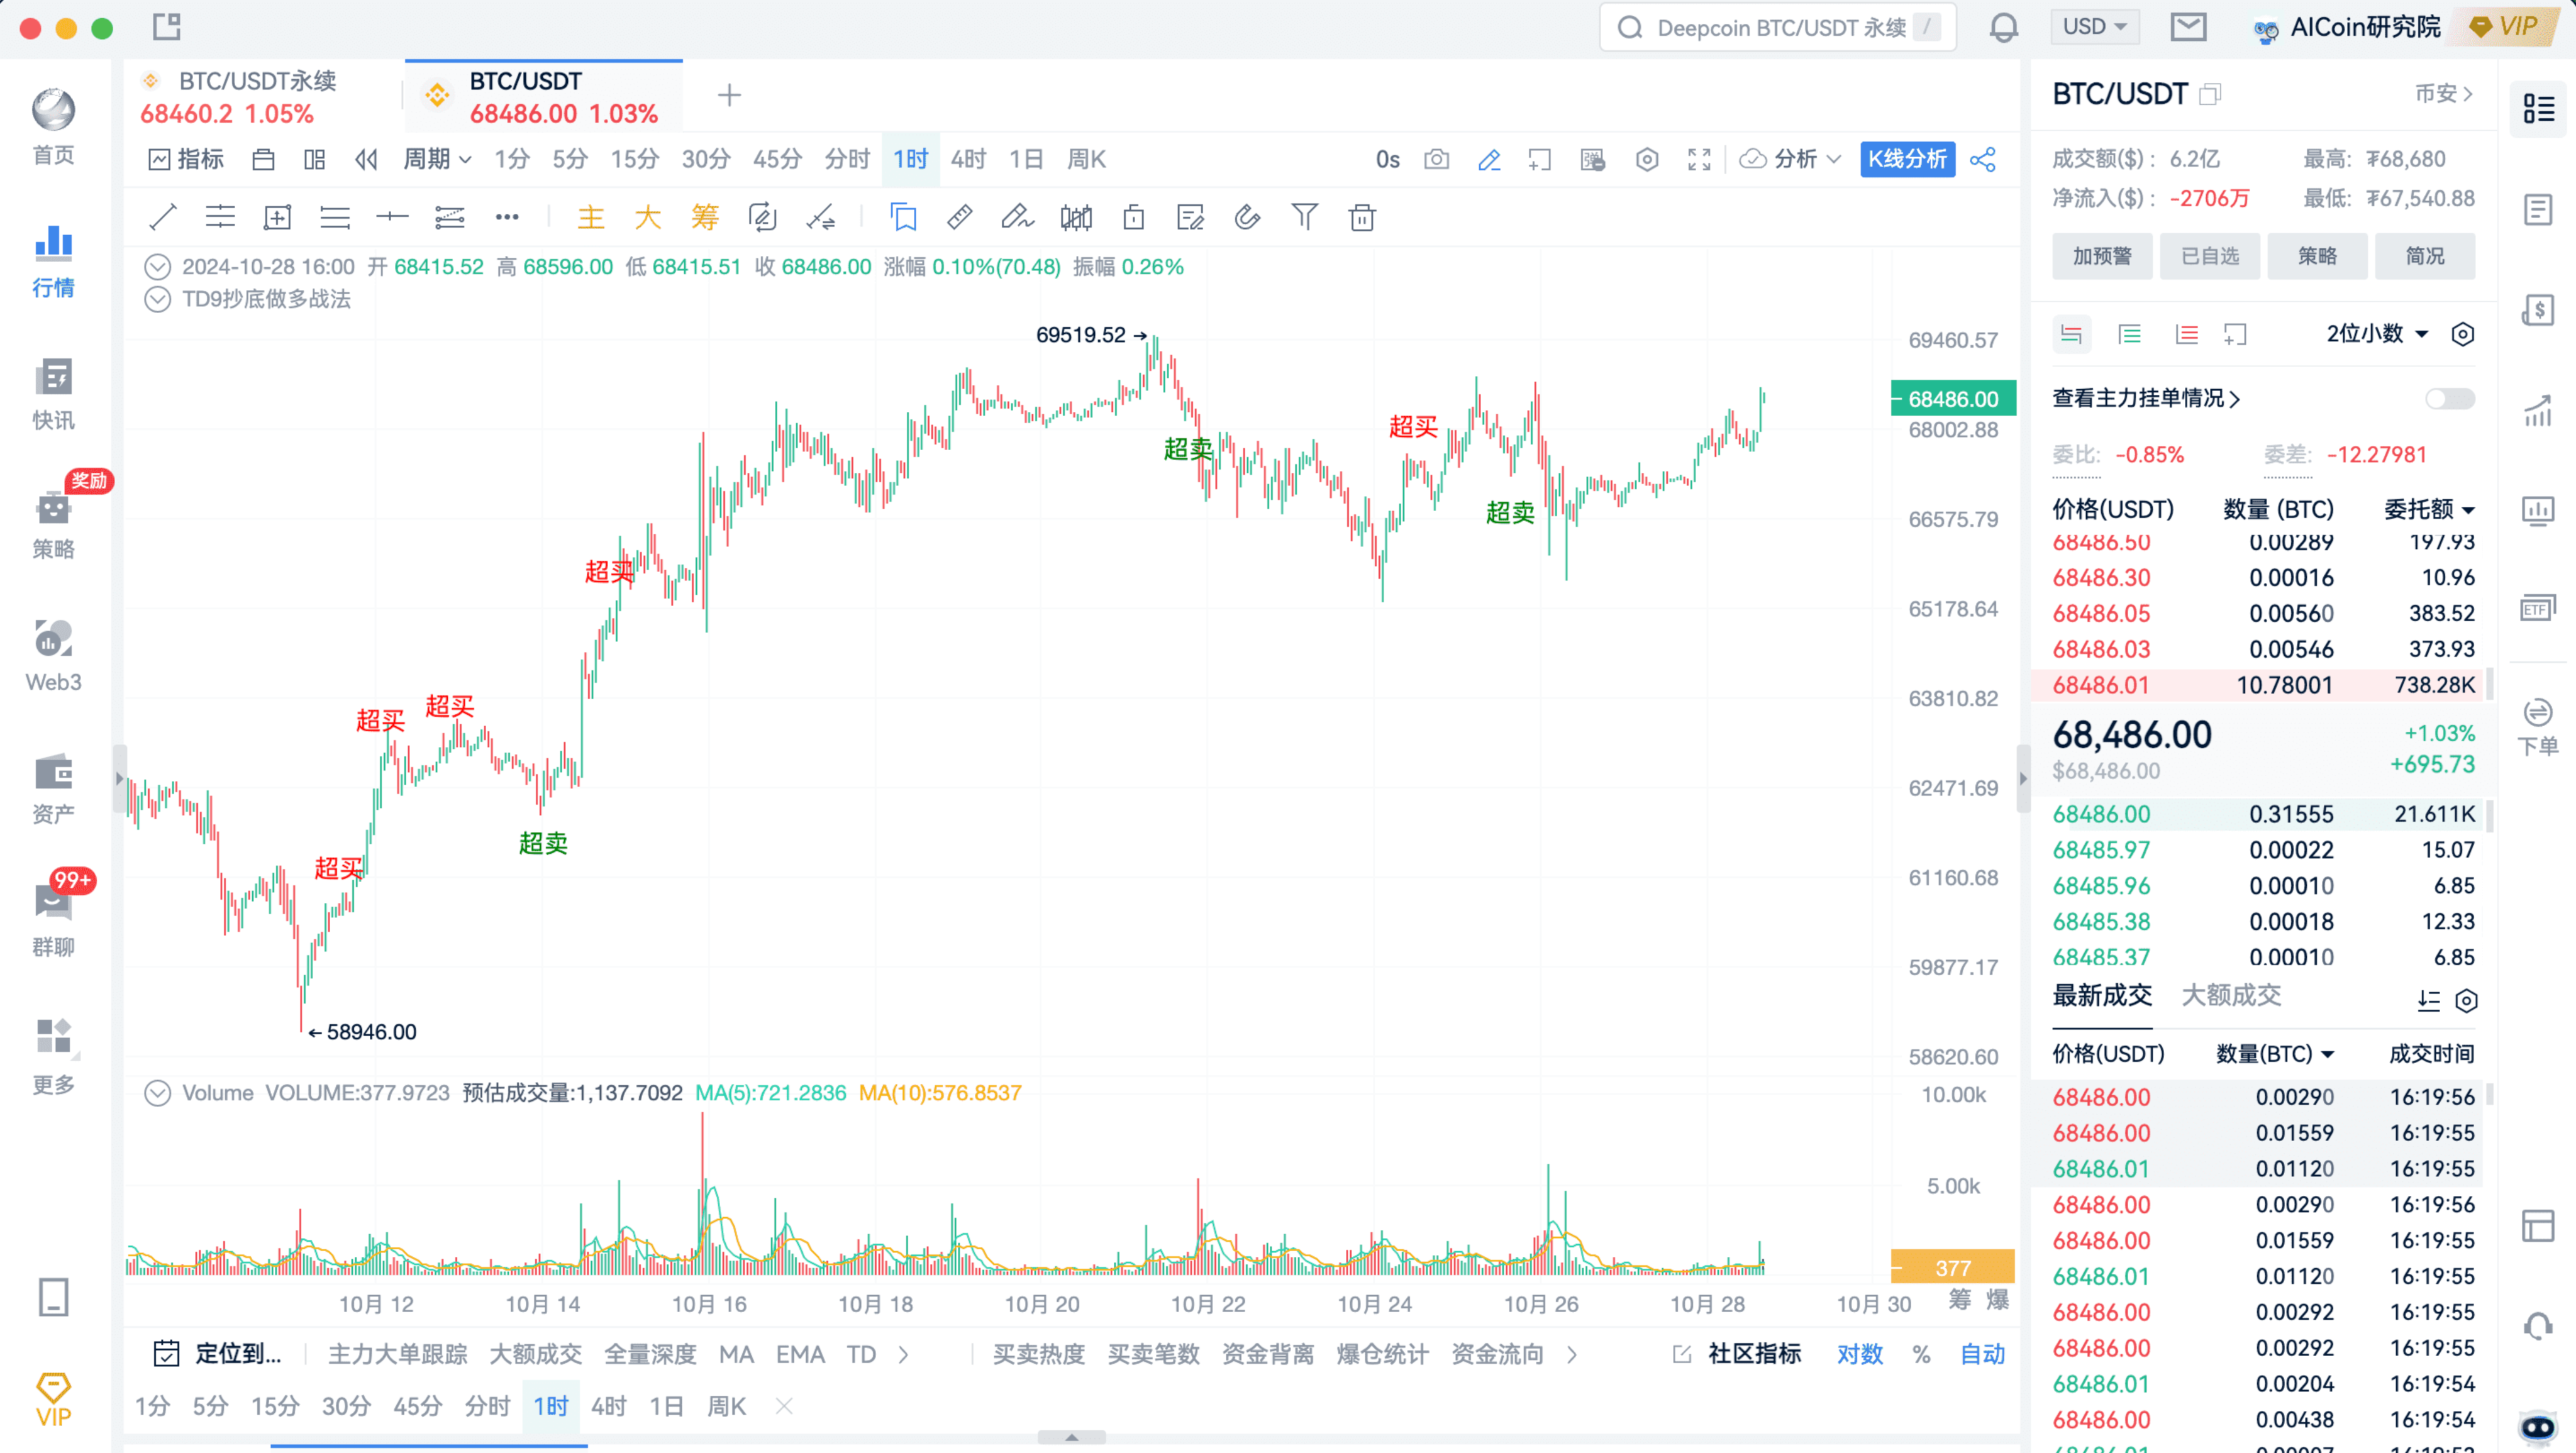
Here, I will briefly explain the principle of this set of indicators:
● When there is an oversold signal: go long
● When there is an overbought signal: close long
Since this set of indicators is a bottom-fishing long strategy in an upward trend, it can actually work well on its own without Fibonacci, with a relatively high win rate, basically catching the bottom.
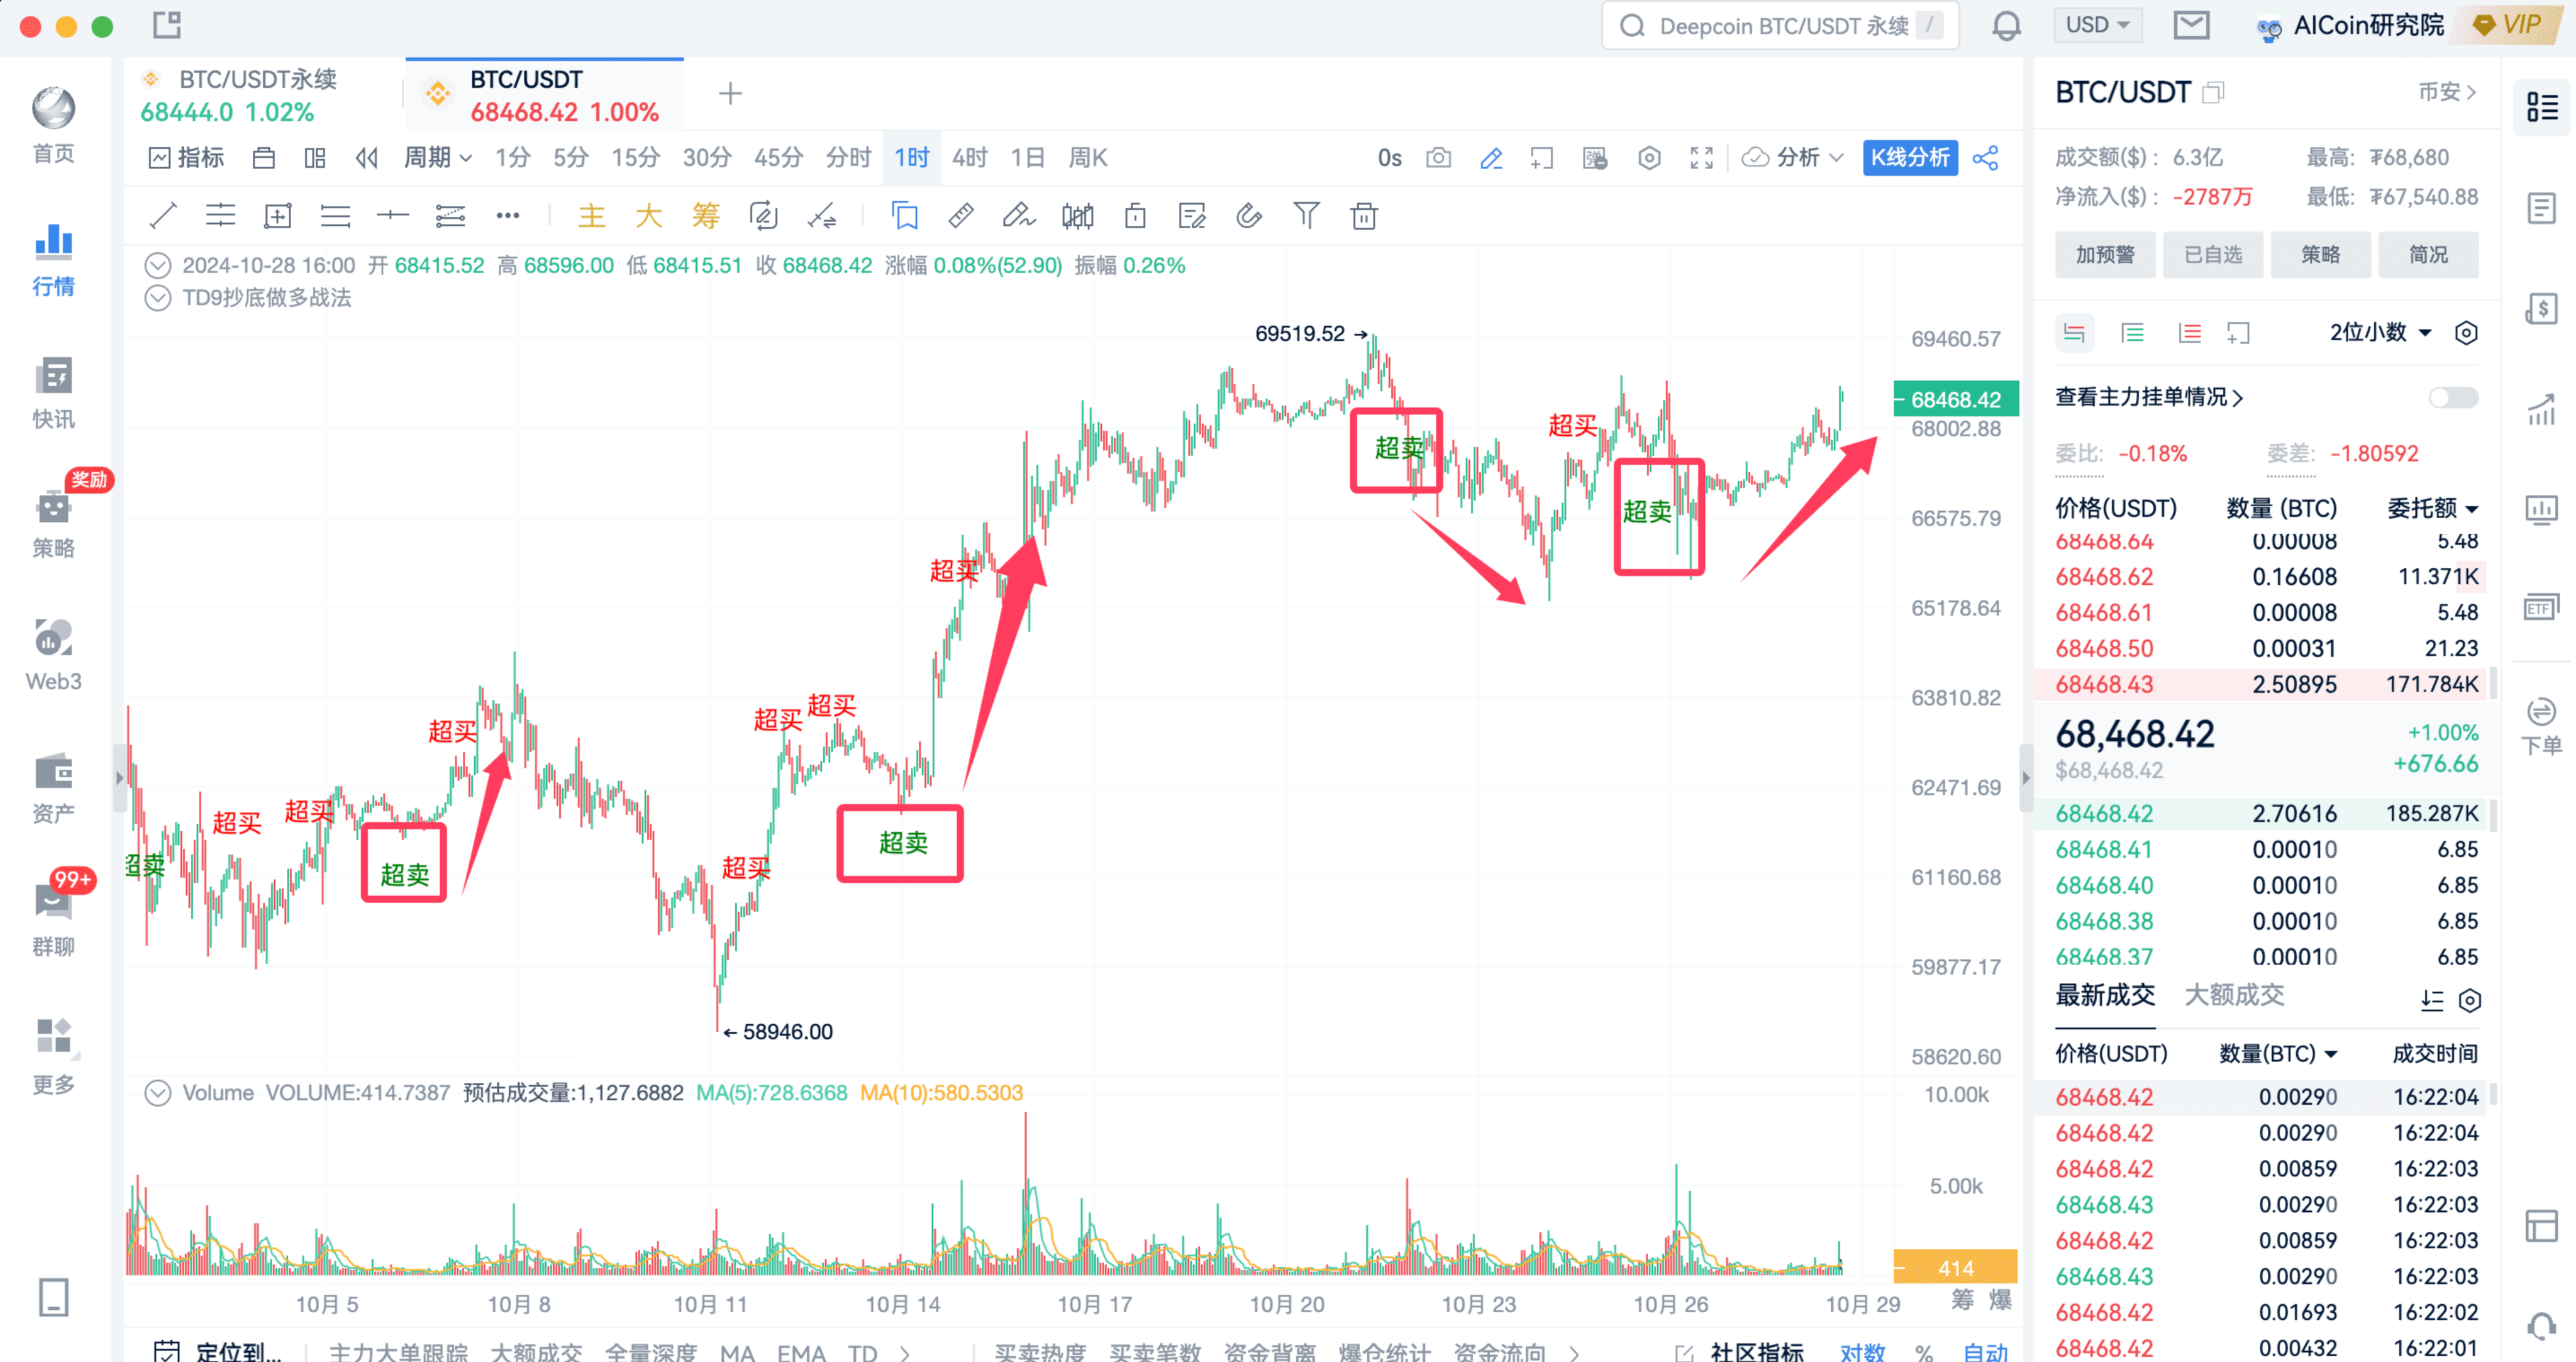
: So how should we operate in conjunction with Fibonacci to boost our confidence!
: As we discussed last time, Fibonacci is the best tool for measuring pullback support levels.
Therefore, to determine whether this TD signal is good, beautiful, or at a golden level, we can open Fibonacci and use it to analyze the signals from this set of indicators.
Now, please follow me to find the Fibonacci indicator, as it is a commonly used indicator by the host, so I have placed it here.
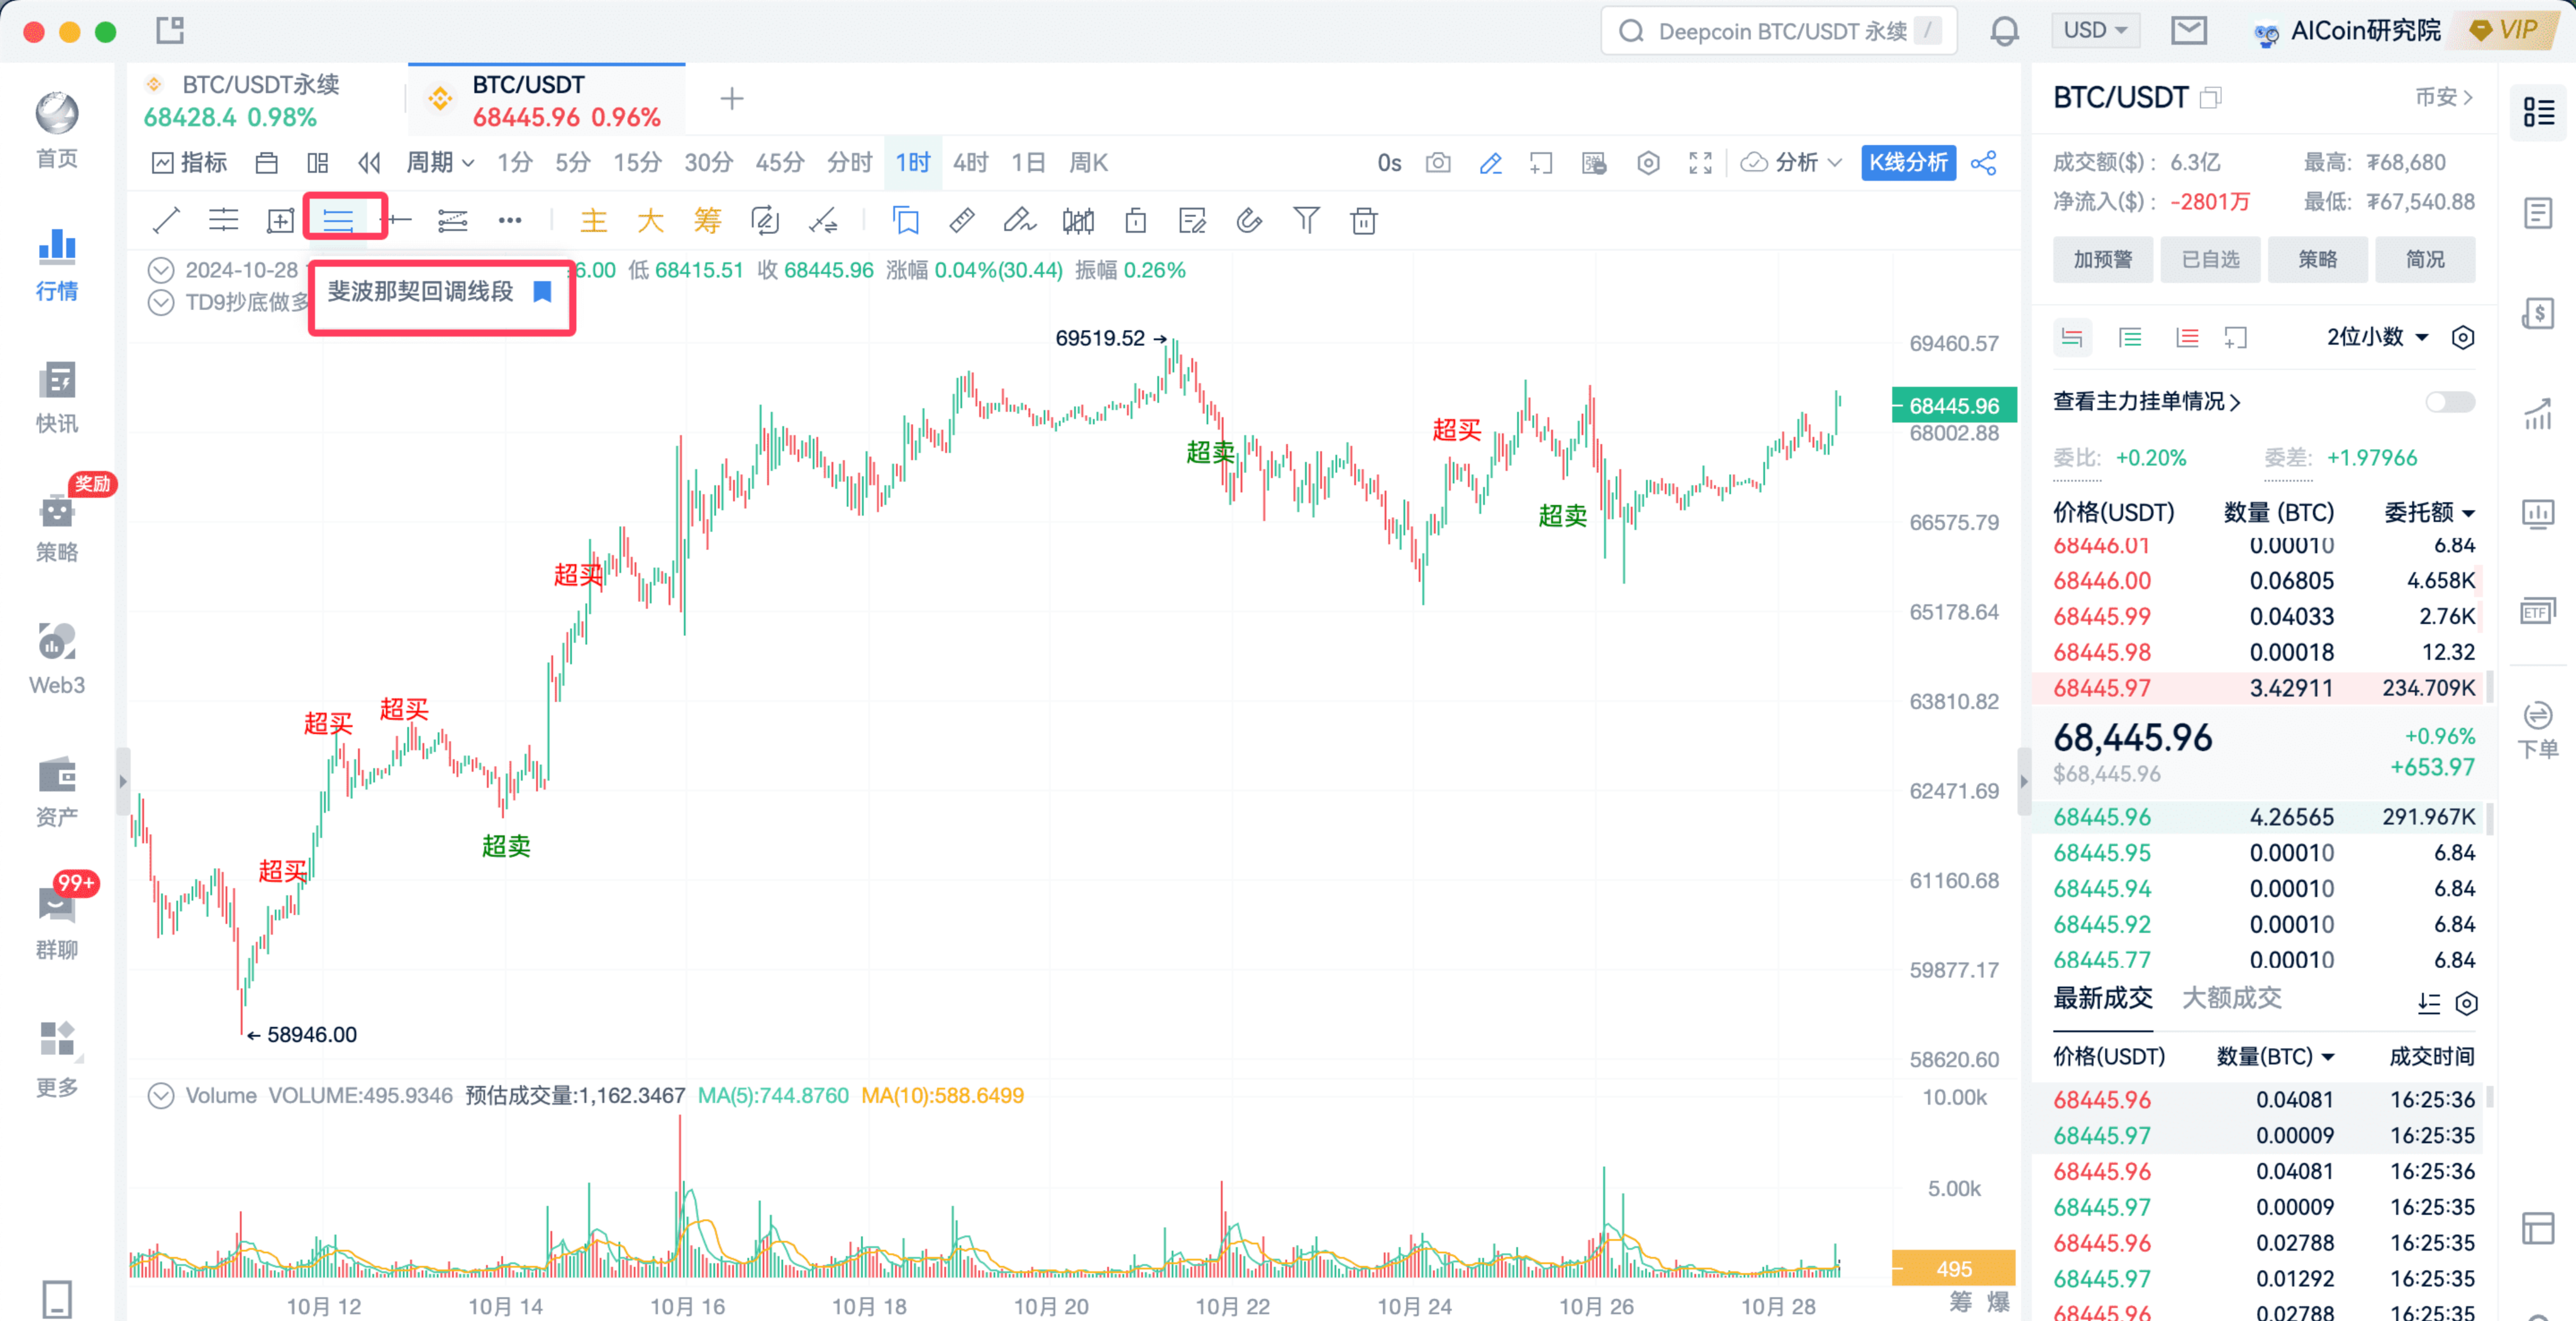
Fibonacci is super simple!
Find the lowest point, connect it to the highest point, and its support and resistance will emerge!
We are not predicting the future; rather, we are making judgments about support and resistance levels based on already occurred data. Combined with indicator signals, if a signal occurs at a support level, you can enter with full confidence.
Generally, when we look for the highest and lowest points, we don't need to be overly precise. Please remember, trading cryptocurrencies is not like doing math problems. Just select a segment of the market's highs and lows and connect them, as we are using historical highs and lows to draw current support and resistance, similar to here.
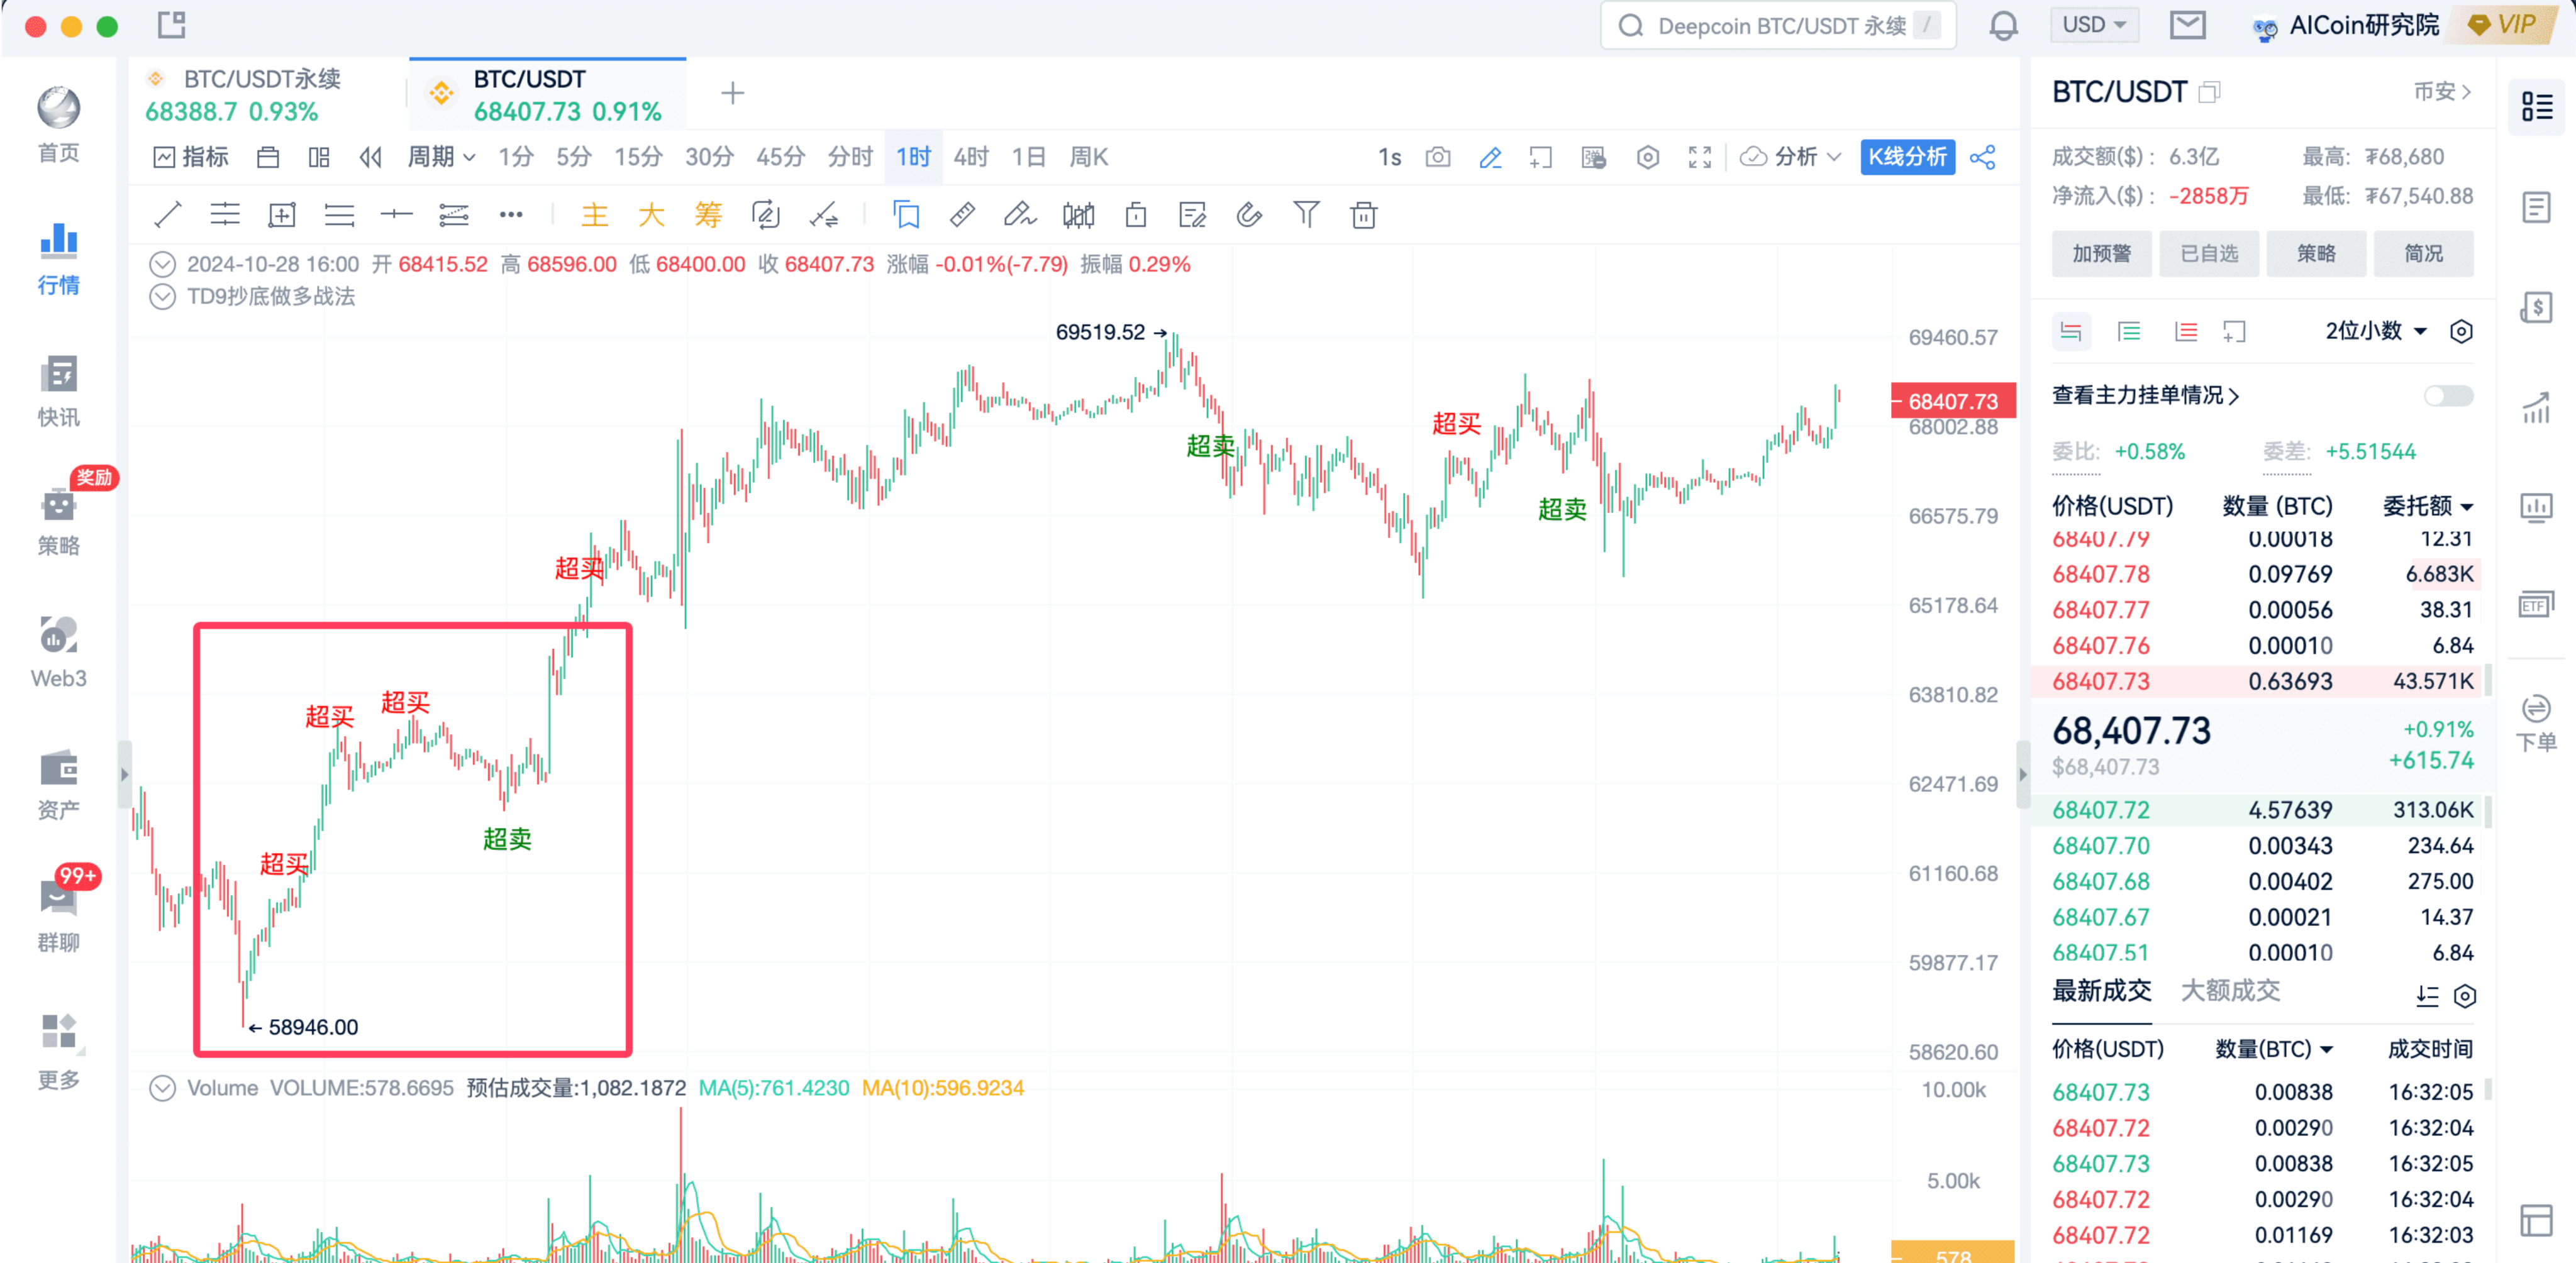
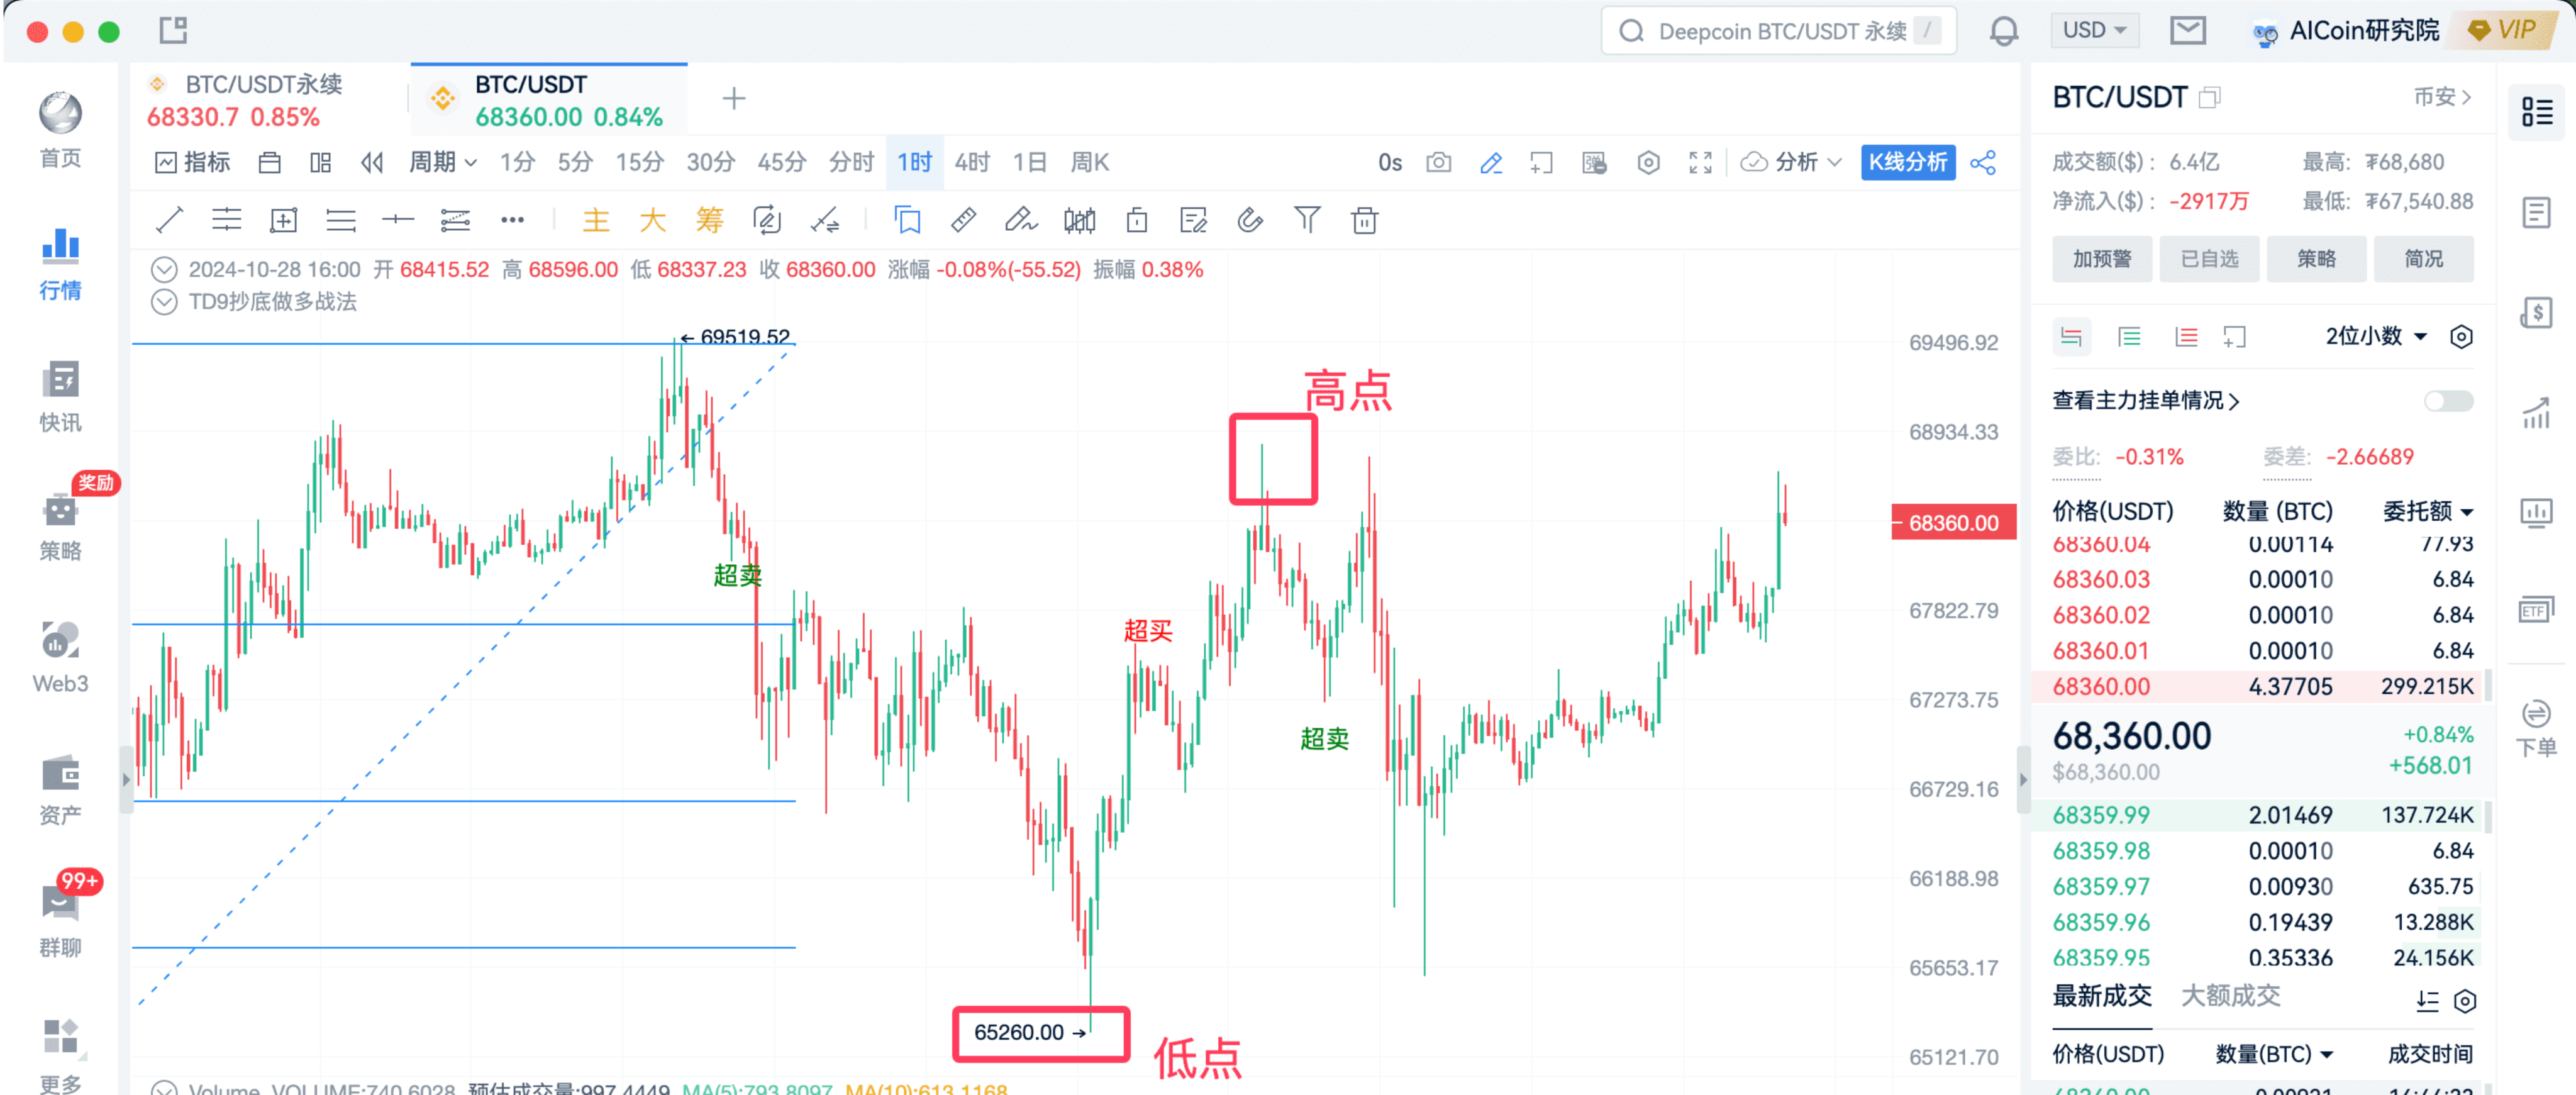
: Our system has issued this oversold signal; should we enter?
: At this time, we can use Fibonacci to analyze.
First, we don't know the future trend of this box, so we can pull the K-line back a bit and zoom in, which will look like this.
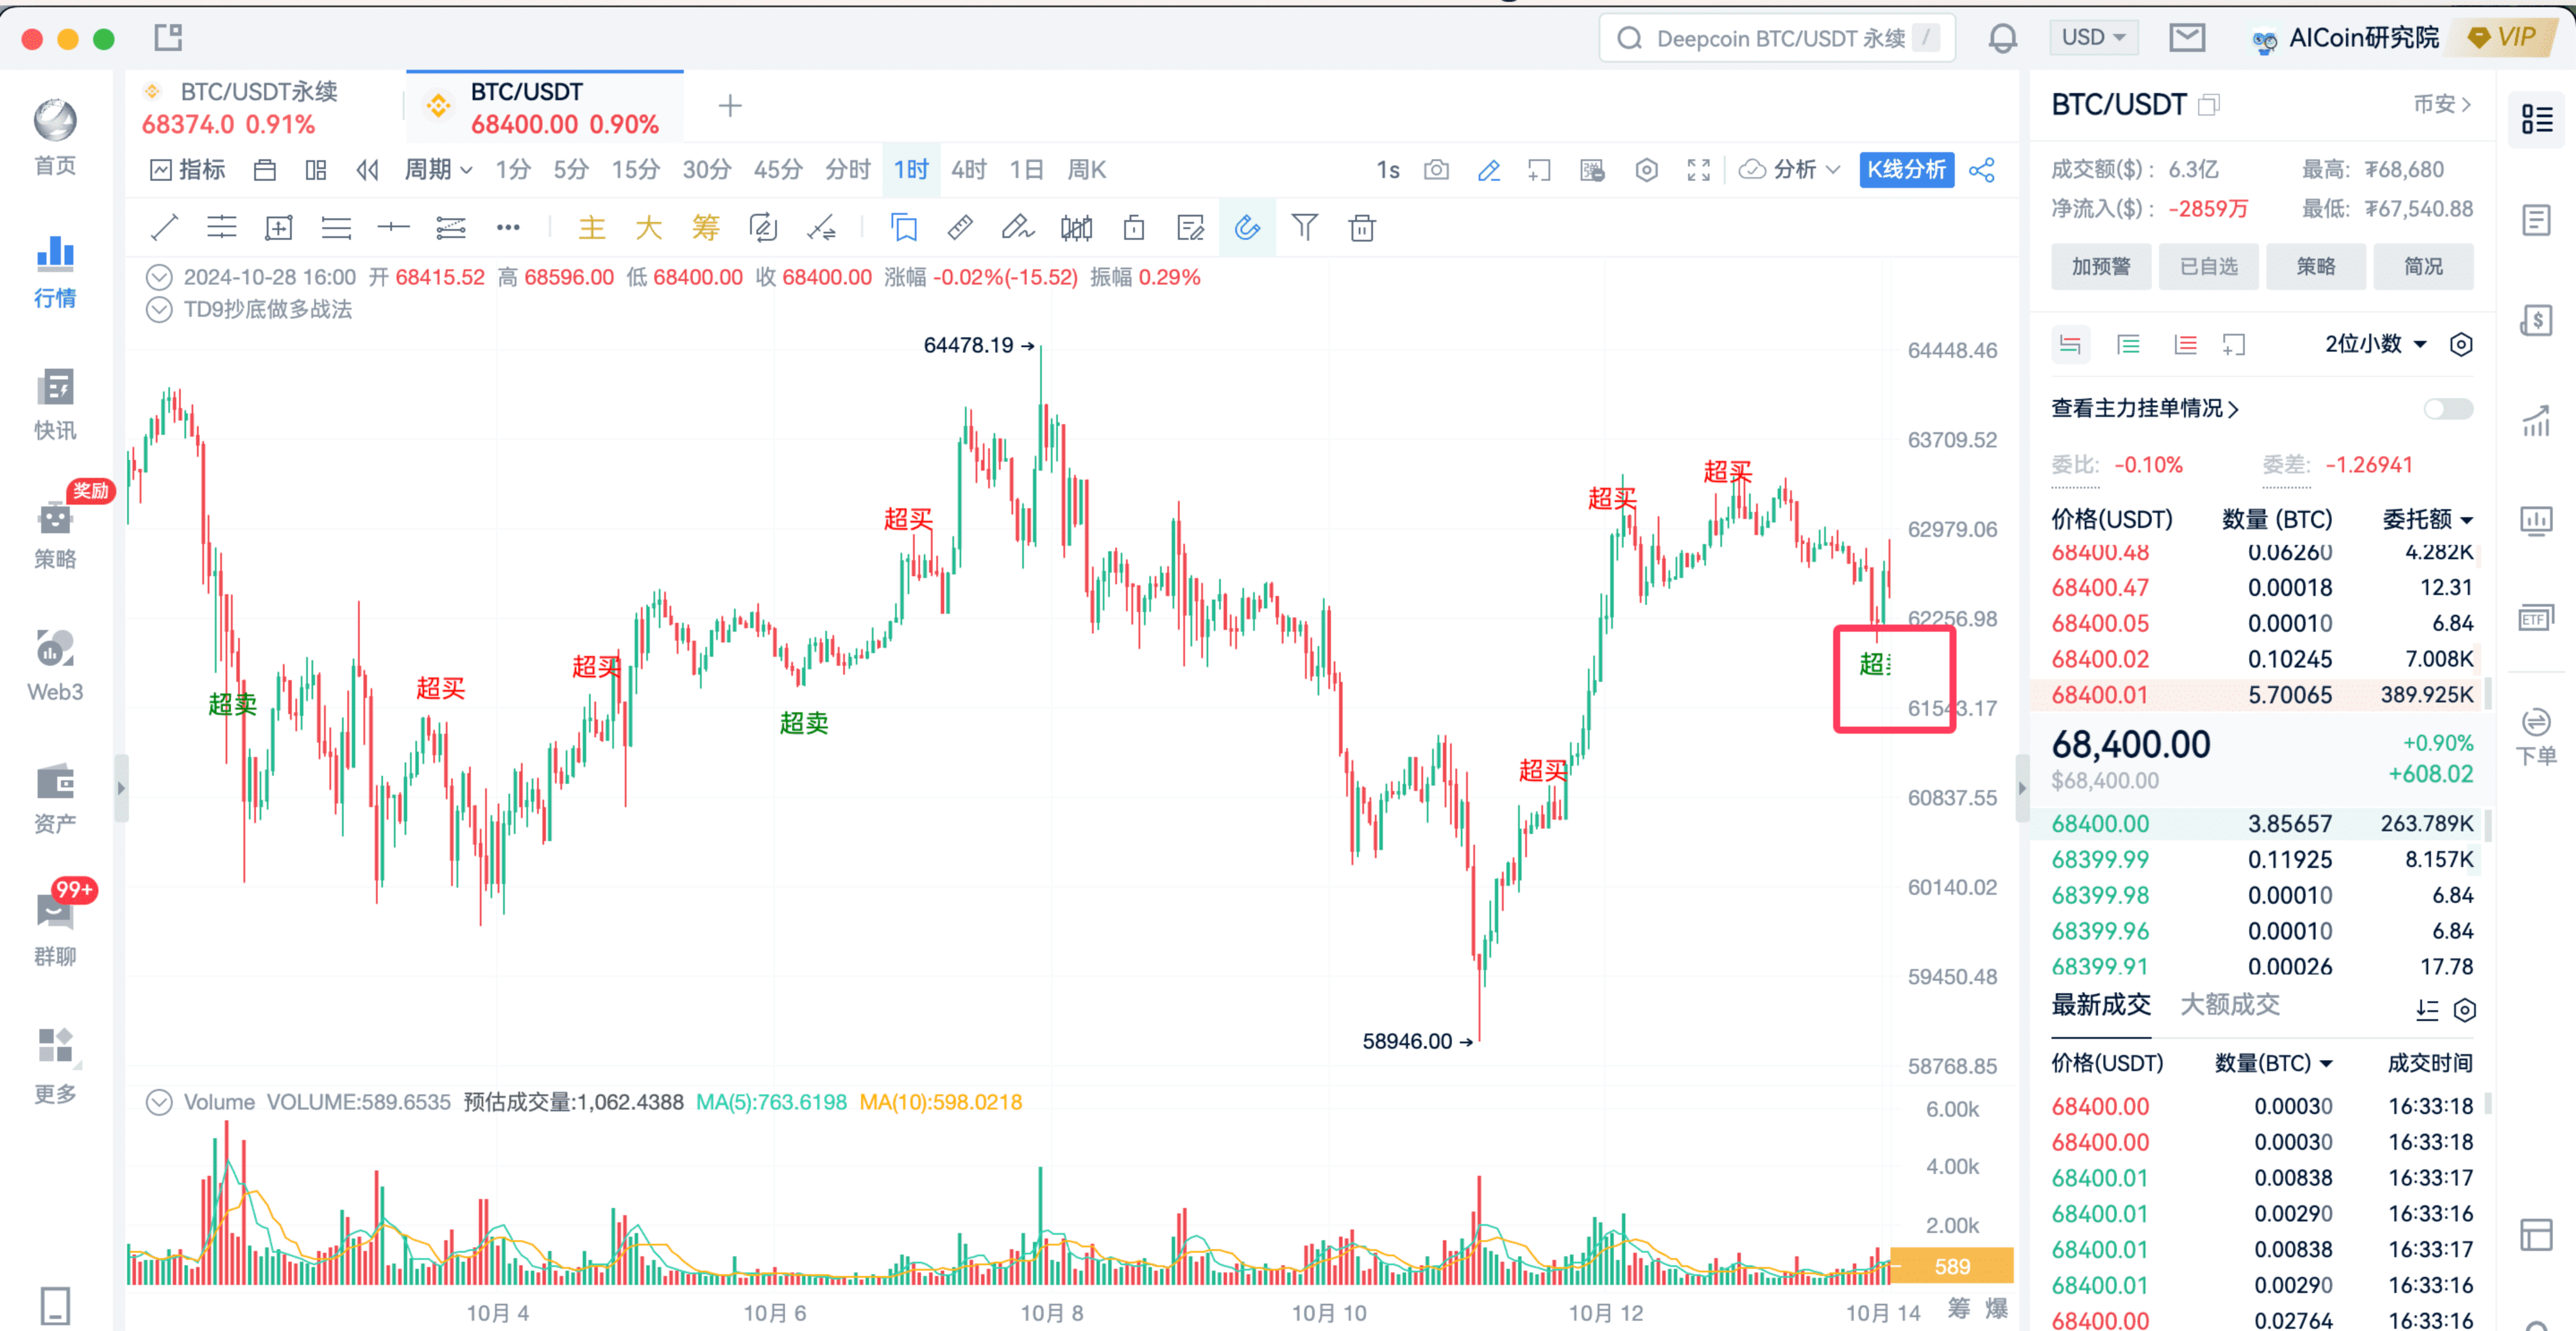
: At this point, when you see the signal, will you go long or ignore it?
: Because the market is falling, you feel uncertain.
At this time, you can bring out your Fibonacci retracement. For this signal, just use the most recent low and high points of this segment of the market.
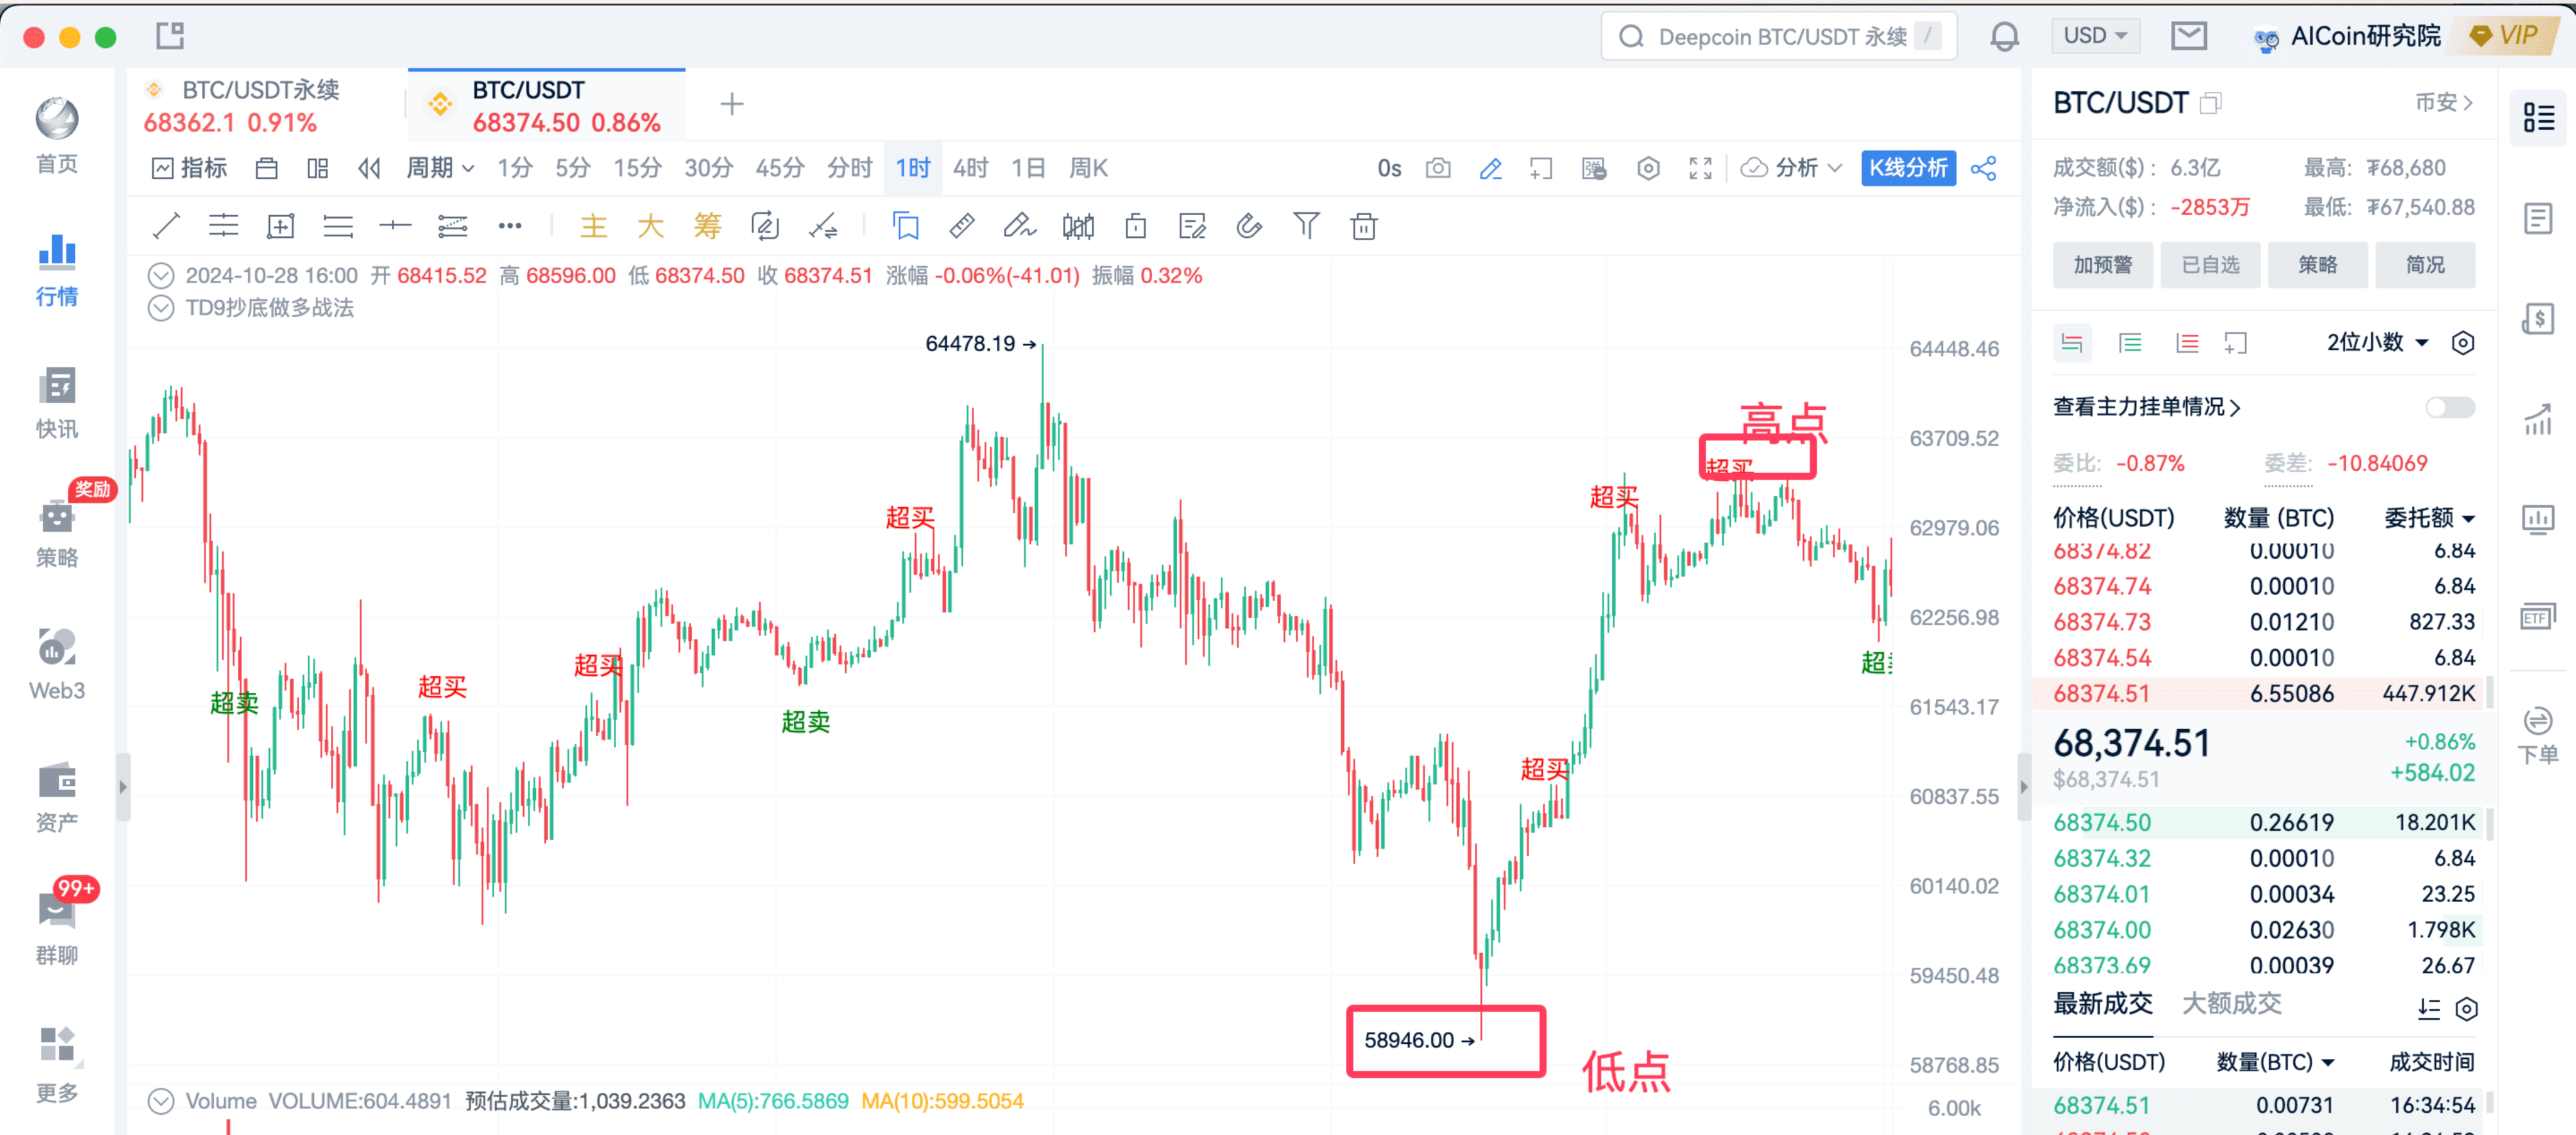
We connect the low and high points.
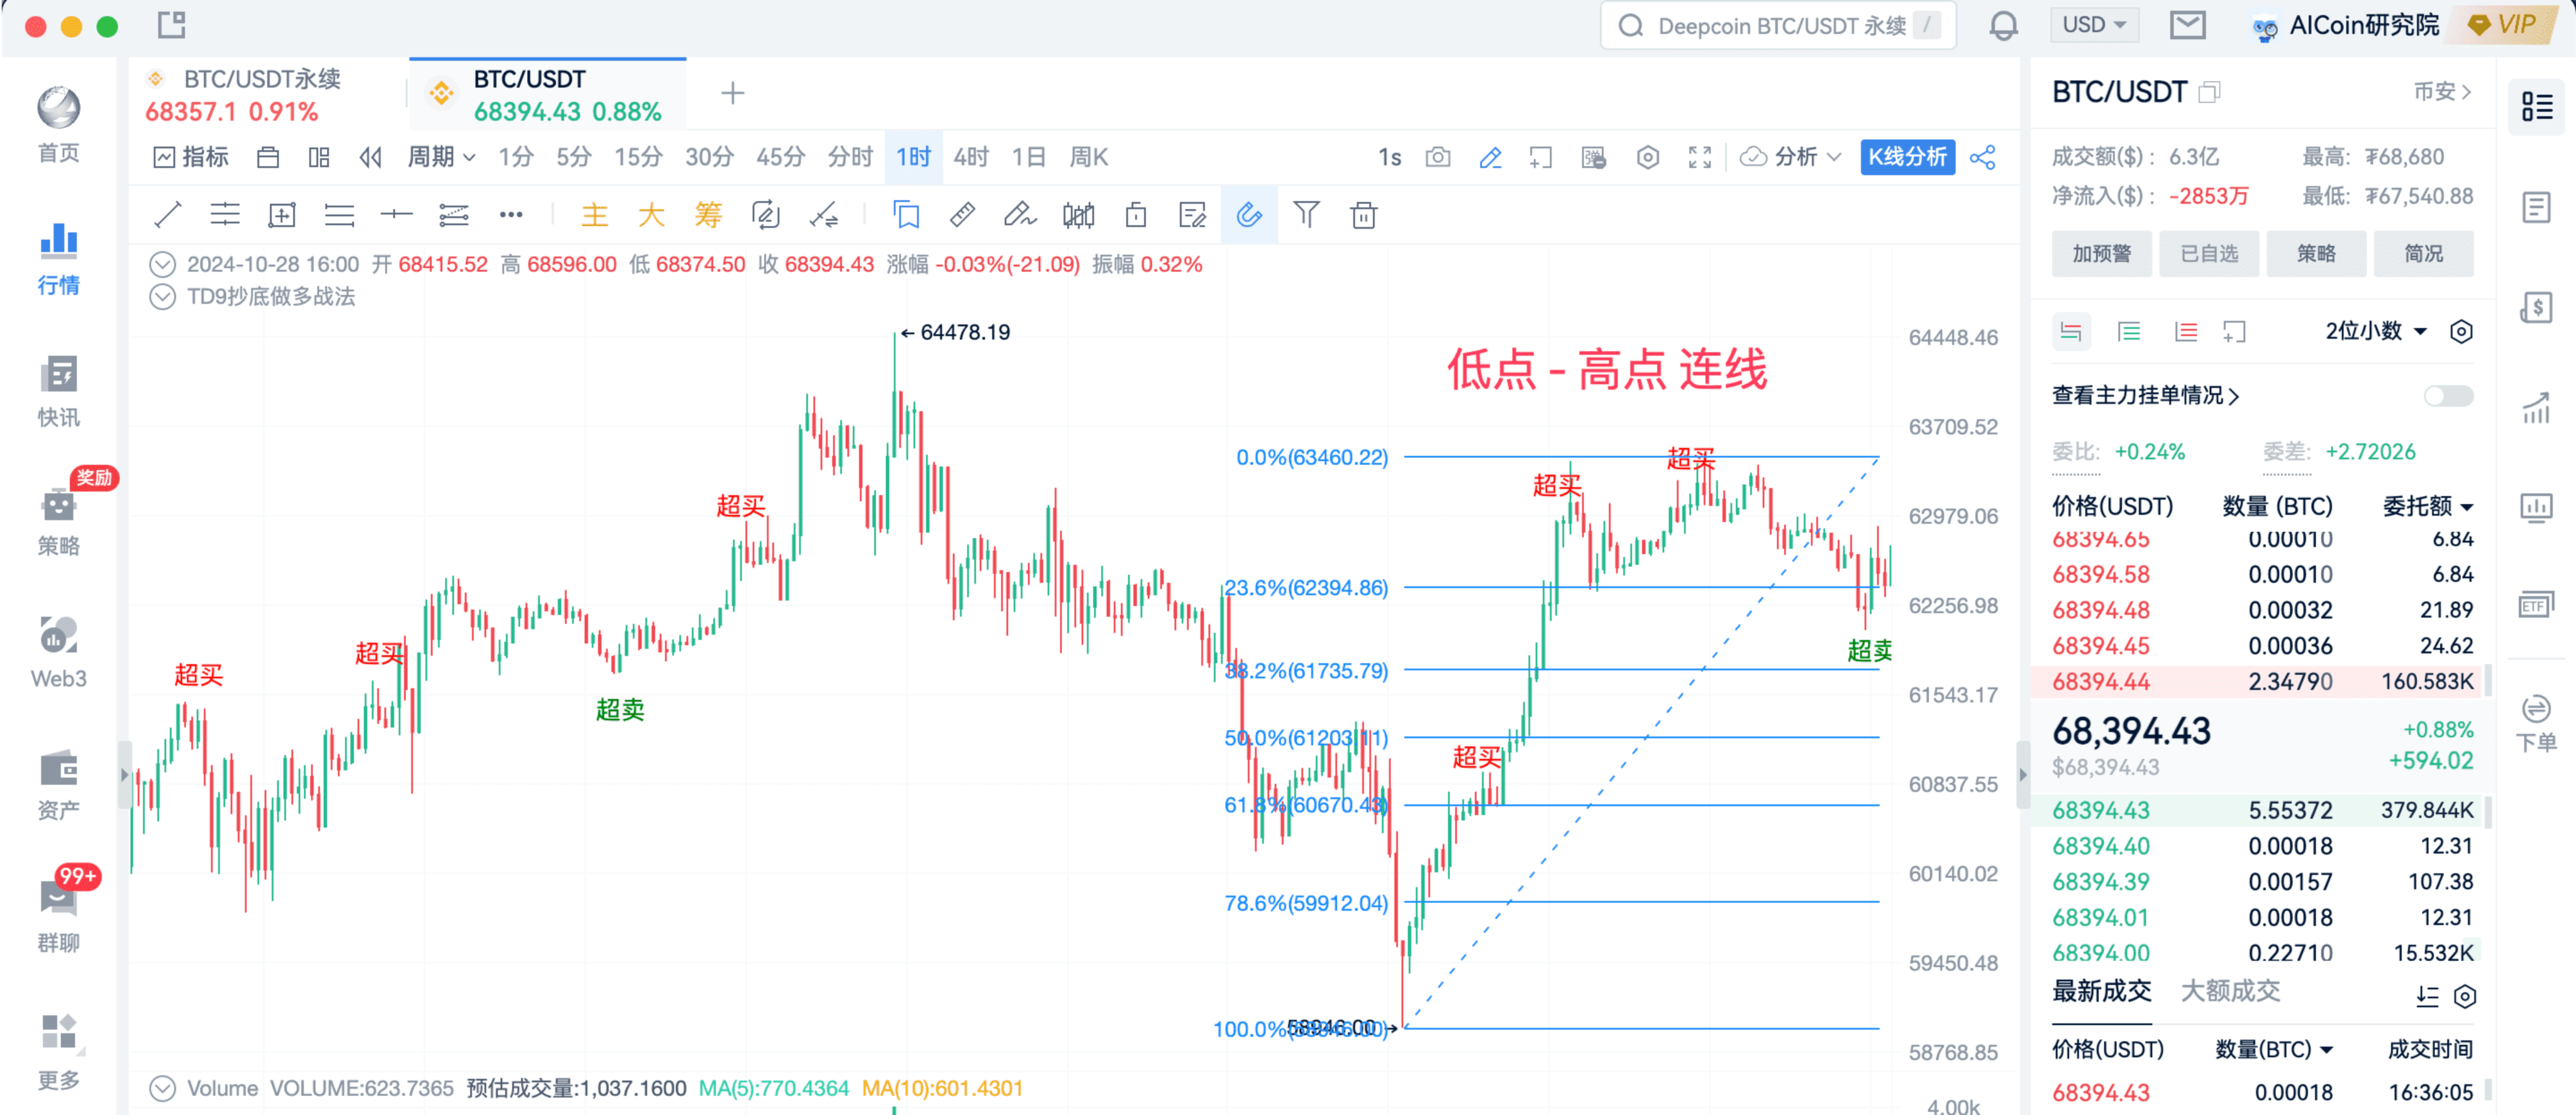
A straight line and a line segment are the same; it's just that the line segment covers a smaller range. The host prefers to use line segments, but you can also use straight lines.
Once everyone has connected the lines, what can you see? You can find the support level.
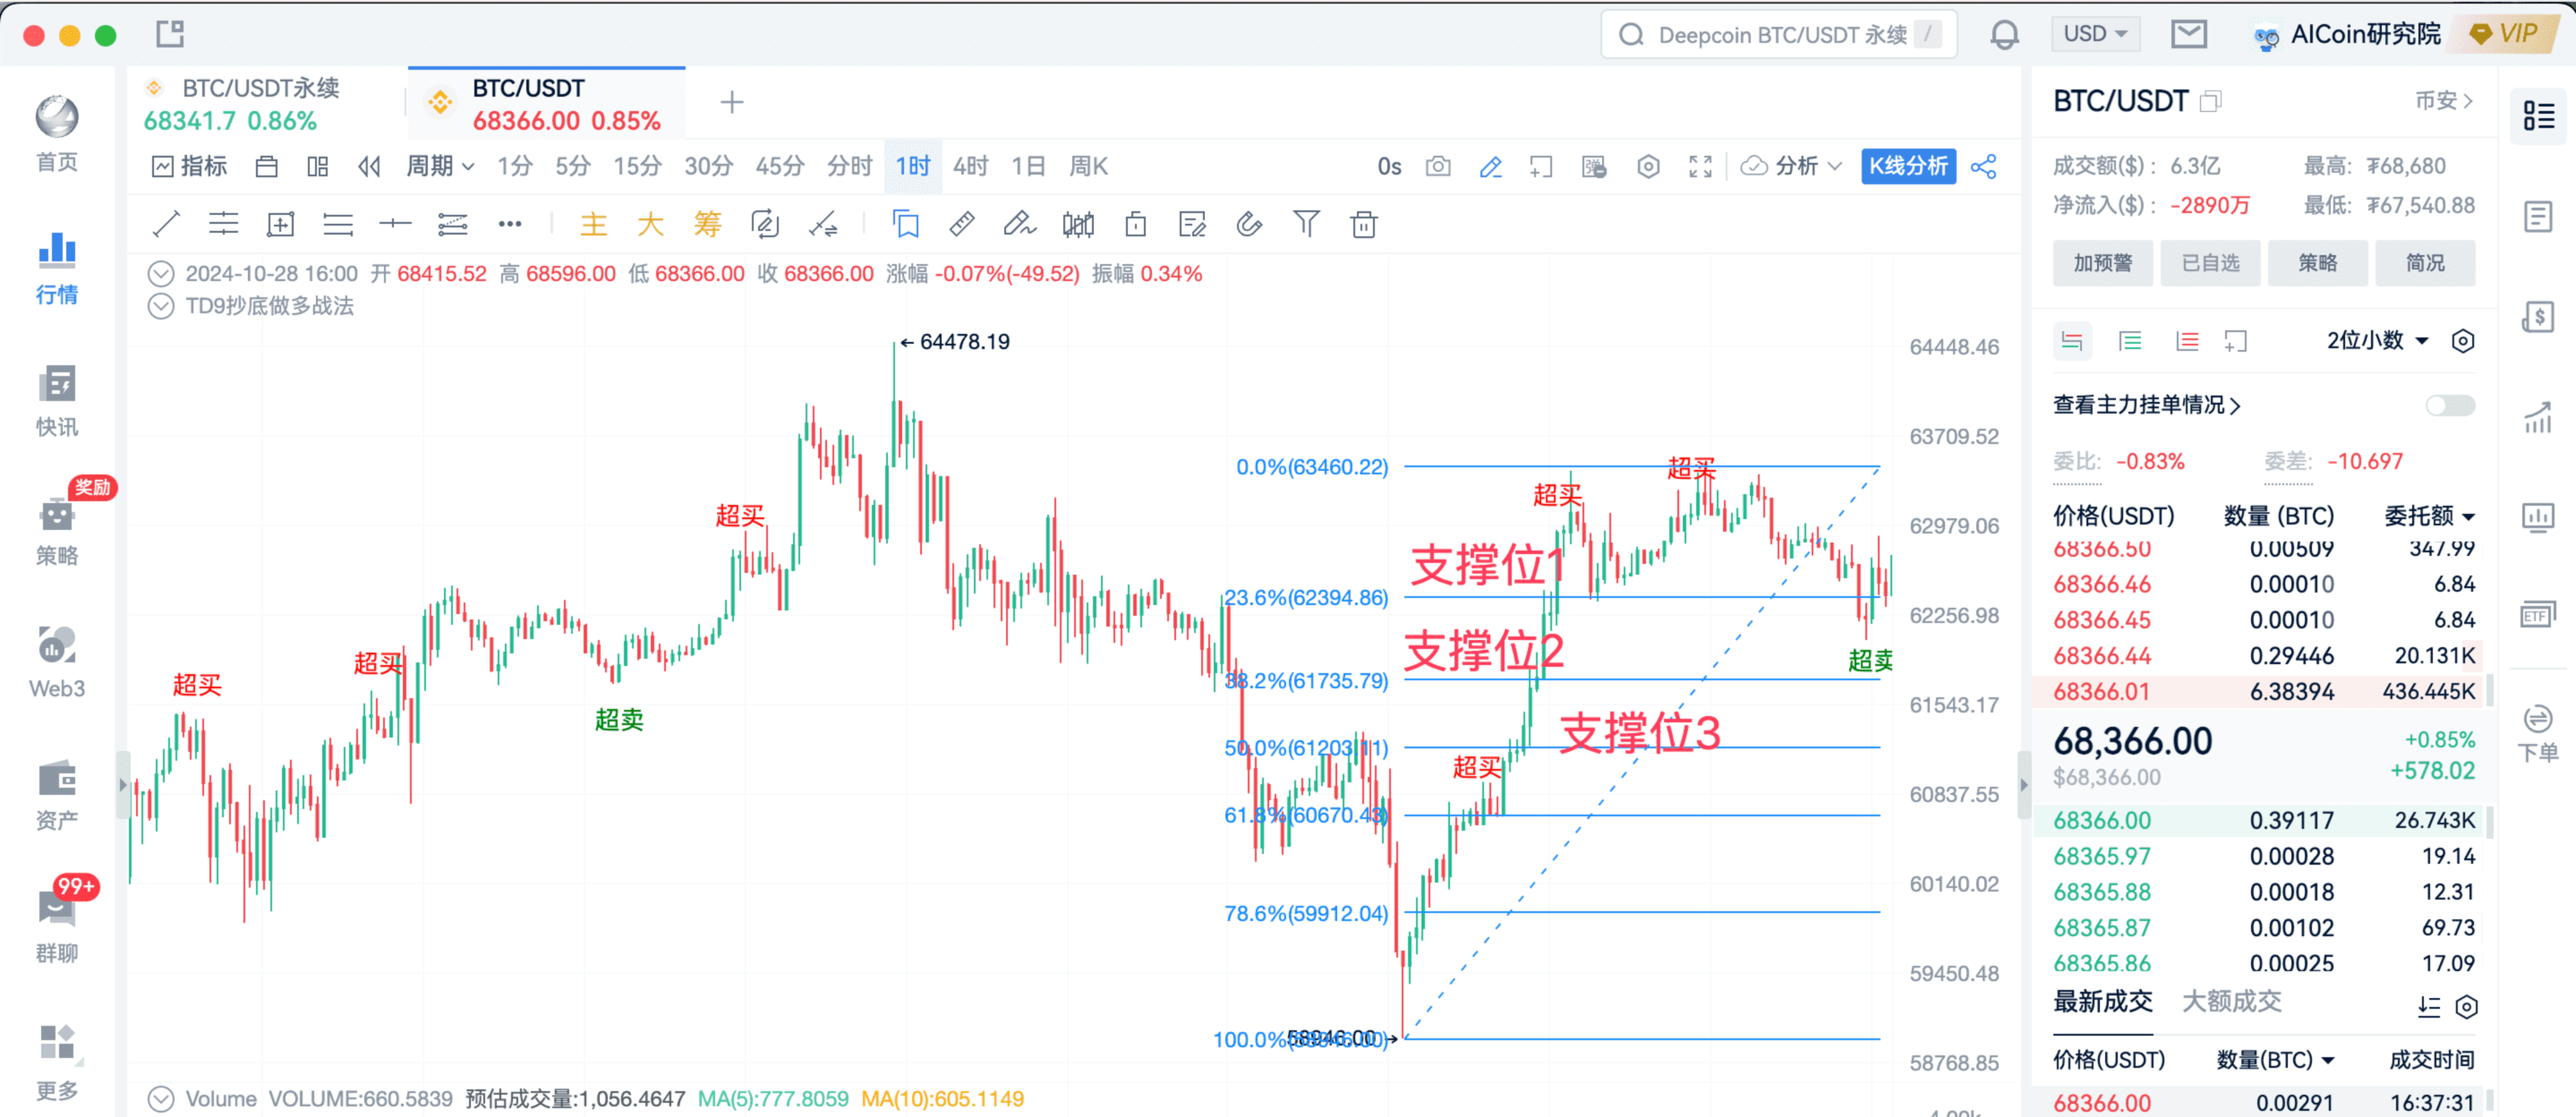
Here, you can see that if a corresponding support level shows a buy signal, then it is a great opportunity for you to confidently catch the bottom.
For example, the signal here appears oversold near 0.236, indicating that it pulled back a little, and the main force couldn't help but push it up. Therefore, this signal is a very good confirmation signal.
We can see that if you enter here, the subsequent trend is upward, and then another oversold signal appears.
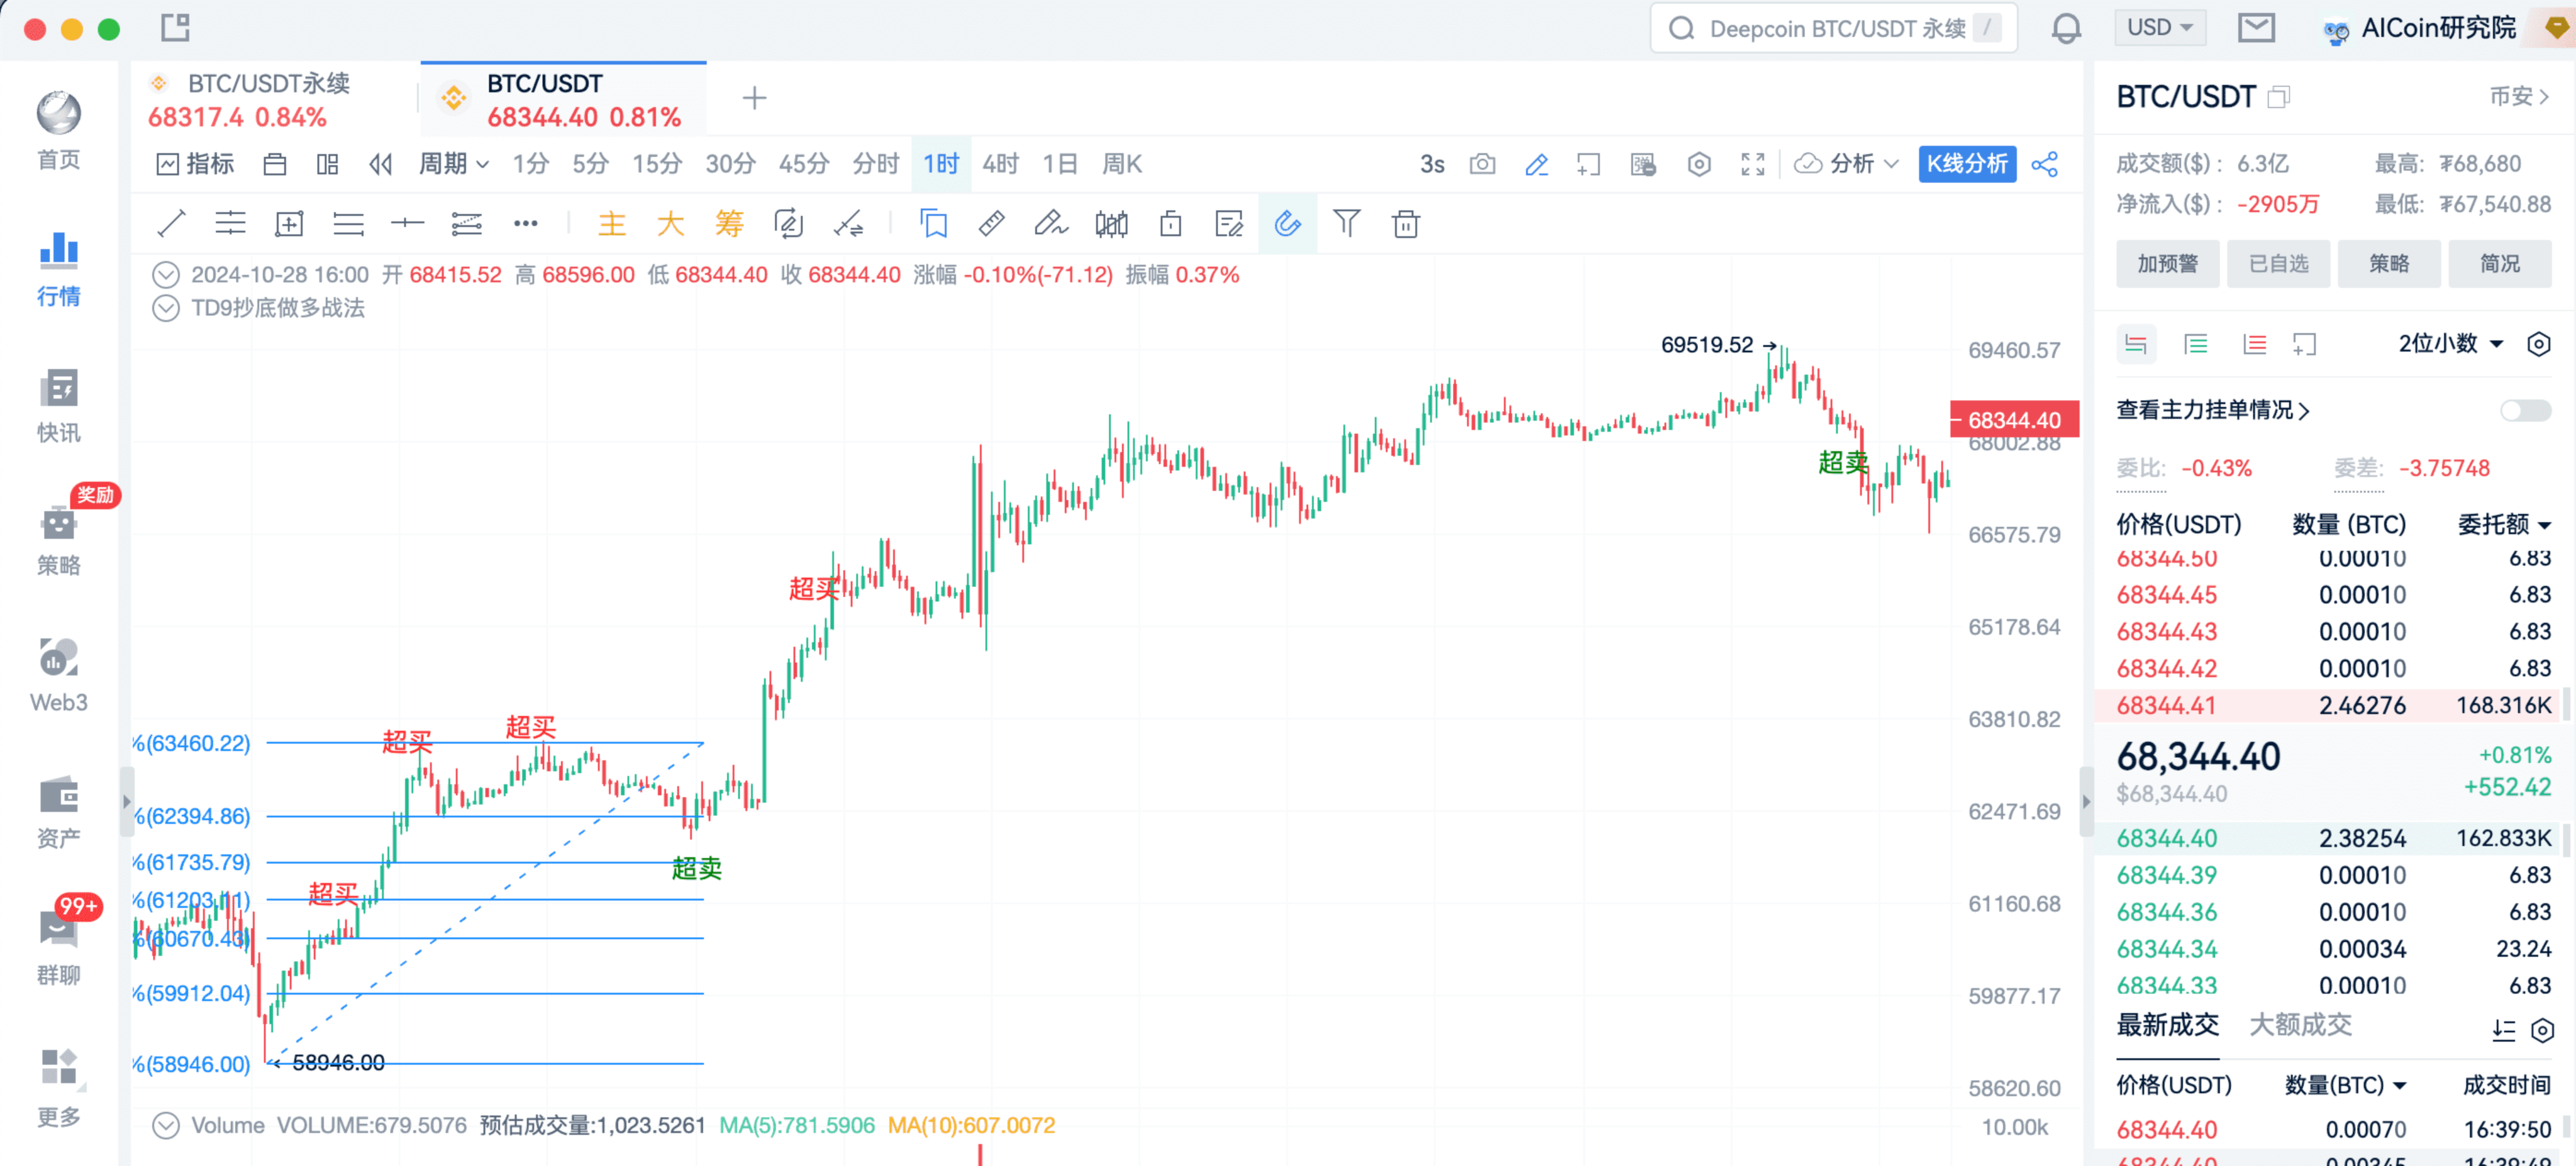
: How should we measure this signal?
: Similarly, we use the simplest method to find the most recent low and high points before this signal, establishing a segment of the market. We connect these two low and high points.
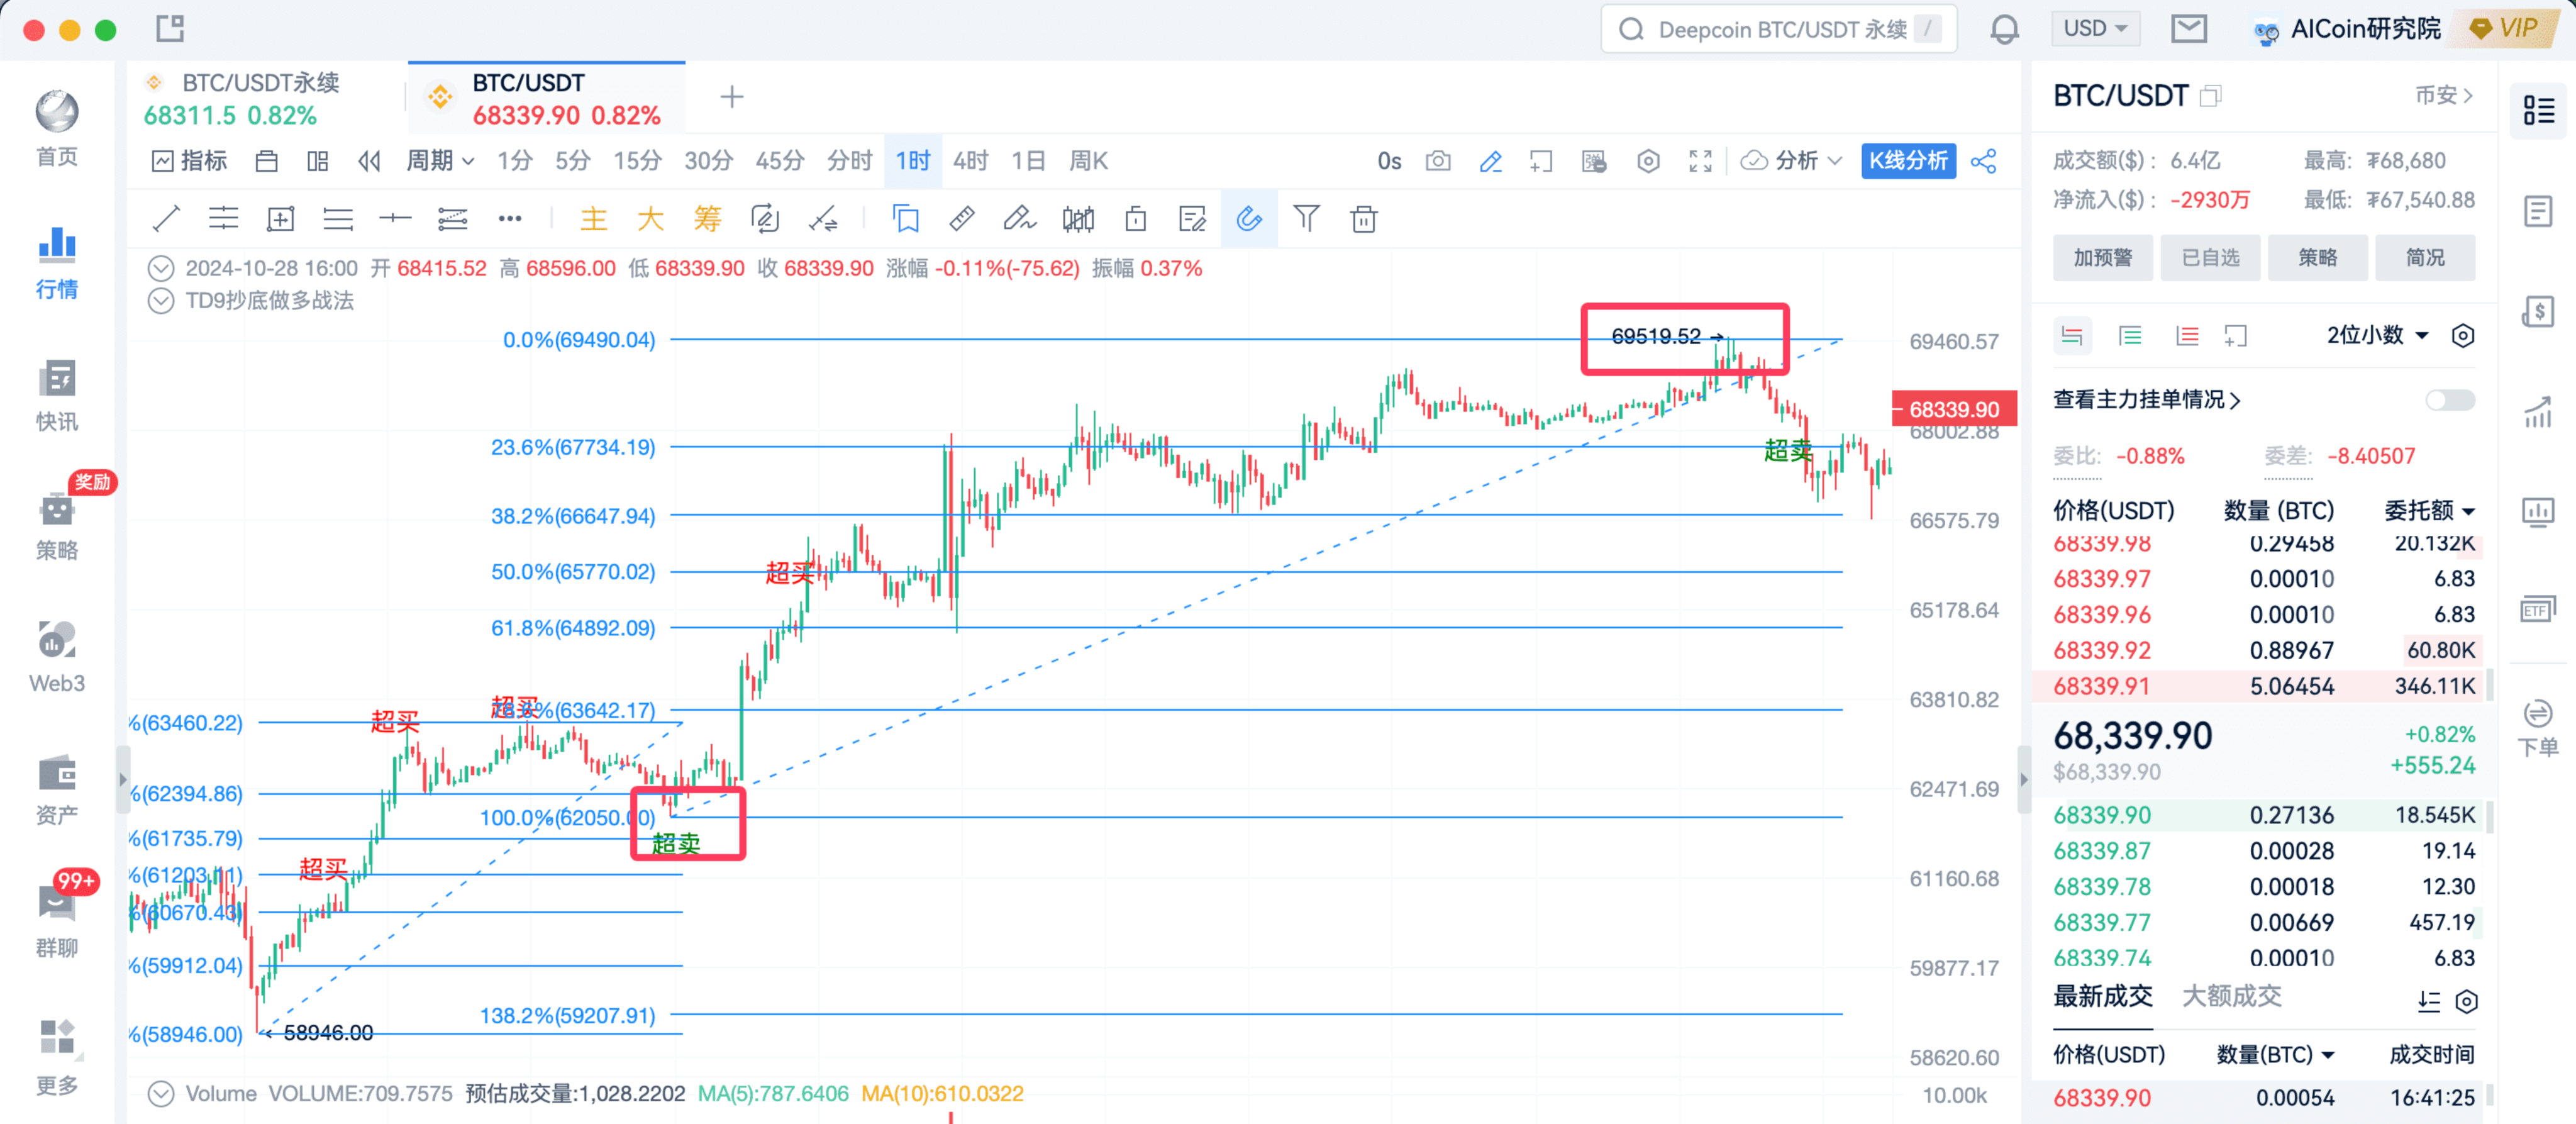
You can see that this oversold signal occurs again near 0.236, which is also a very good entry signal, but ultimately it continues to pull back to the 0.5 support level.
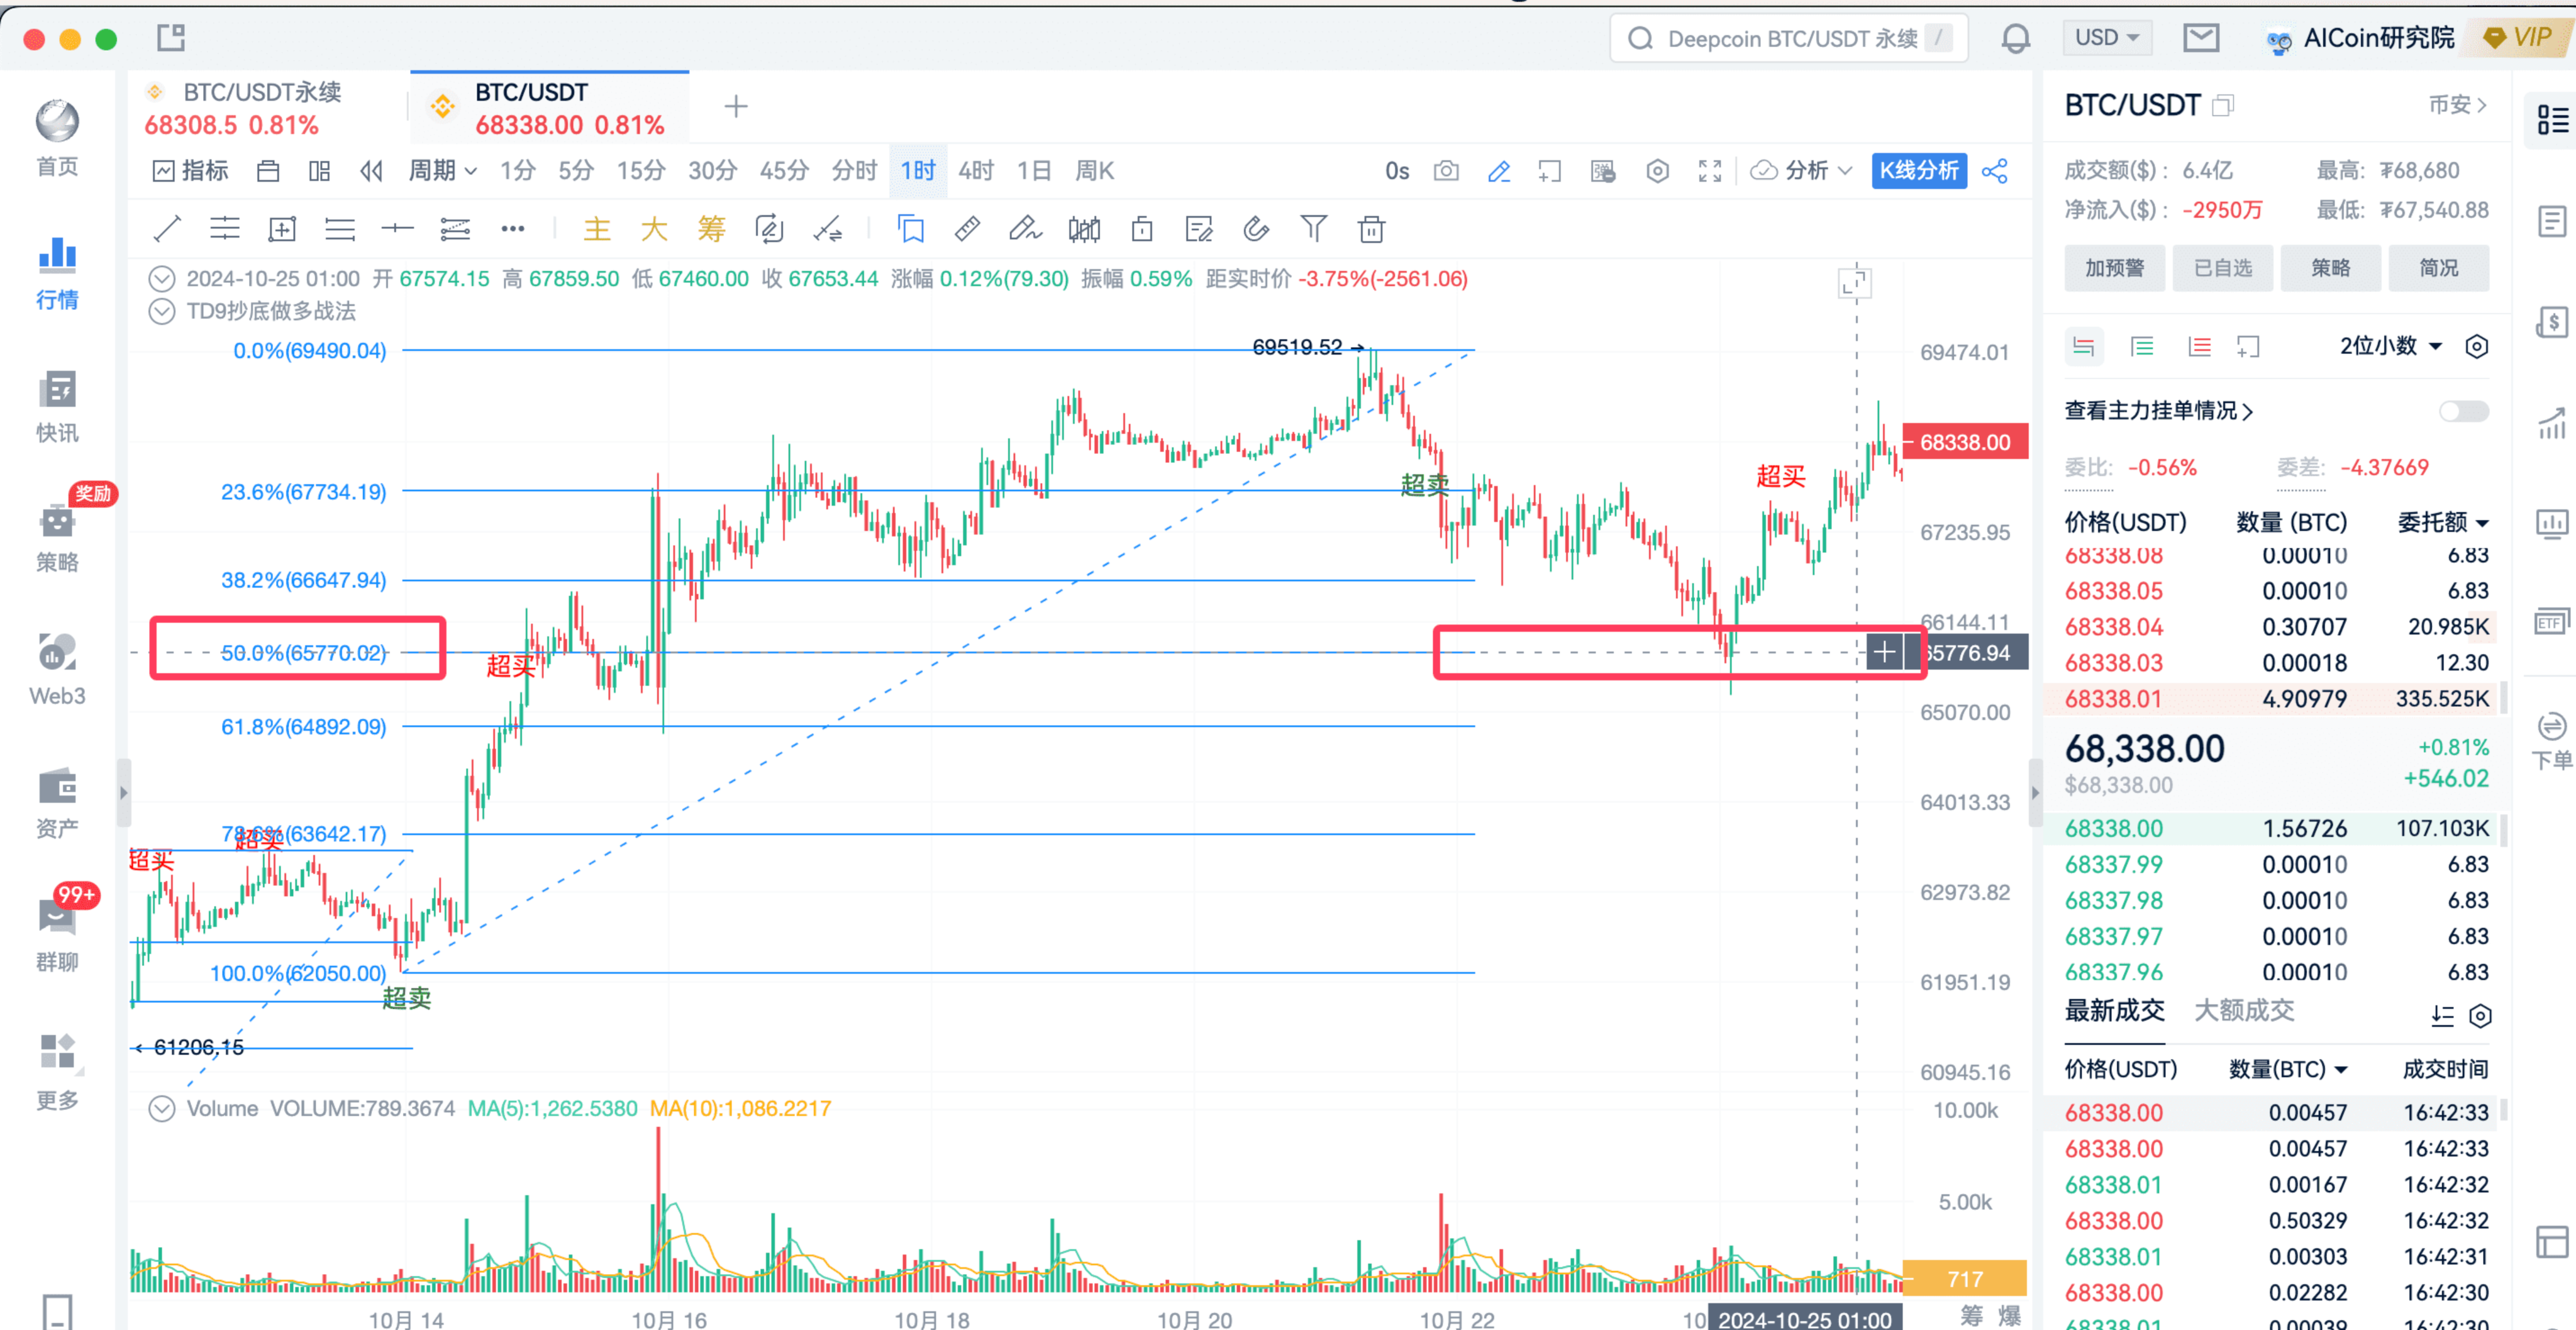
We see that another oversold signal appears here. Should we take this signal?
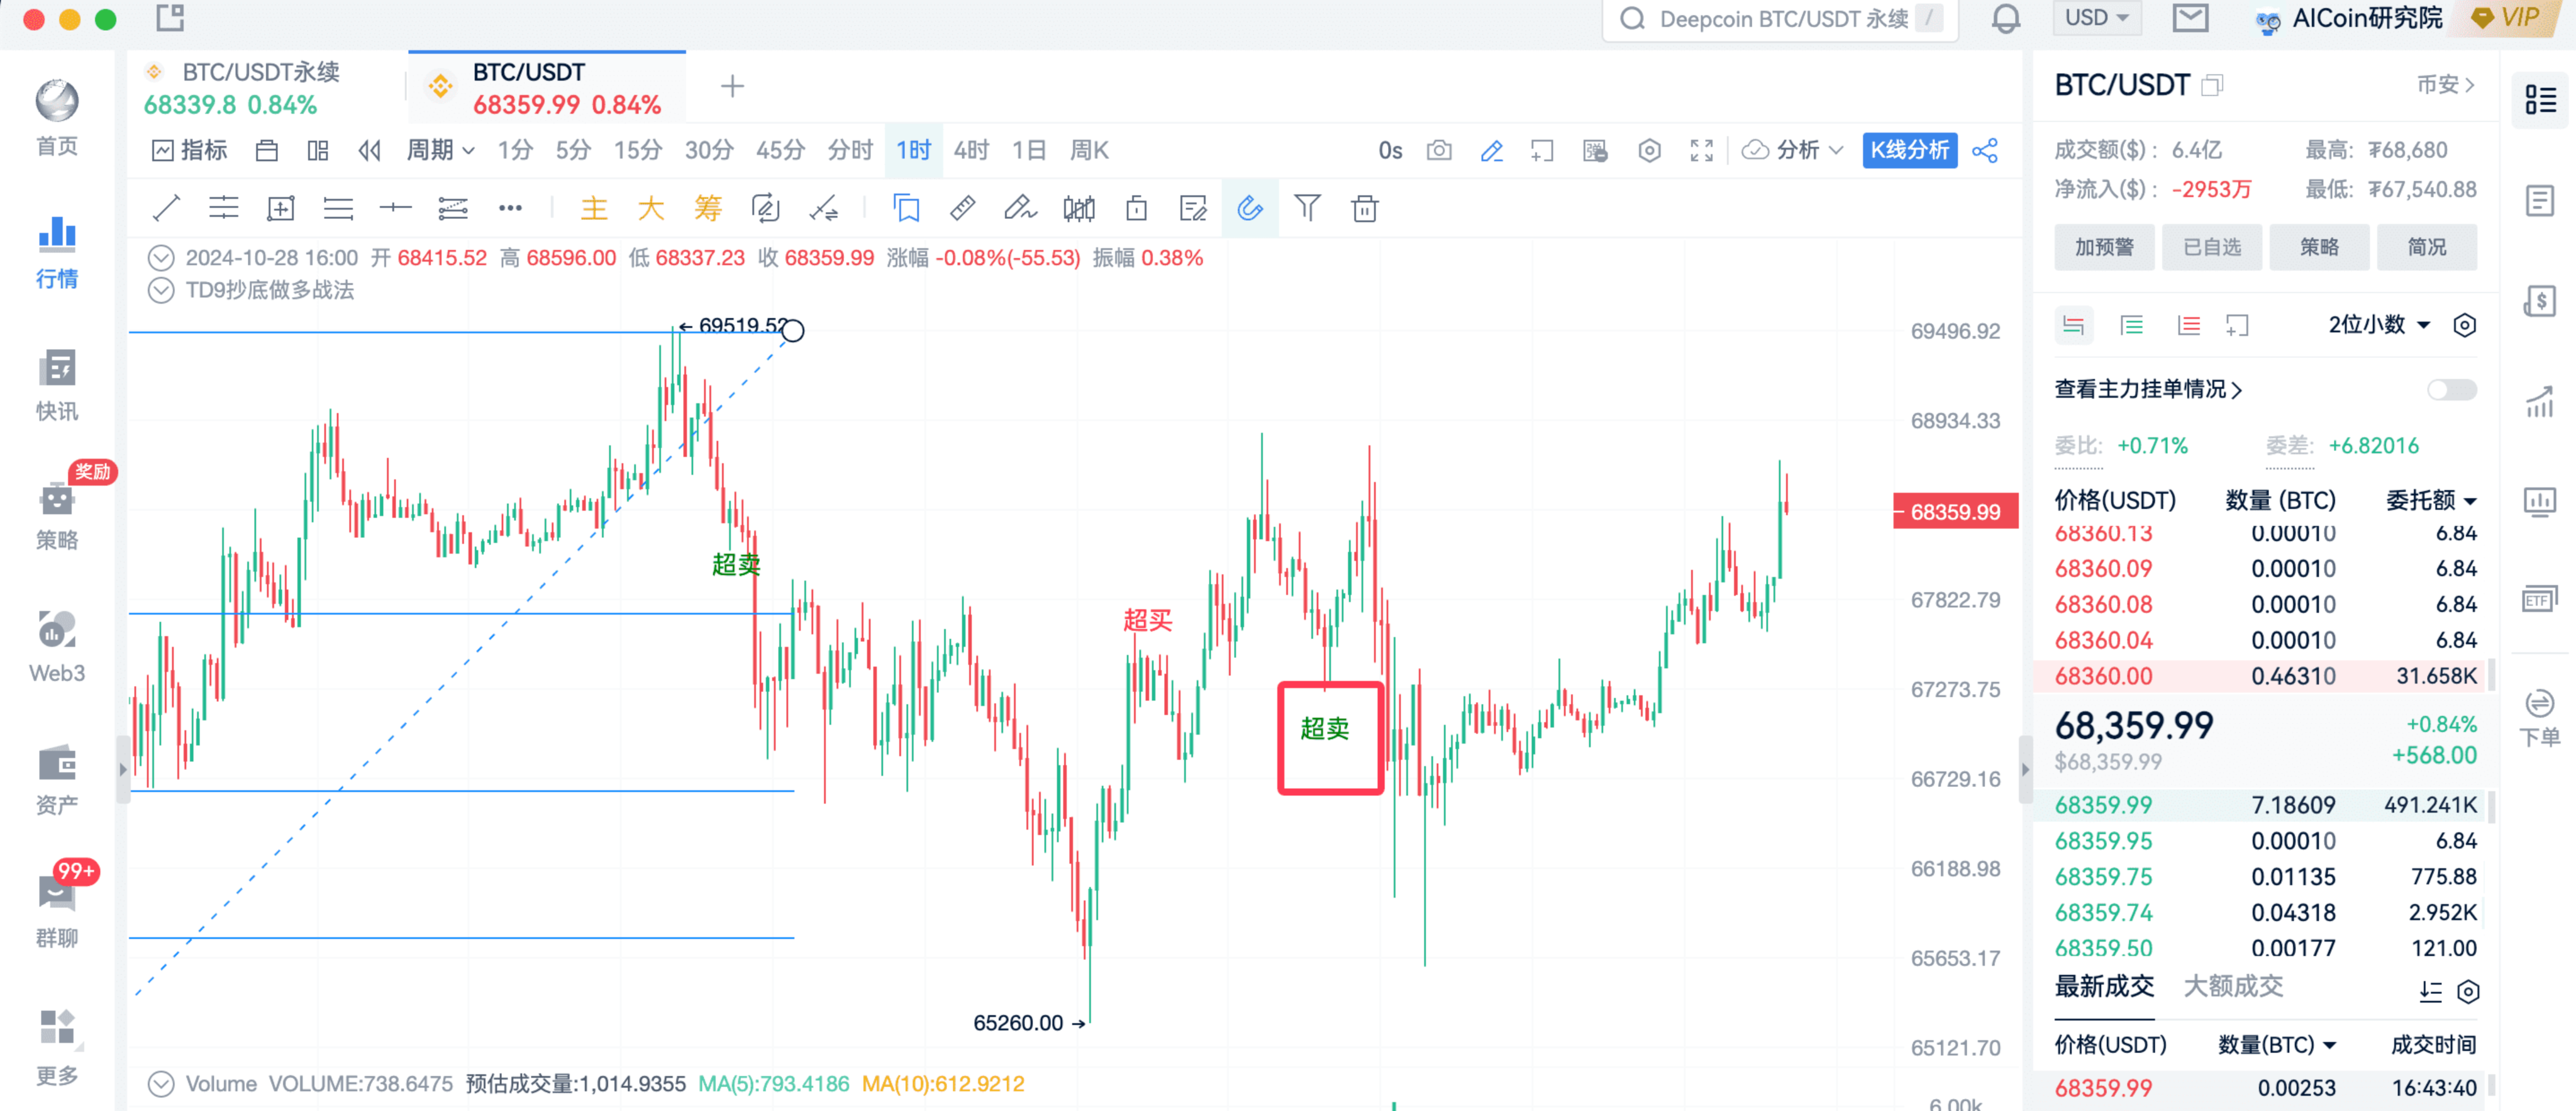
Again, we can use Fibonacci.
We continue with the previous theory; just find the high and low points of the segment before this signal, these two positions.
Connecting the lines reveals that the signal appears near 0.382.
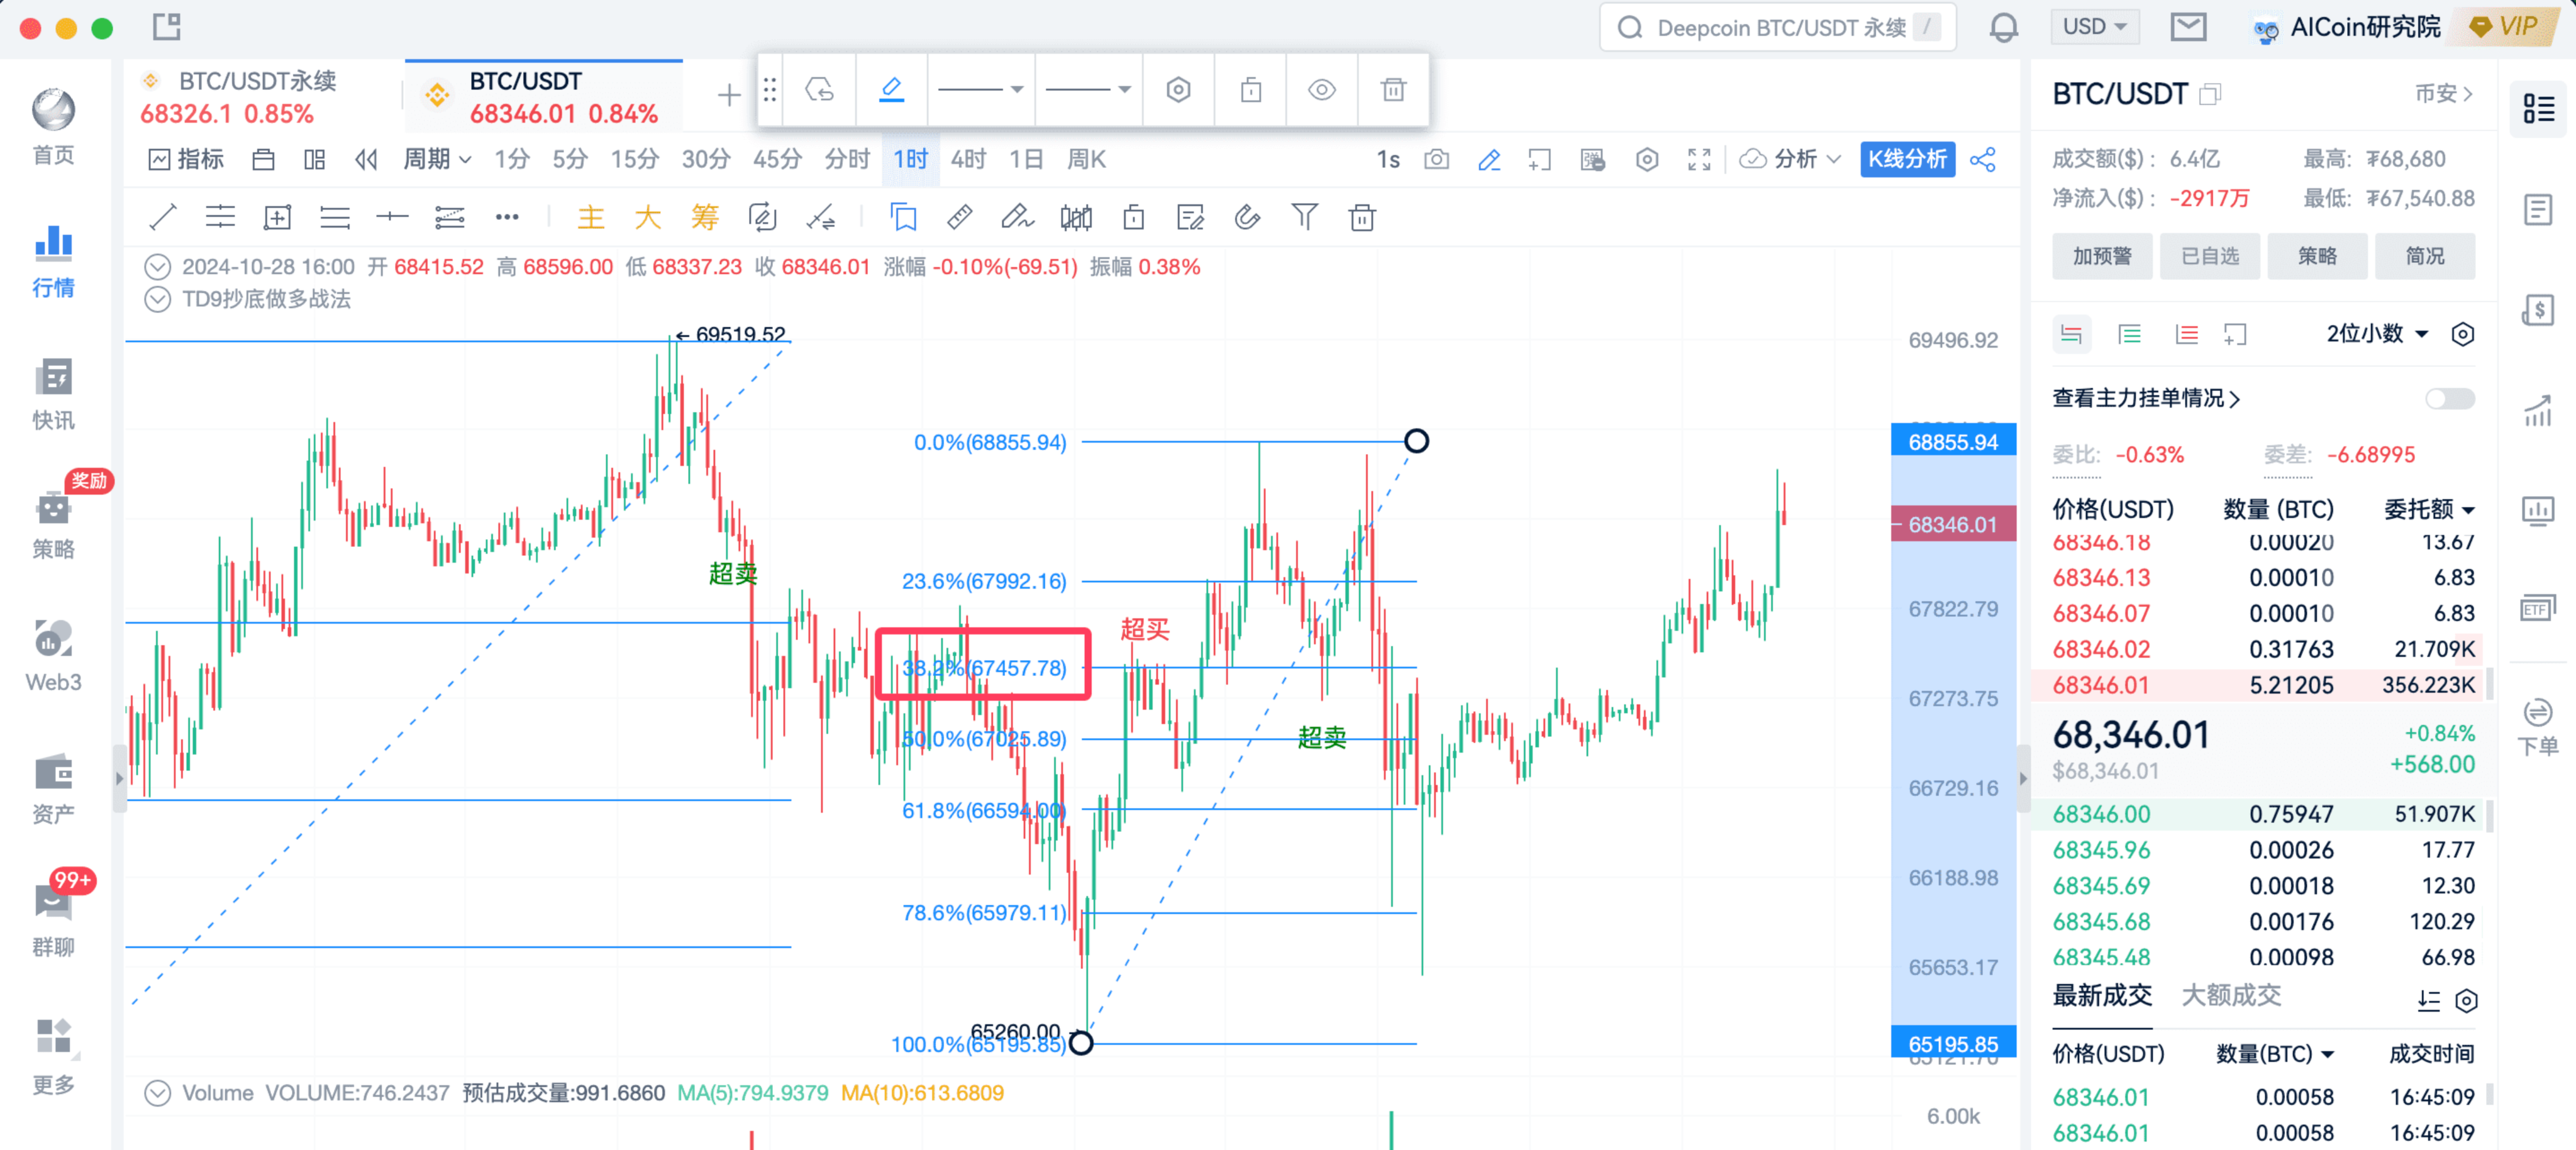
This signal is also very worth entering, and ultimately it rebounds after pulling back to 0.618.
Host's suggestions:
● If the signal occurs at Fibonacci retracement levels: 0.236, 0.382, 0.5, 0.618, these positions are all very worth entering.
● If it exceeds 0.618, it is recommended to wait for the next opportunity.
The indicators we discussed, whether on the 1-hour, 15-minute, or 4-hour timeframe, all have segments of support and resistance.
Now let's take a look at the market on the 15-minute timeframe.
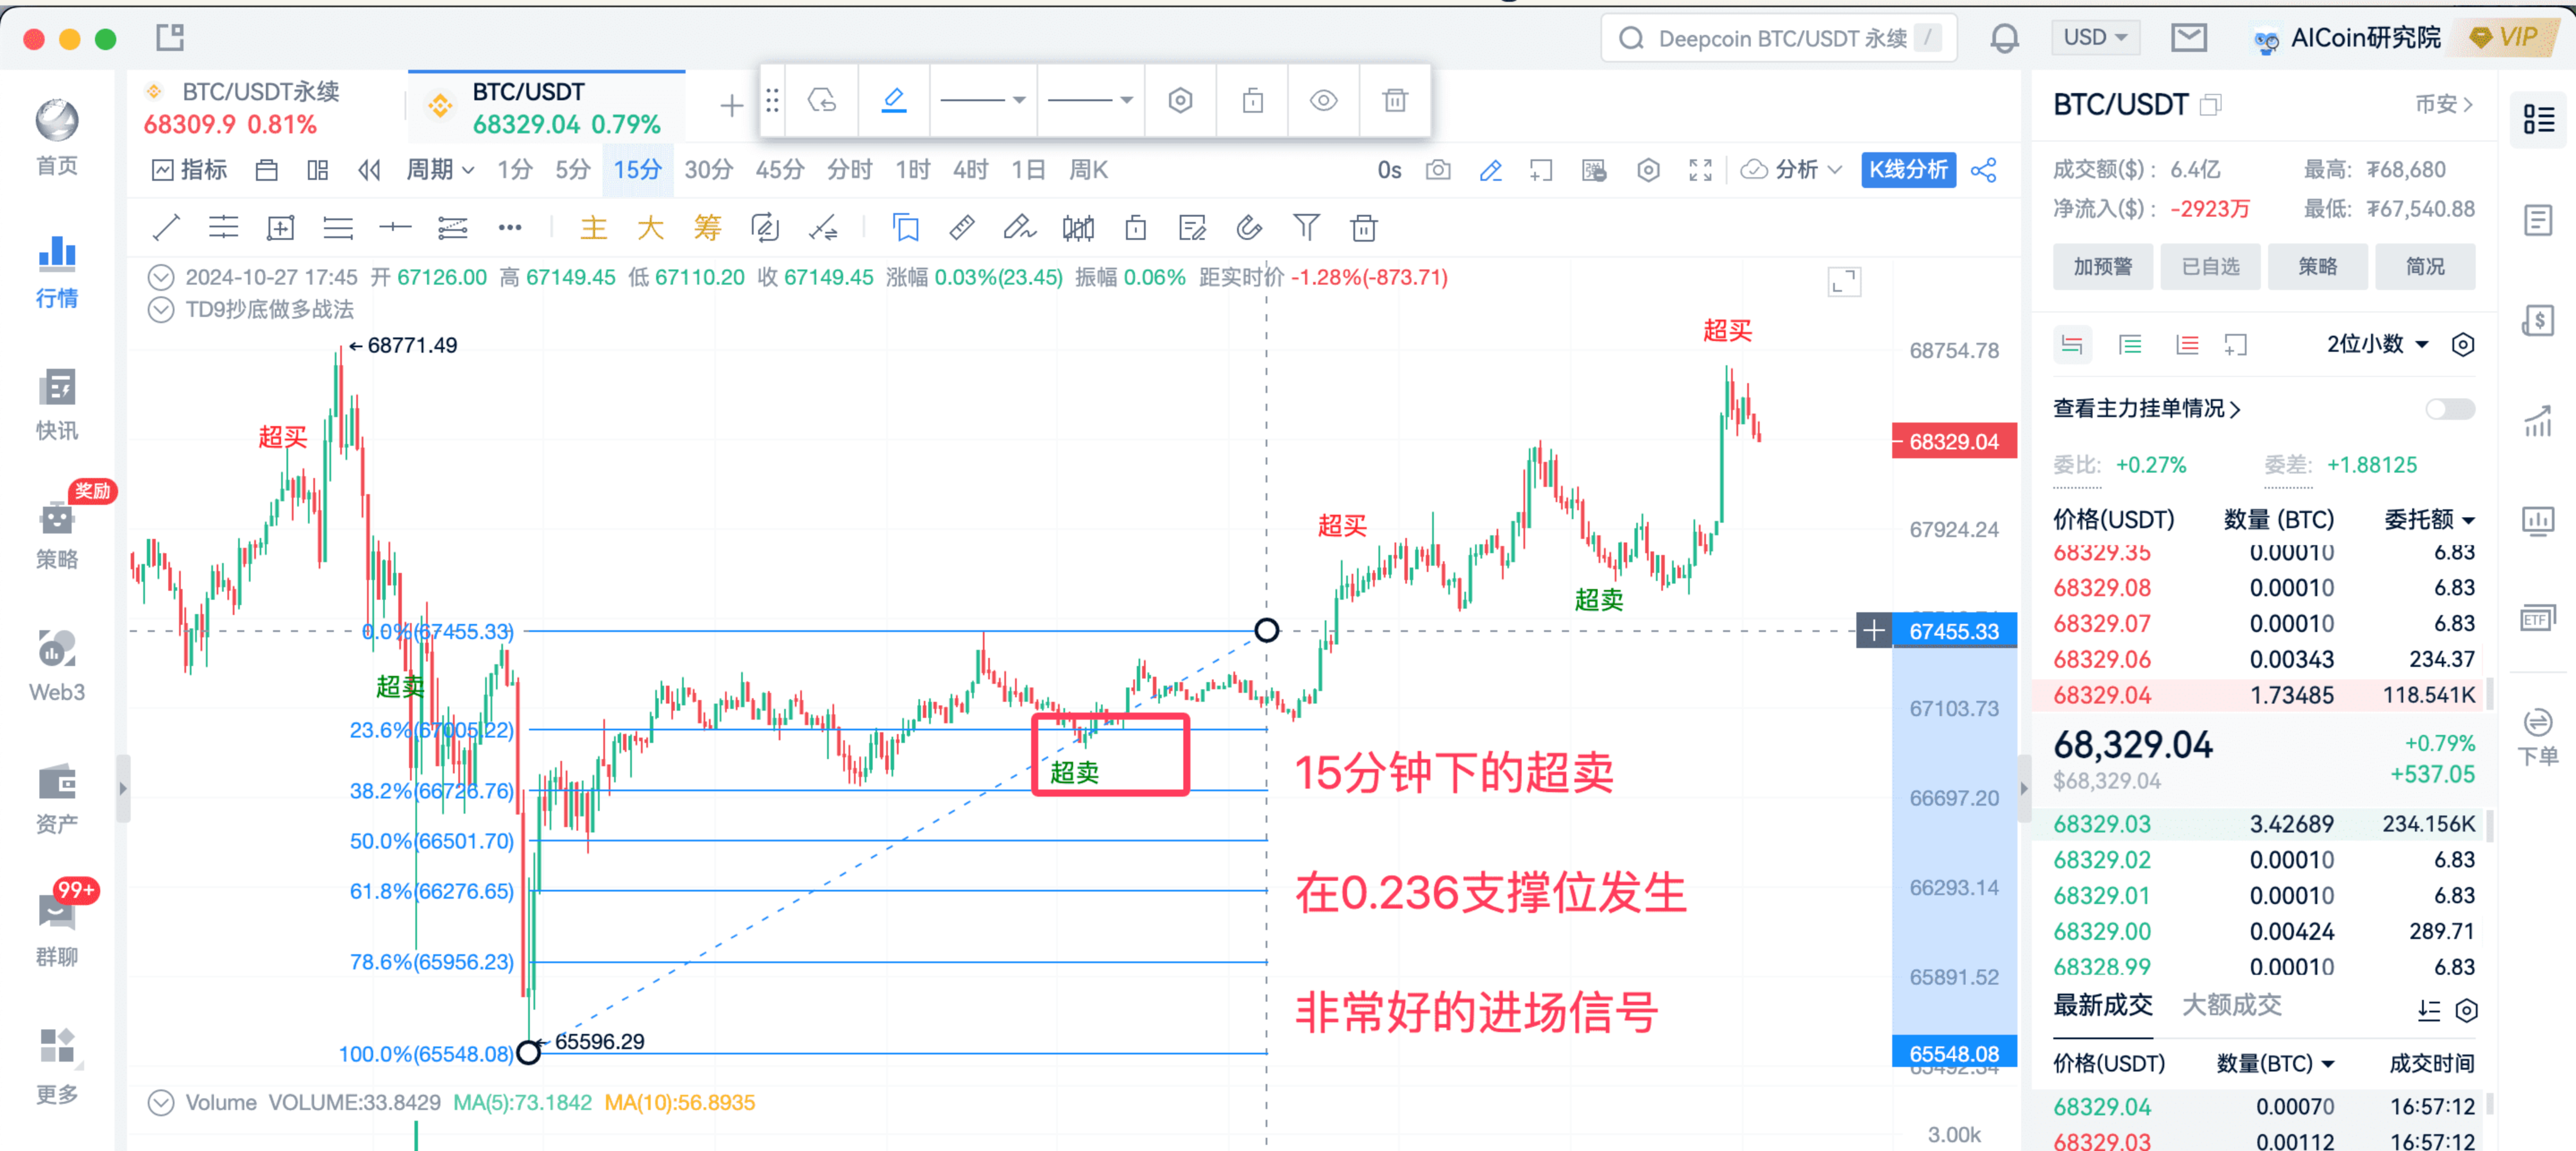
This is also a very good signal.
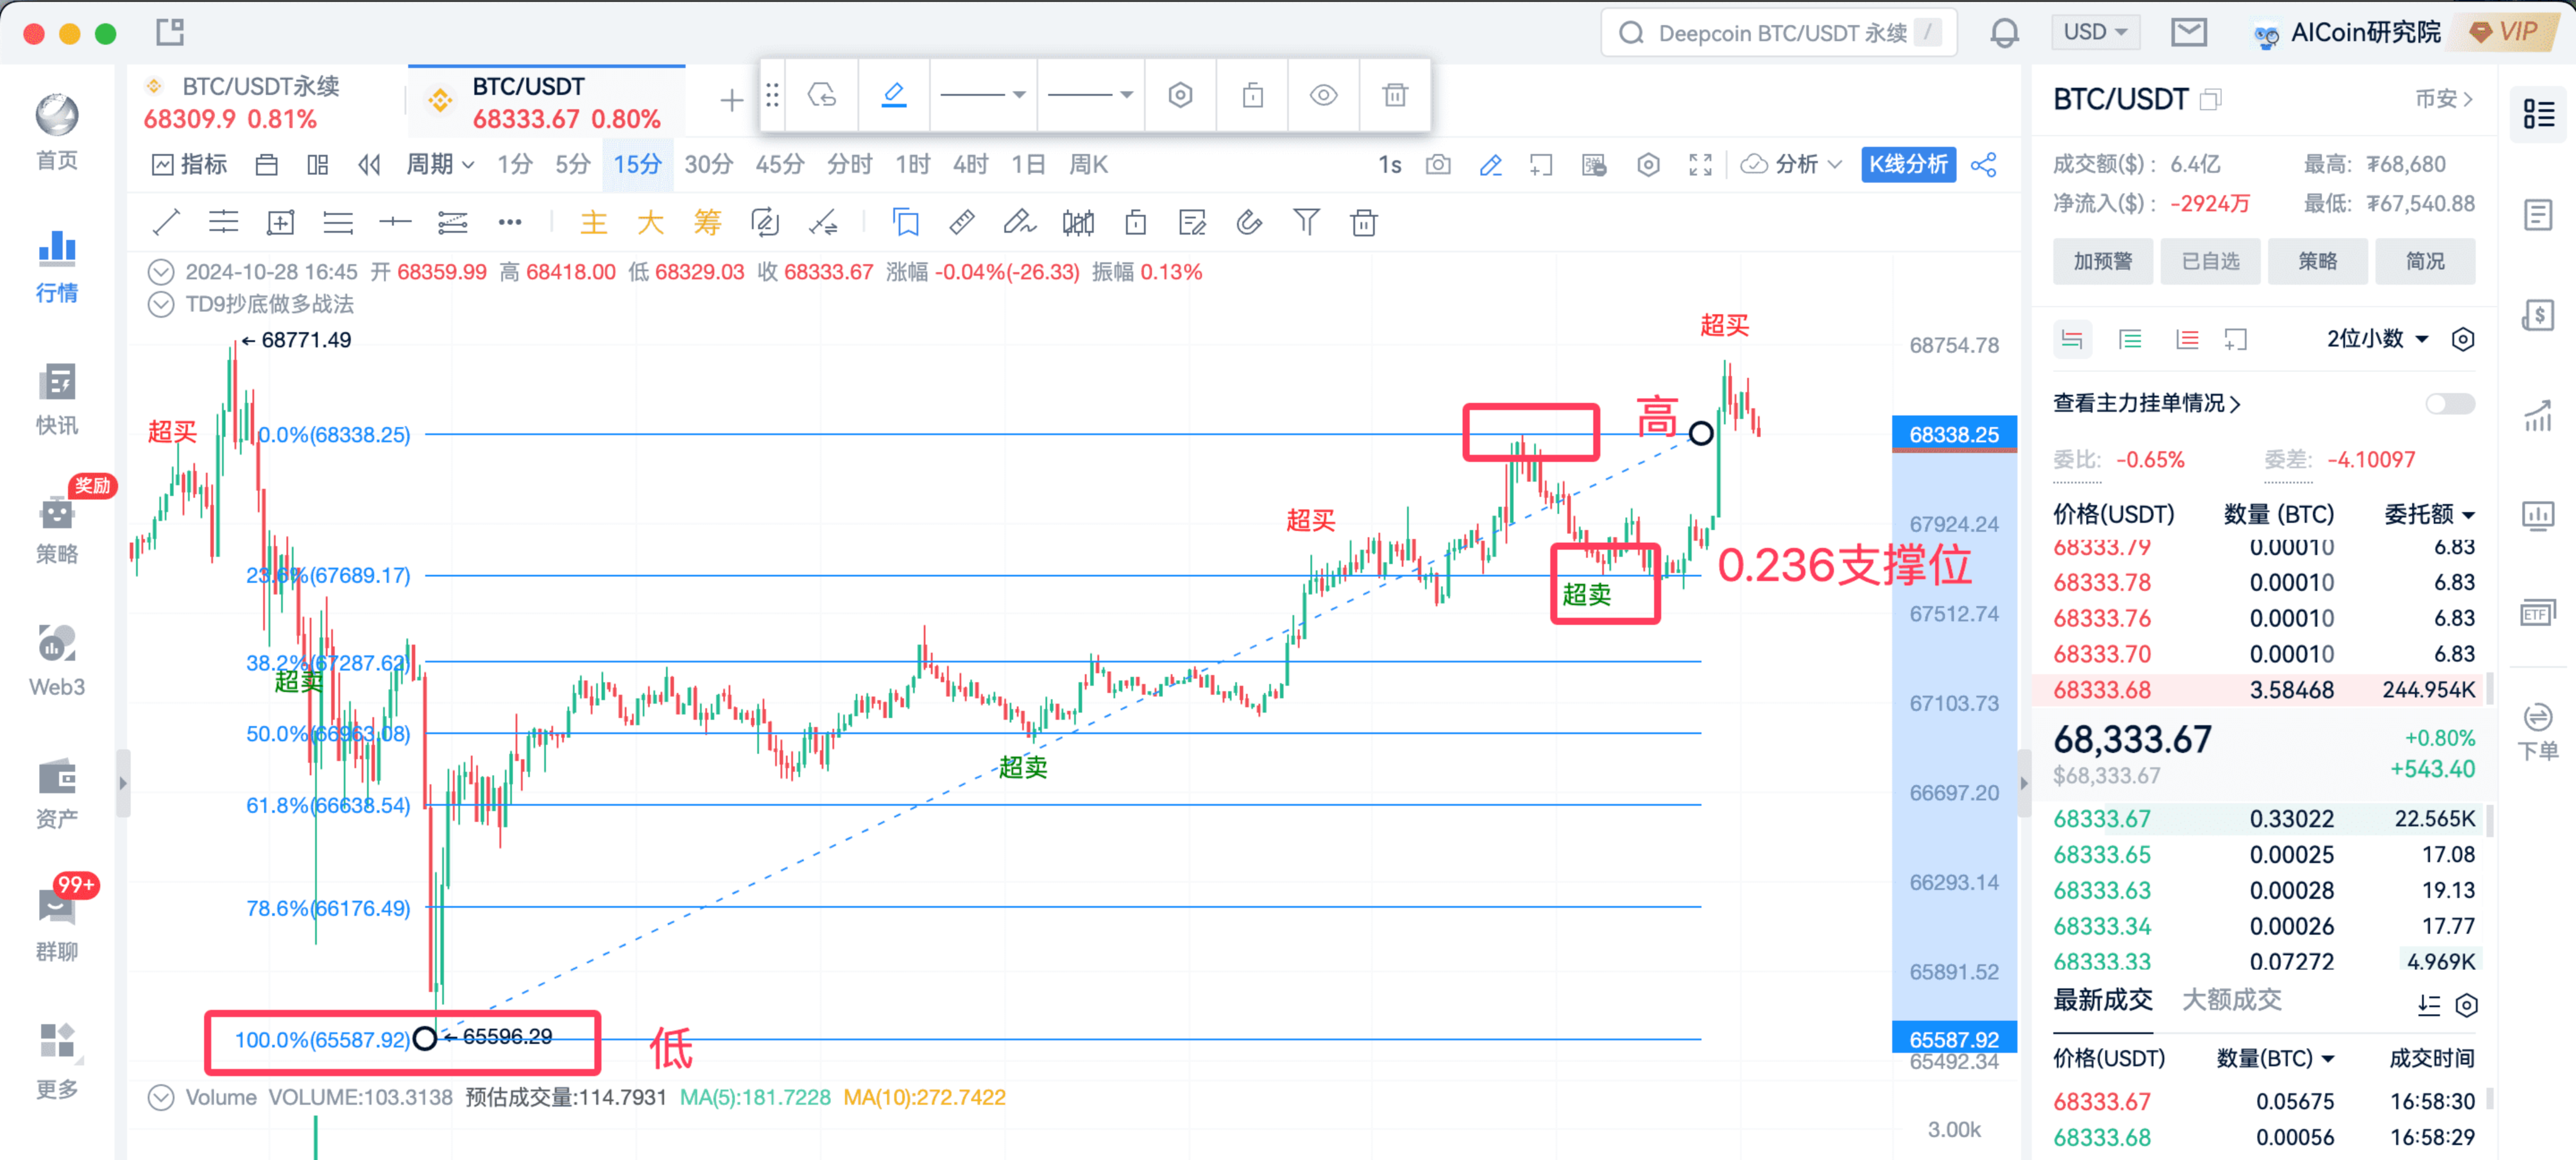
We can also look at the 4-hour timeframe.
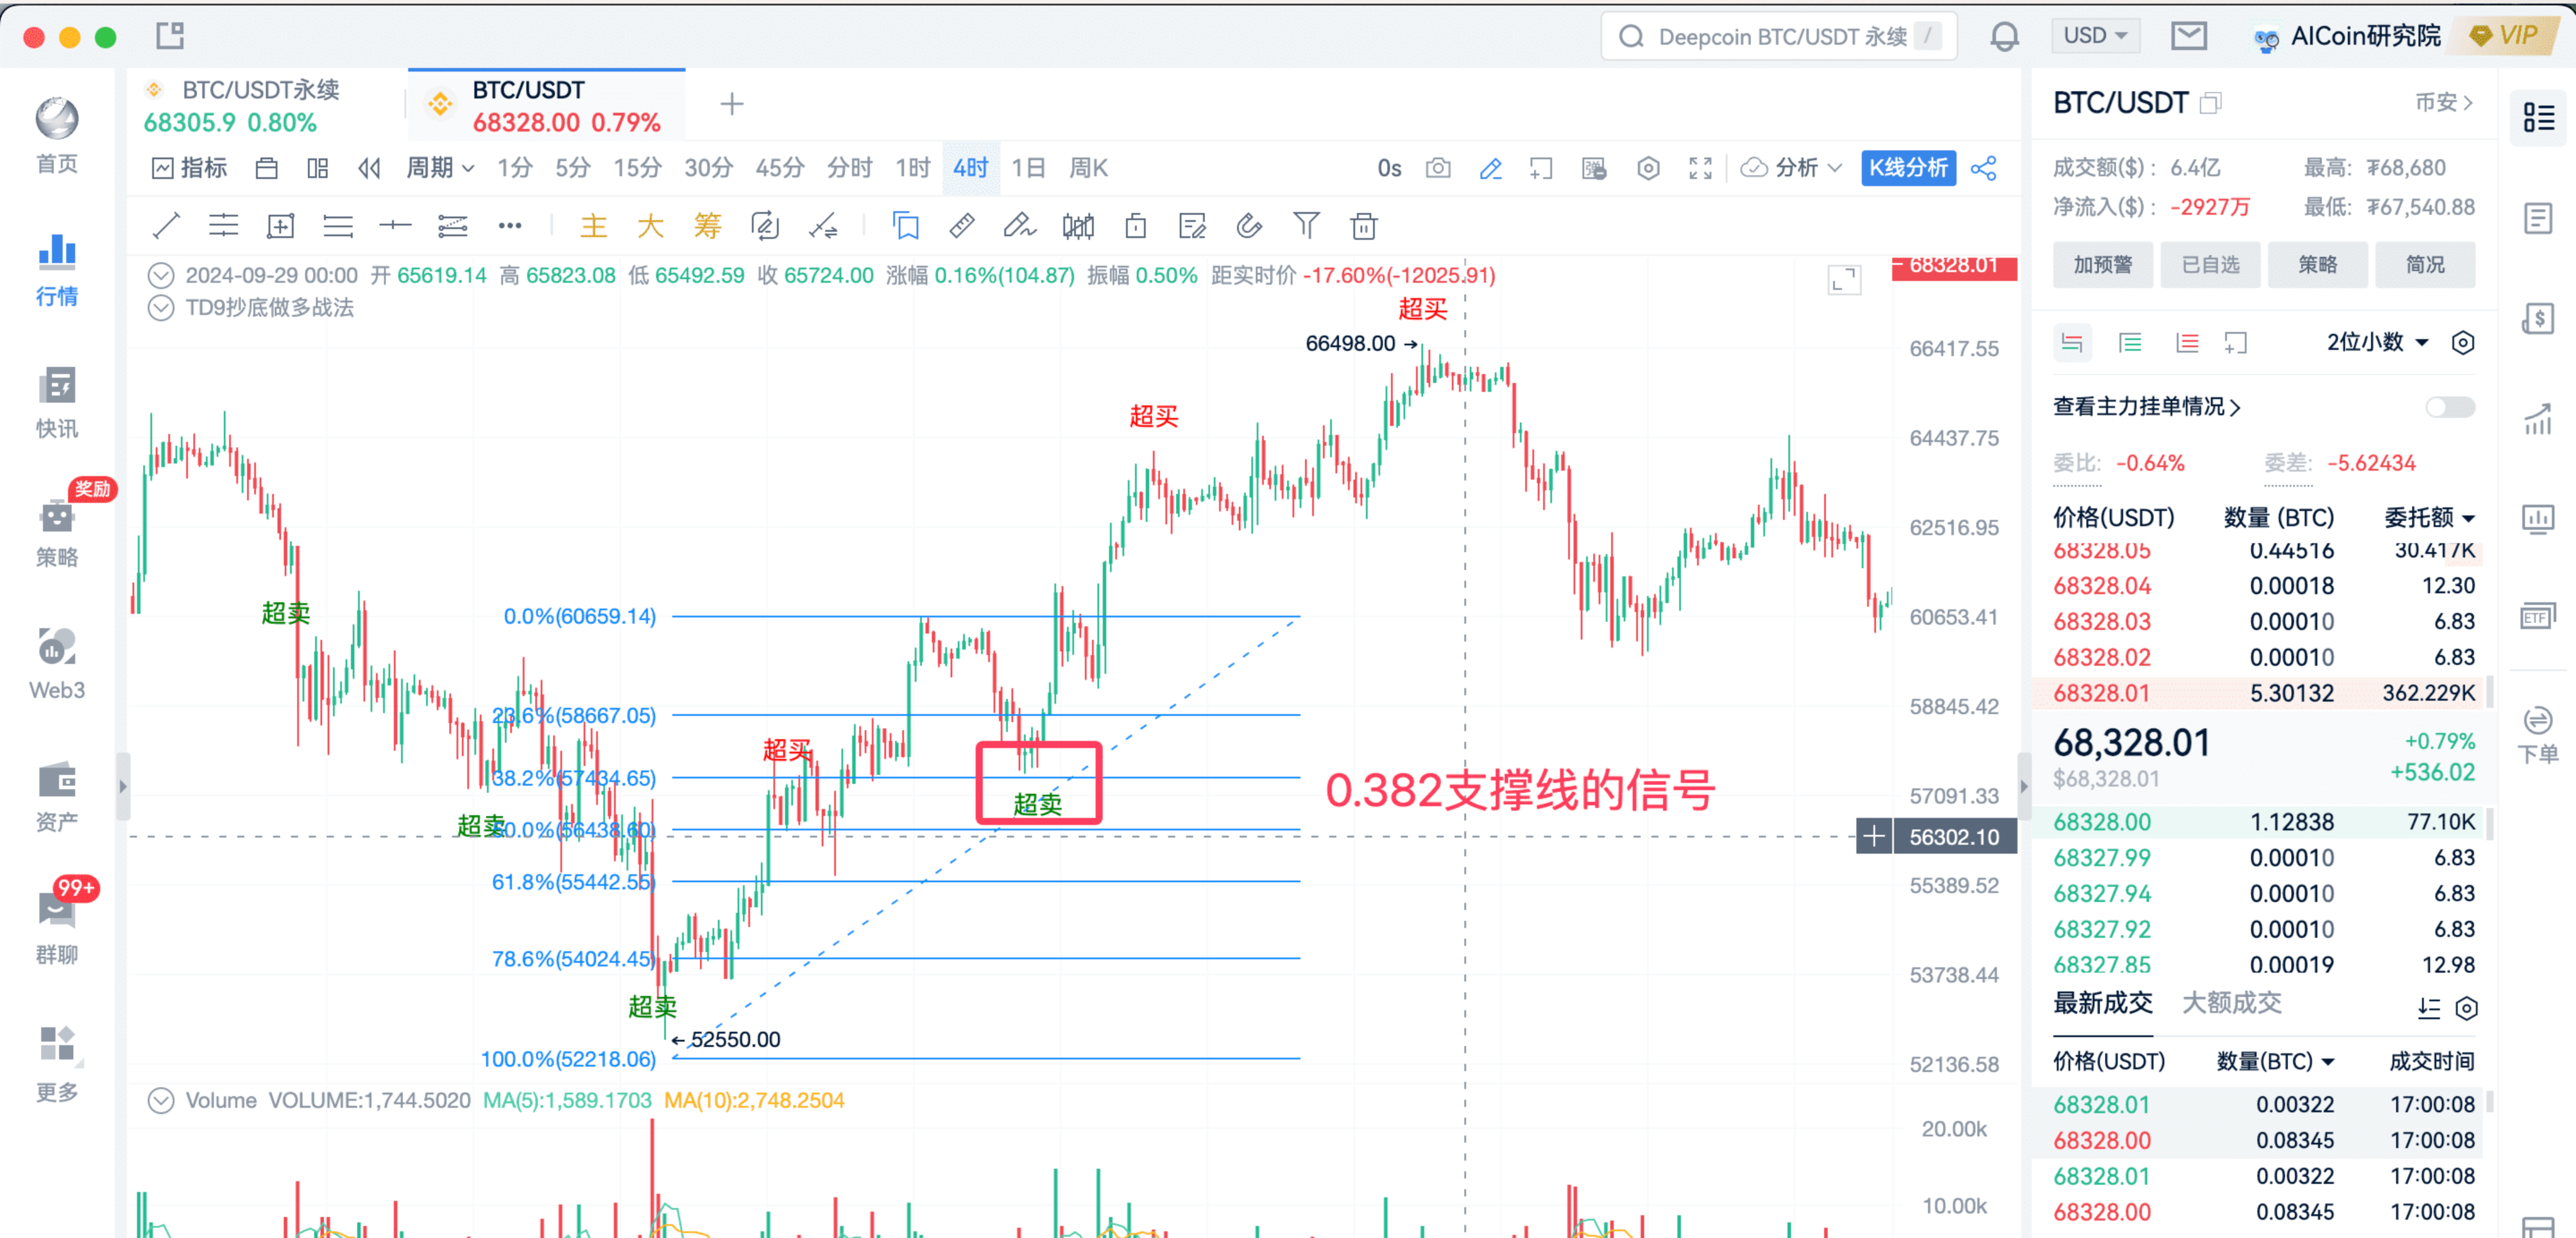
In fact, they are all quite good.
If the students in the live room already have their own trading systems, I suggest using Fibonacci more to differentiate and combine it. Fibonacci is also very easy to use.
Connect the low and high points of the signal segment. If a signal occurs at a support level, the entry signal is very worth paying attention to. The daily signals are also quite good, all near support levels.
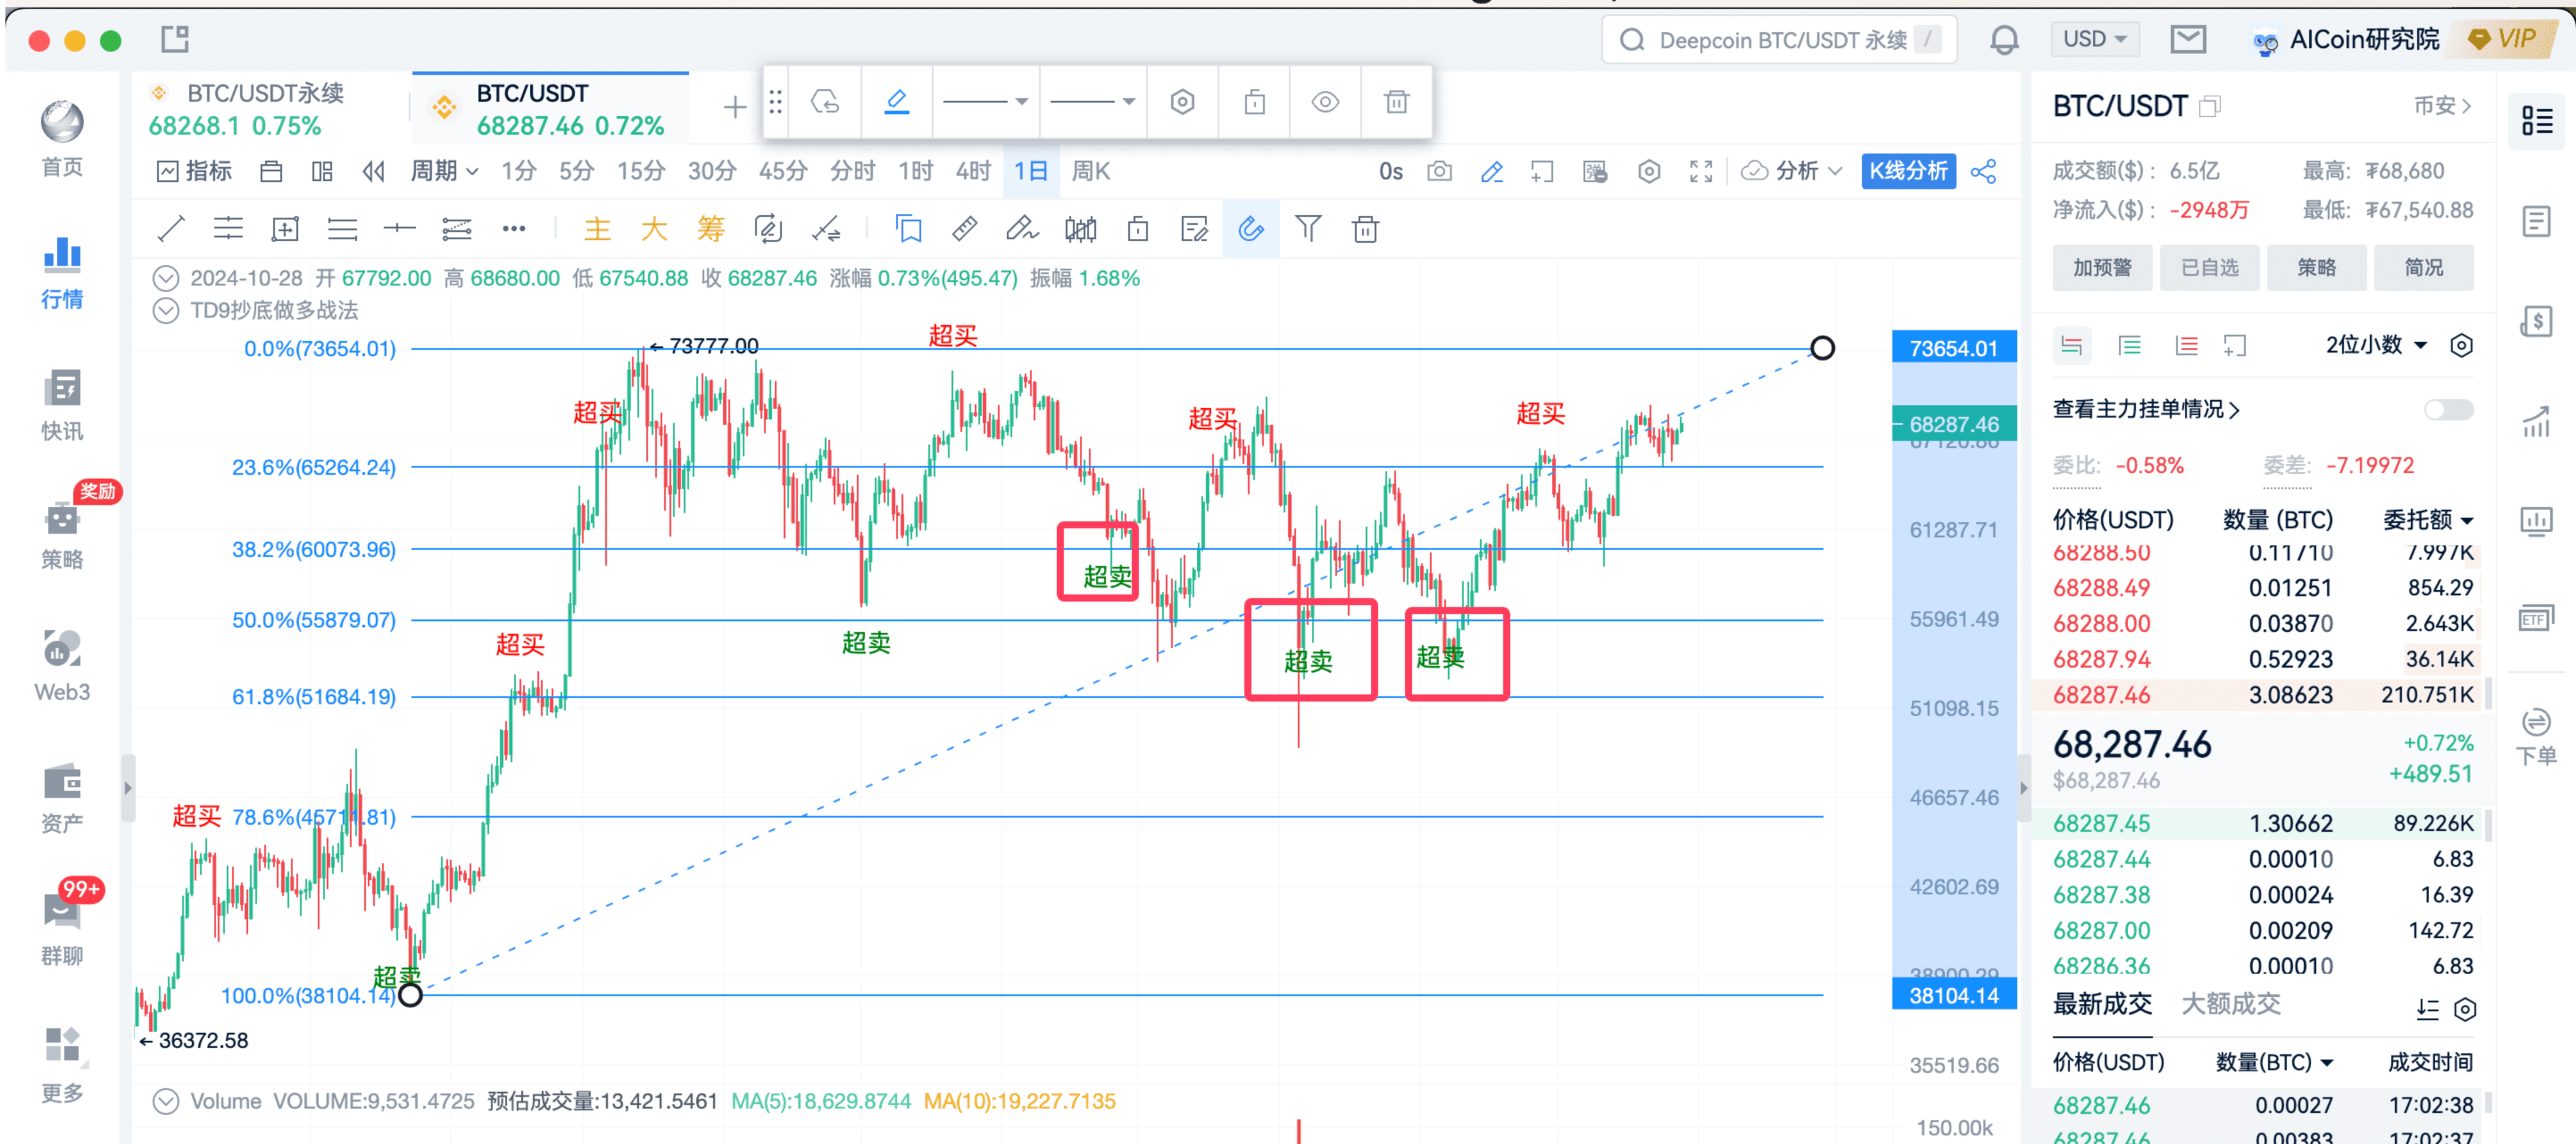
Here, I would like to remind you that the TD signal is just an example.
Today's practical example is only to teach everyone how to use Fibonacci to draw lines to identify whether the signals are high-quality signals, whether they are worth your confidence tenfold, twentyfold, or even a hundredfold.
That concludes the content of this sharing.
Thank you for watching. We hope every AICoin user can find suitable indicator strategies and enjoy abundant wealth!
Recommended Reading
Best Points for Detecting Community Indicators with Fibonacci
Approaching New Highs, How to Cleverly Utilize Resonance Signals - AICoin https://www.aicoin.com/article/424440.html
For more valuable live content, please follow AICoin's “AICoin - Leading Data Market, Intelligent Tool Platform” section, and feel free to download AICoin - Leading Data Market, Intelligent Tool Platform.
免责声明:本文章仅代表作者个人观点,不代表本平台的立场和观点。本文章仅供信息分享,不构成对任何人的任何投资建议。用户与作者之间的任何争议,与本平台无关。如网页中刊载的文章或图片涉及侵权,请提供相关的权利证明和身份证明发送邮件到support@aicoin.com,本平台相关工作人员将会进行核查。


