On November 14th at 16:00, the AICoin editor conducted a graphic and text sharing session titled "Crazy Bull! Teaching You How to Find Golden Entry Opportunities from Pullbacks" in the 【AICoin PC - Group Chat - Live】. Below is a summary of the live content.
Recently, the market has been surging so strongly that the one-sided trend is too dominant; pullbacks are opportunities, and many coins are like this.
Just in time, this live session is to share with everyone how to find entry opportunities again during pullbacks, all practical content!
: How to Find Opportunities in Pullbacks
Method 1: Look for Consecutive Bullish and Bearish Candlesticks
This method can be obtained through the "Carving a Boat to Seek a Sword" approach. Although this method is not scientific, it is effective!
For example, in a 30-minute cycle, you can find 6 consecutive bullish and 5 consecutive bearish candlesticks, which works quite well.
【It is recommended to select the cycle based on personal trading habits.】
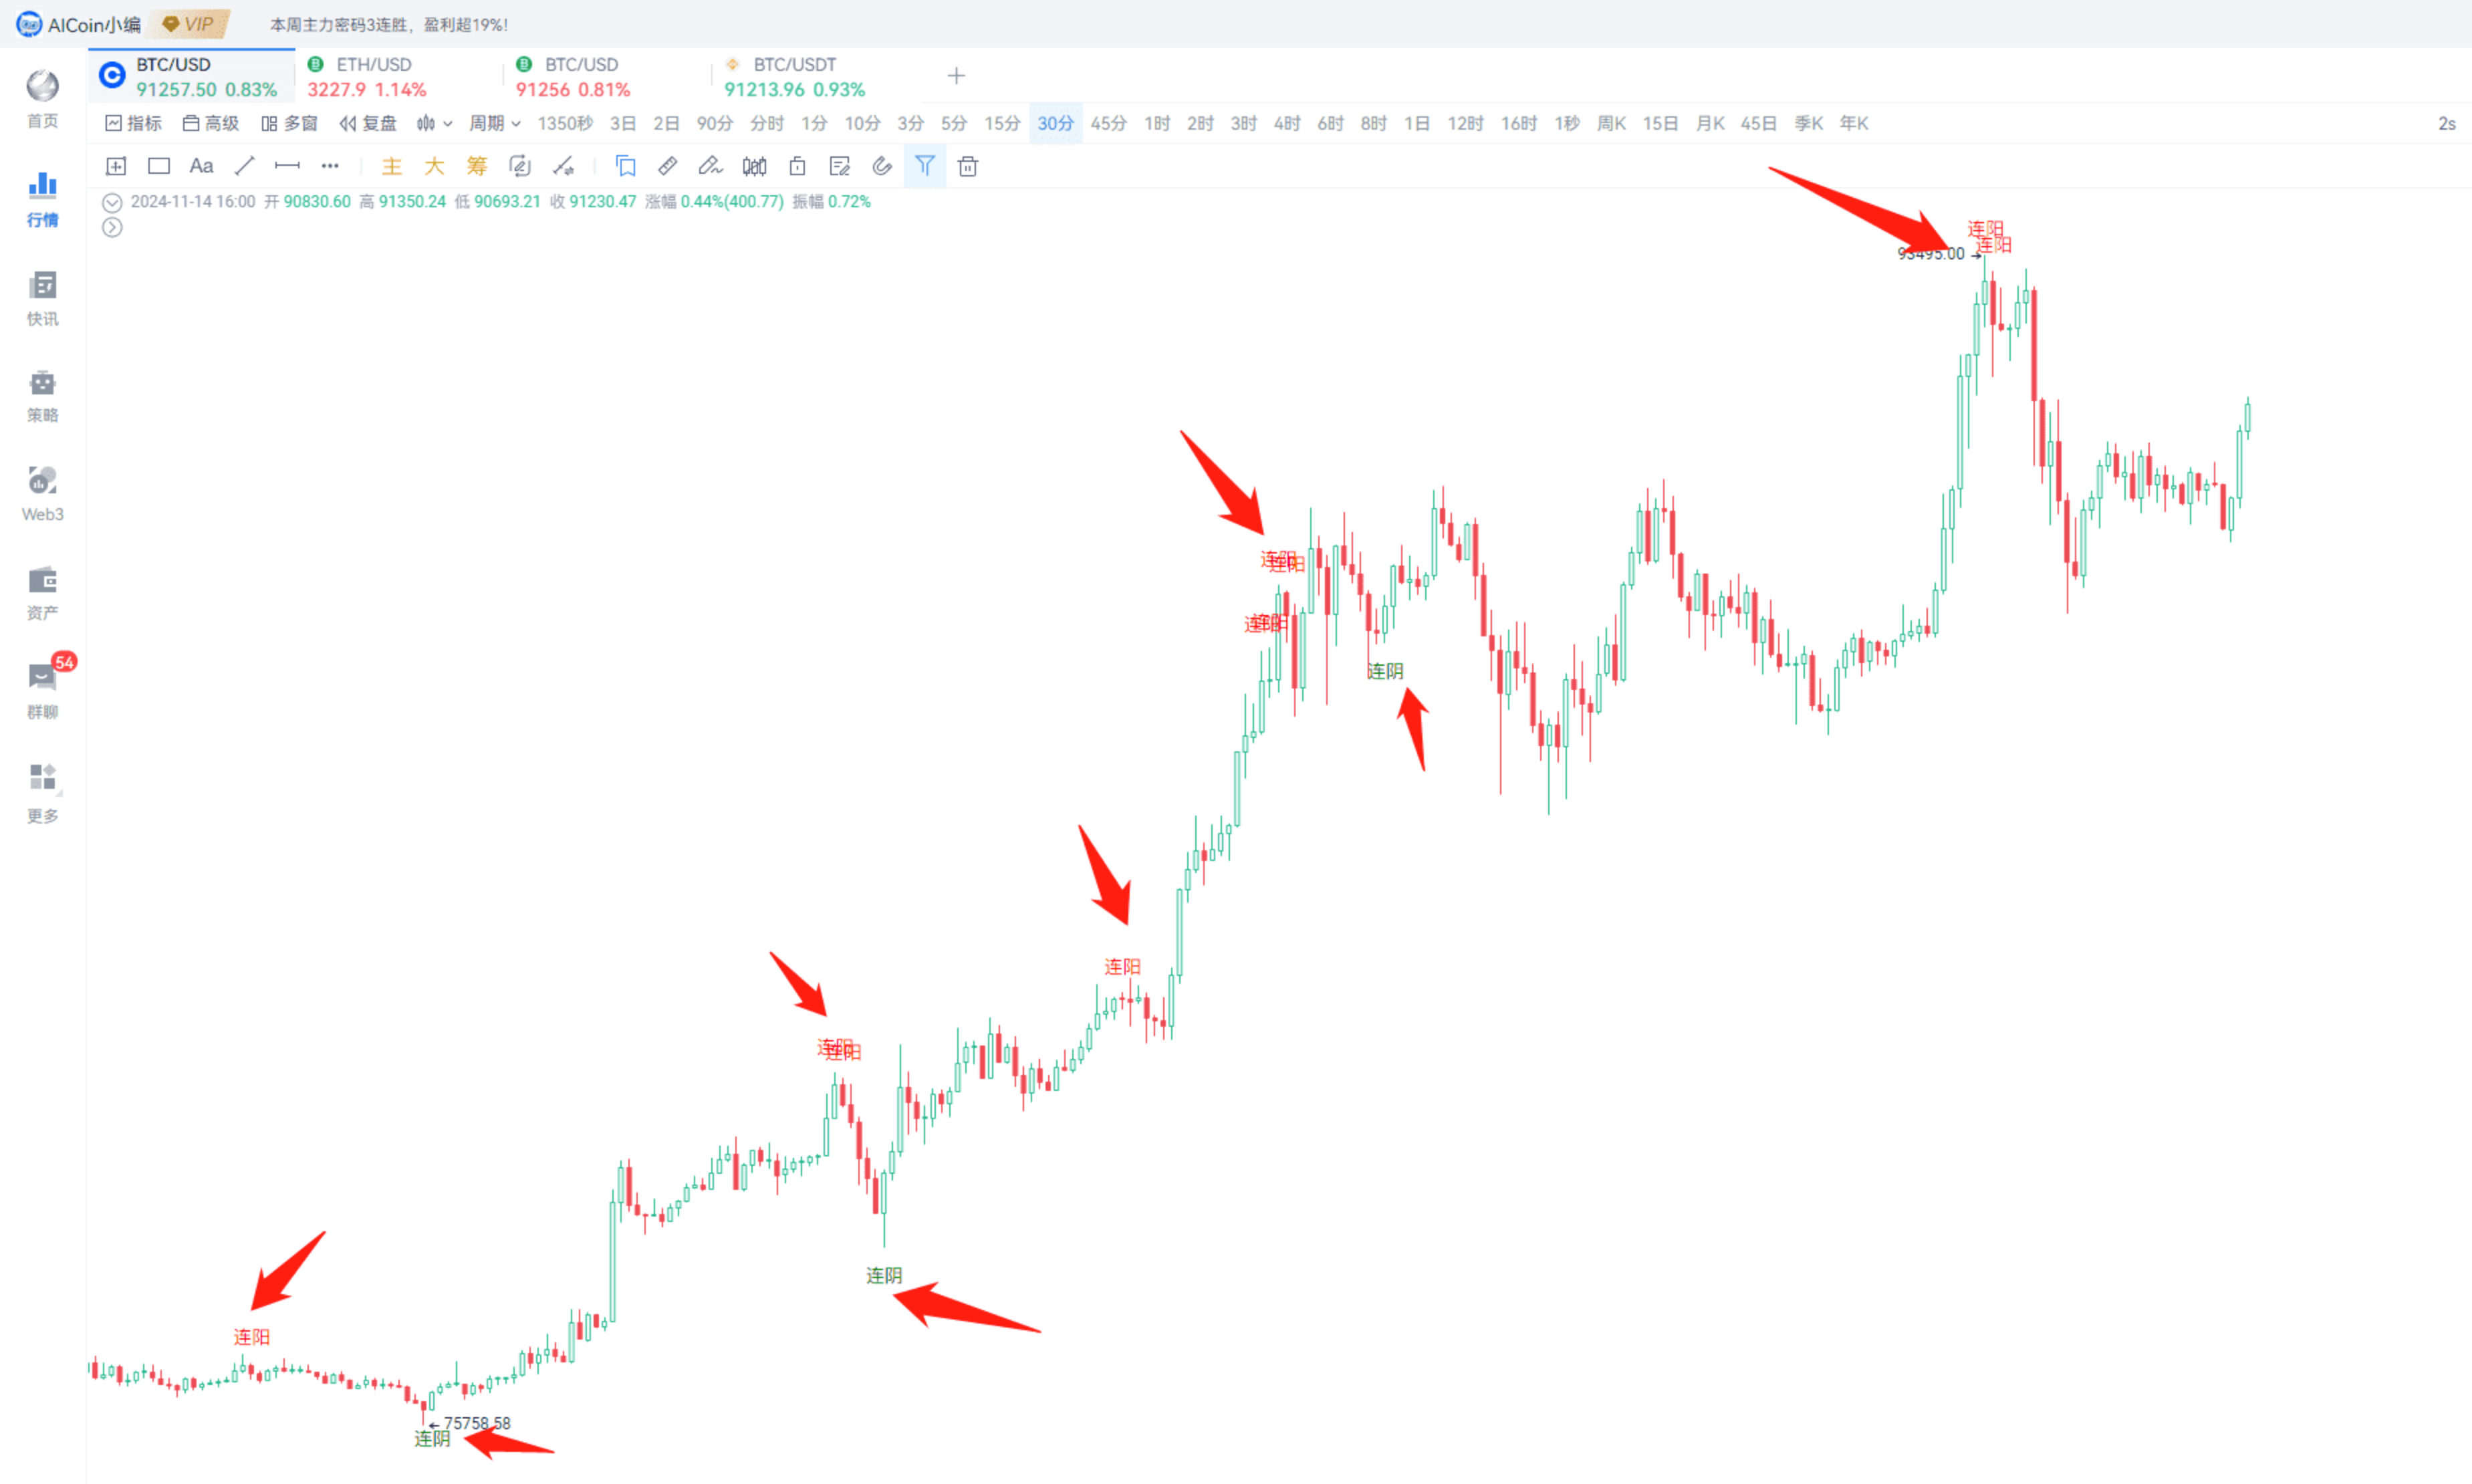
For example, the text signals in my image:
Consecutive Bullish: Top signal
Consecutive Bearish: Entry signal
Carving a boat to seek a sword, so easy!
Additionally, these candlesticks can be monitored through custom indicators; the text signals in my image are supported with alerts.
Method 2: Gaps
This is very suitable for short-term or even ultra-short-term traders~
Gaps are the price gaps between candlesticks, which can be seen as directional signals or as support and resistance zones.
Upward Gap: The price gap formed between the highest price of the previous candlestick and the lowest price of the next candlestick.
Downward Gap: The price gap formed between the lowest price of the previous candlestick and the highest price of the next candlestick.
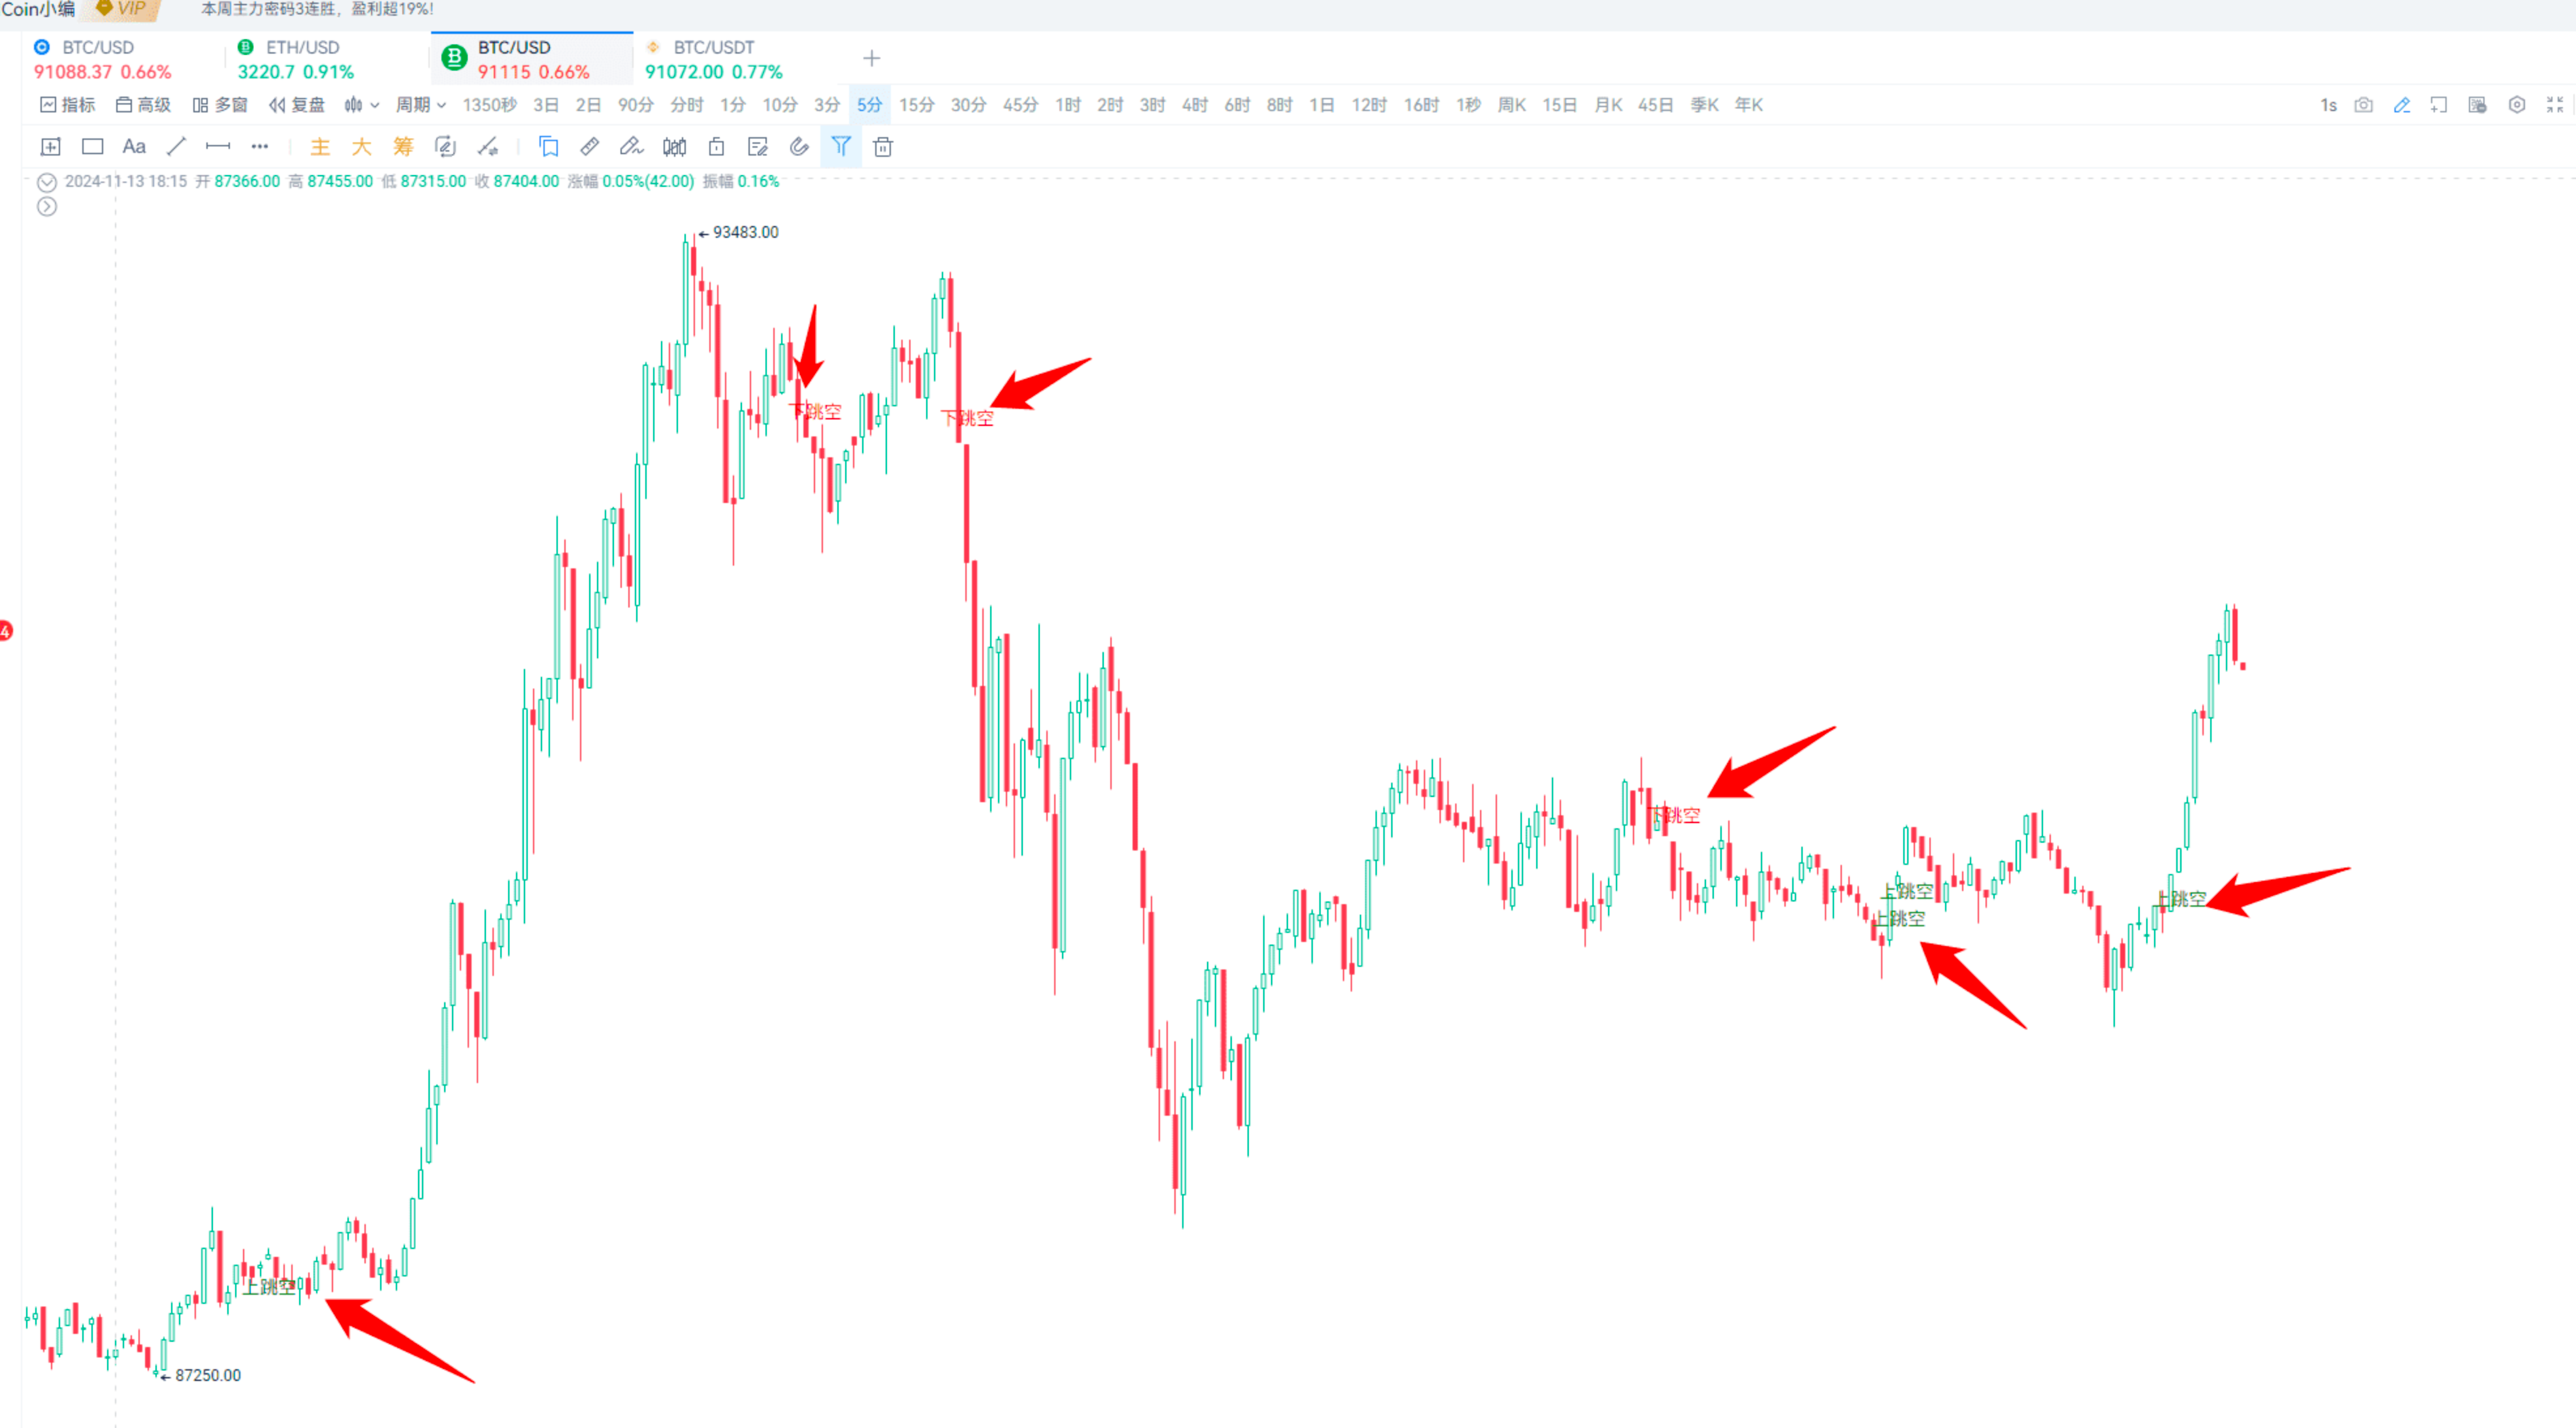
You can see the positions indicated by the arrows in the image below; it is very clear.
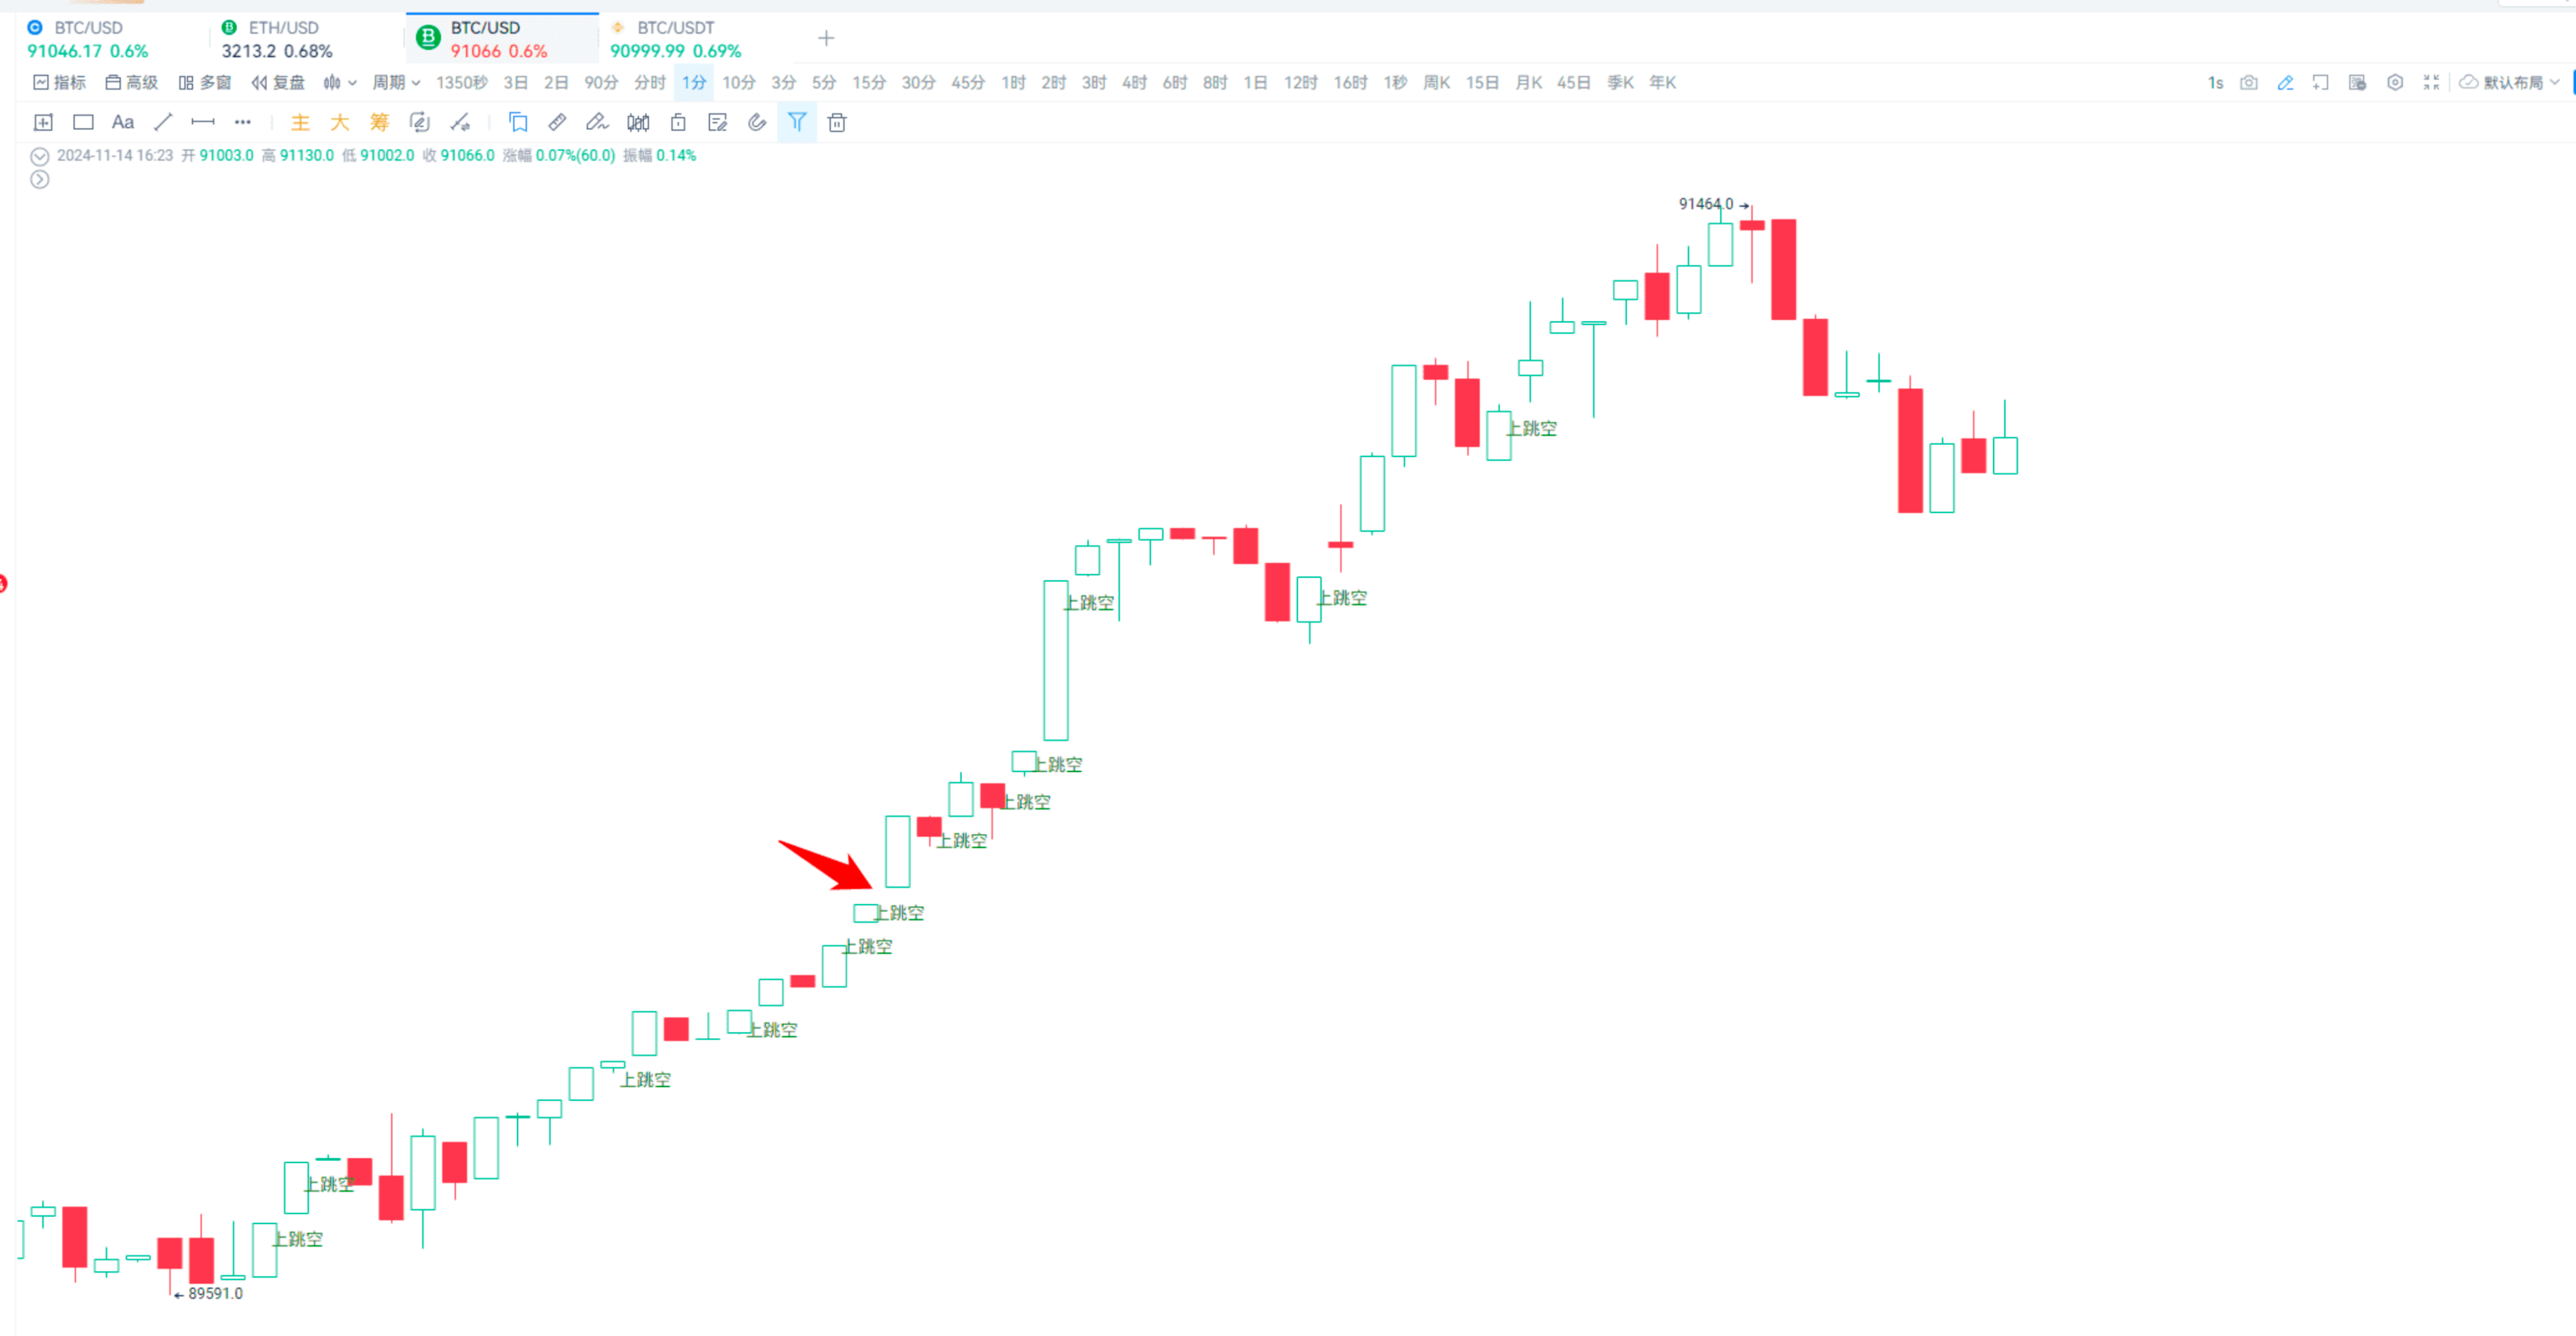
Similarly, this gap pattern can also be implemented using custom indicators.
For friends with no foundation, you can use our AI indicator writing tool, input commands, and the AI will directly generate the code.
Members can give it a try~
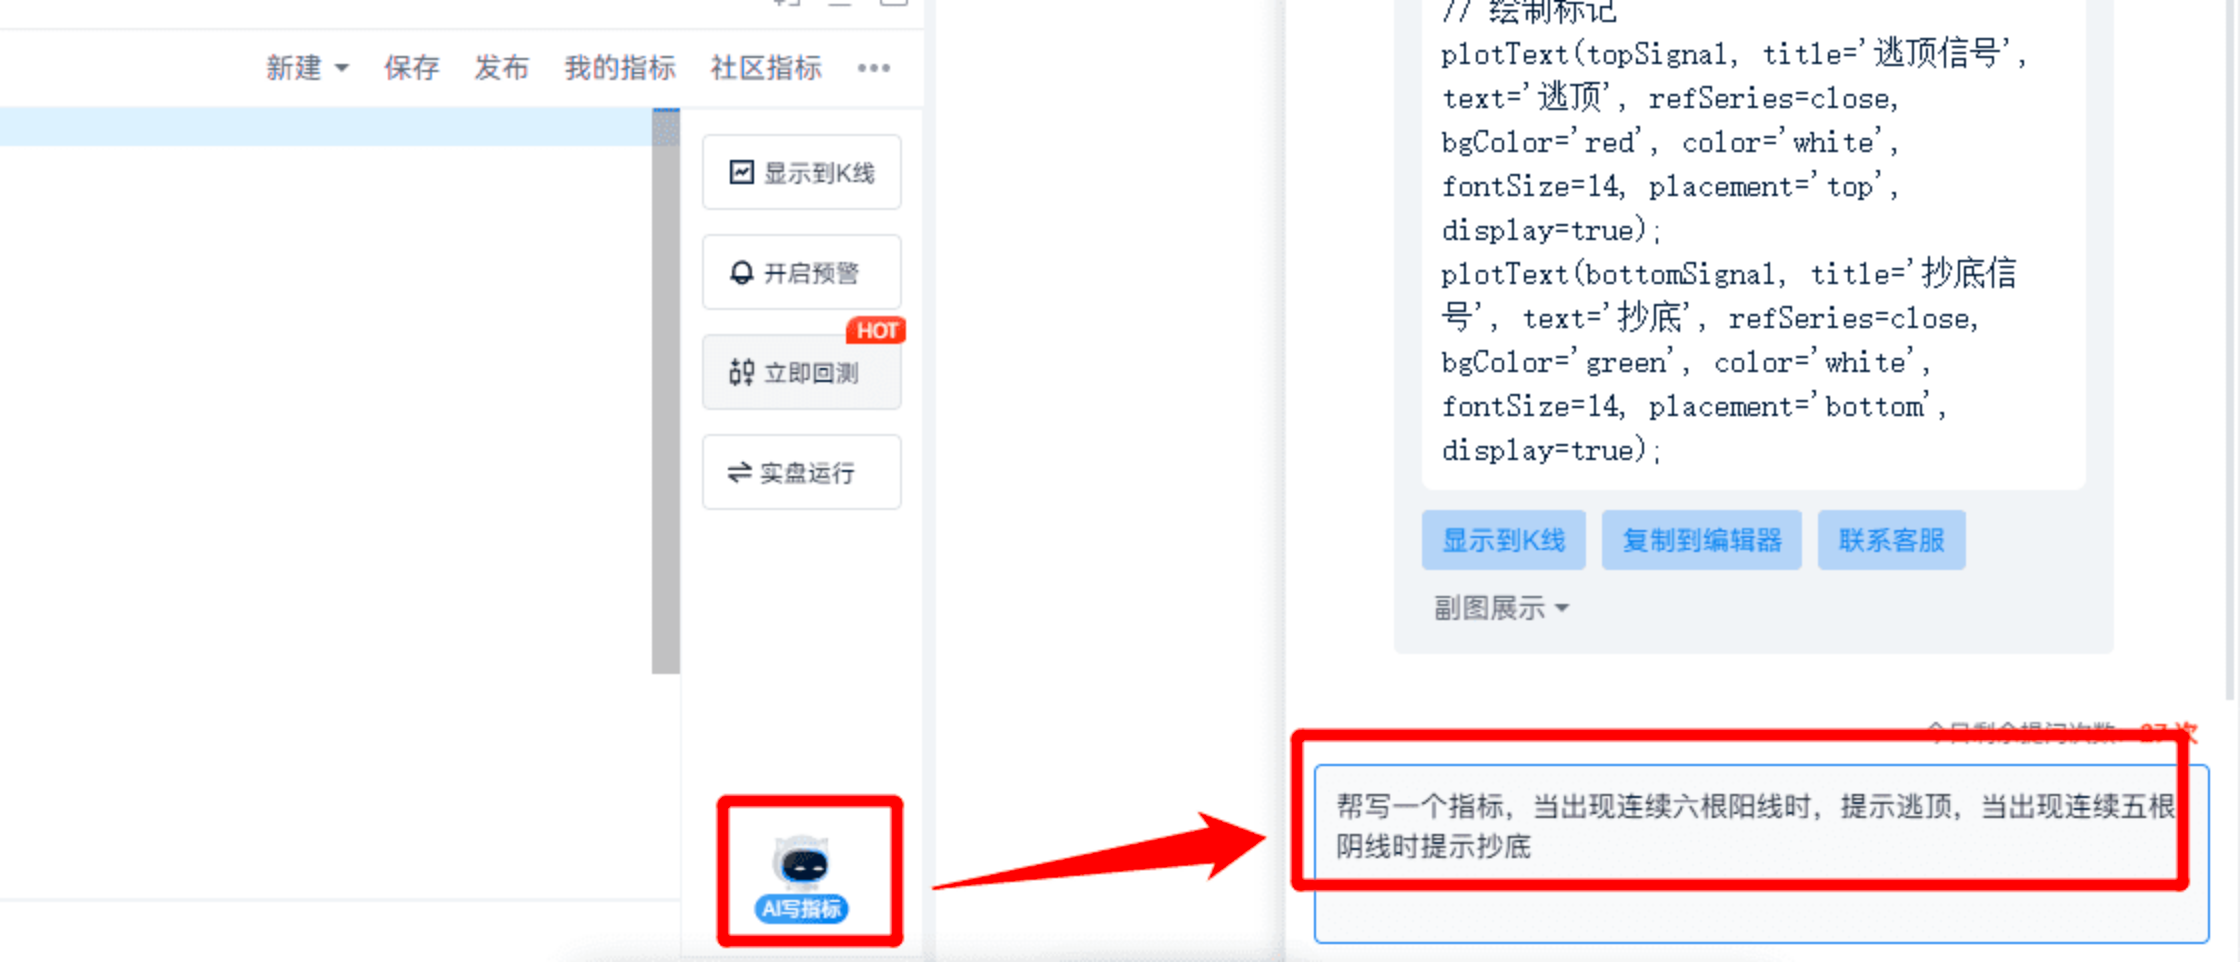
Non-member friends can pay attention to the 10% discount in our live room.
After becoming a member, you can use the AI indicator writing function, and we can also help write complex indicators and convert indicators.
Method 3: Pullbacks that Do Not Break the Moving Average Indicate Bullishness
The editor uses EMA24/52, but other moving averages are also applicable.
I have mentioned several times during previous live sessions that if the candlestick pulls back without breaking the moving average, it is a very good rebound signal.
The editor mainly uses 45-minute and 90-minute cycles.
If the price breaks below the moving average of the current cycle, you need to pay attention to the support situation at a larger level.
For example, if the current cycle is 45 minutes and it has crossed below the moving average, I will look at the signals from the 90-minute cycle, and so on.
Friends using other cycles can do the same; for example, if looking at the 30-minute cycle, then look at the larger level cycle of 1 hour (60 minutes).
When looking at larger cycles, mainly observe the distance of the candlestick from the moving average and the intersection situation.
Using these two cycles as an example, you can identify false breakout signals:
False Breakout: The 45-minute cycle crosses above the moving average, but fails to break the moving average in the 90-minute cycle.
False Breakdown: The 45-minute cycle crosses below the moving average, but receives support from the moving average in the 90-minute cycle.
If implemented with custom indicators, the false breakdown signal is represented by the green arrow in the image.
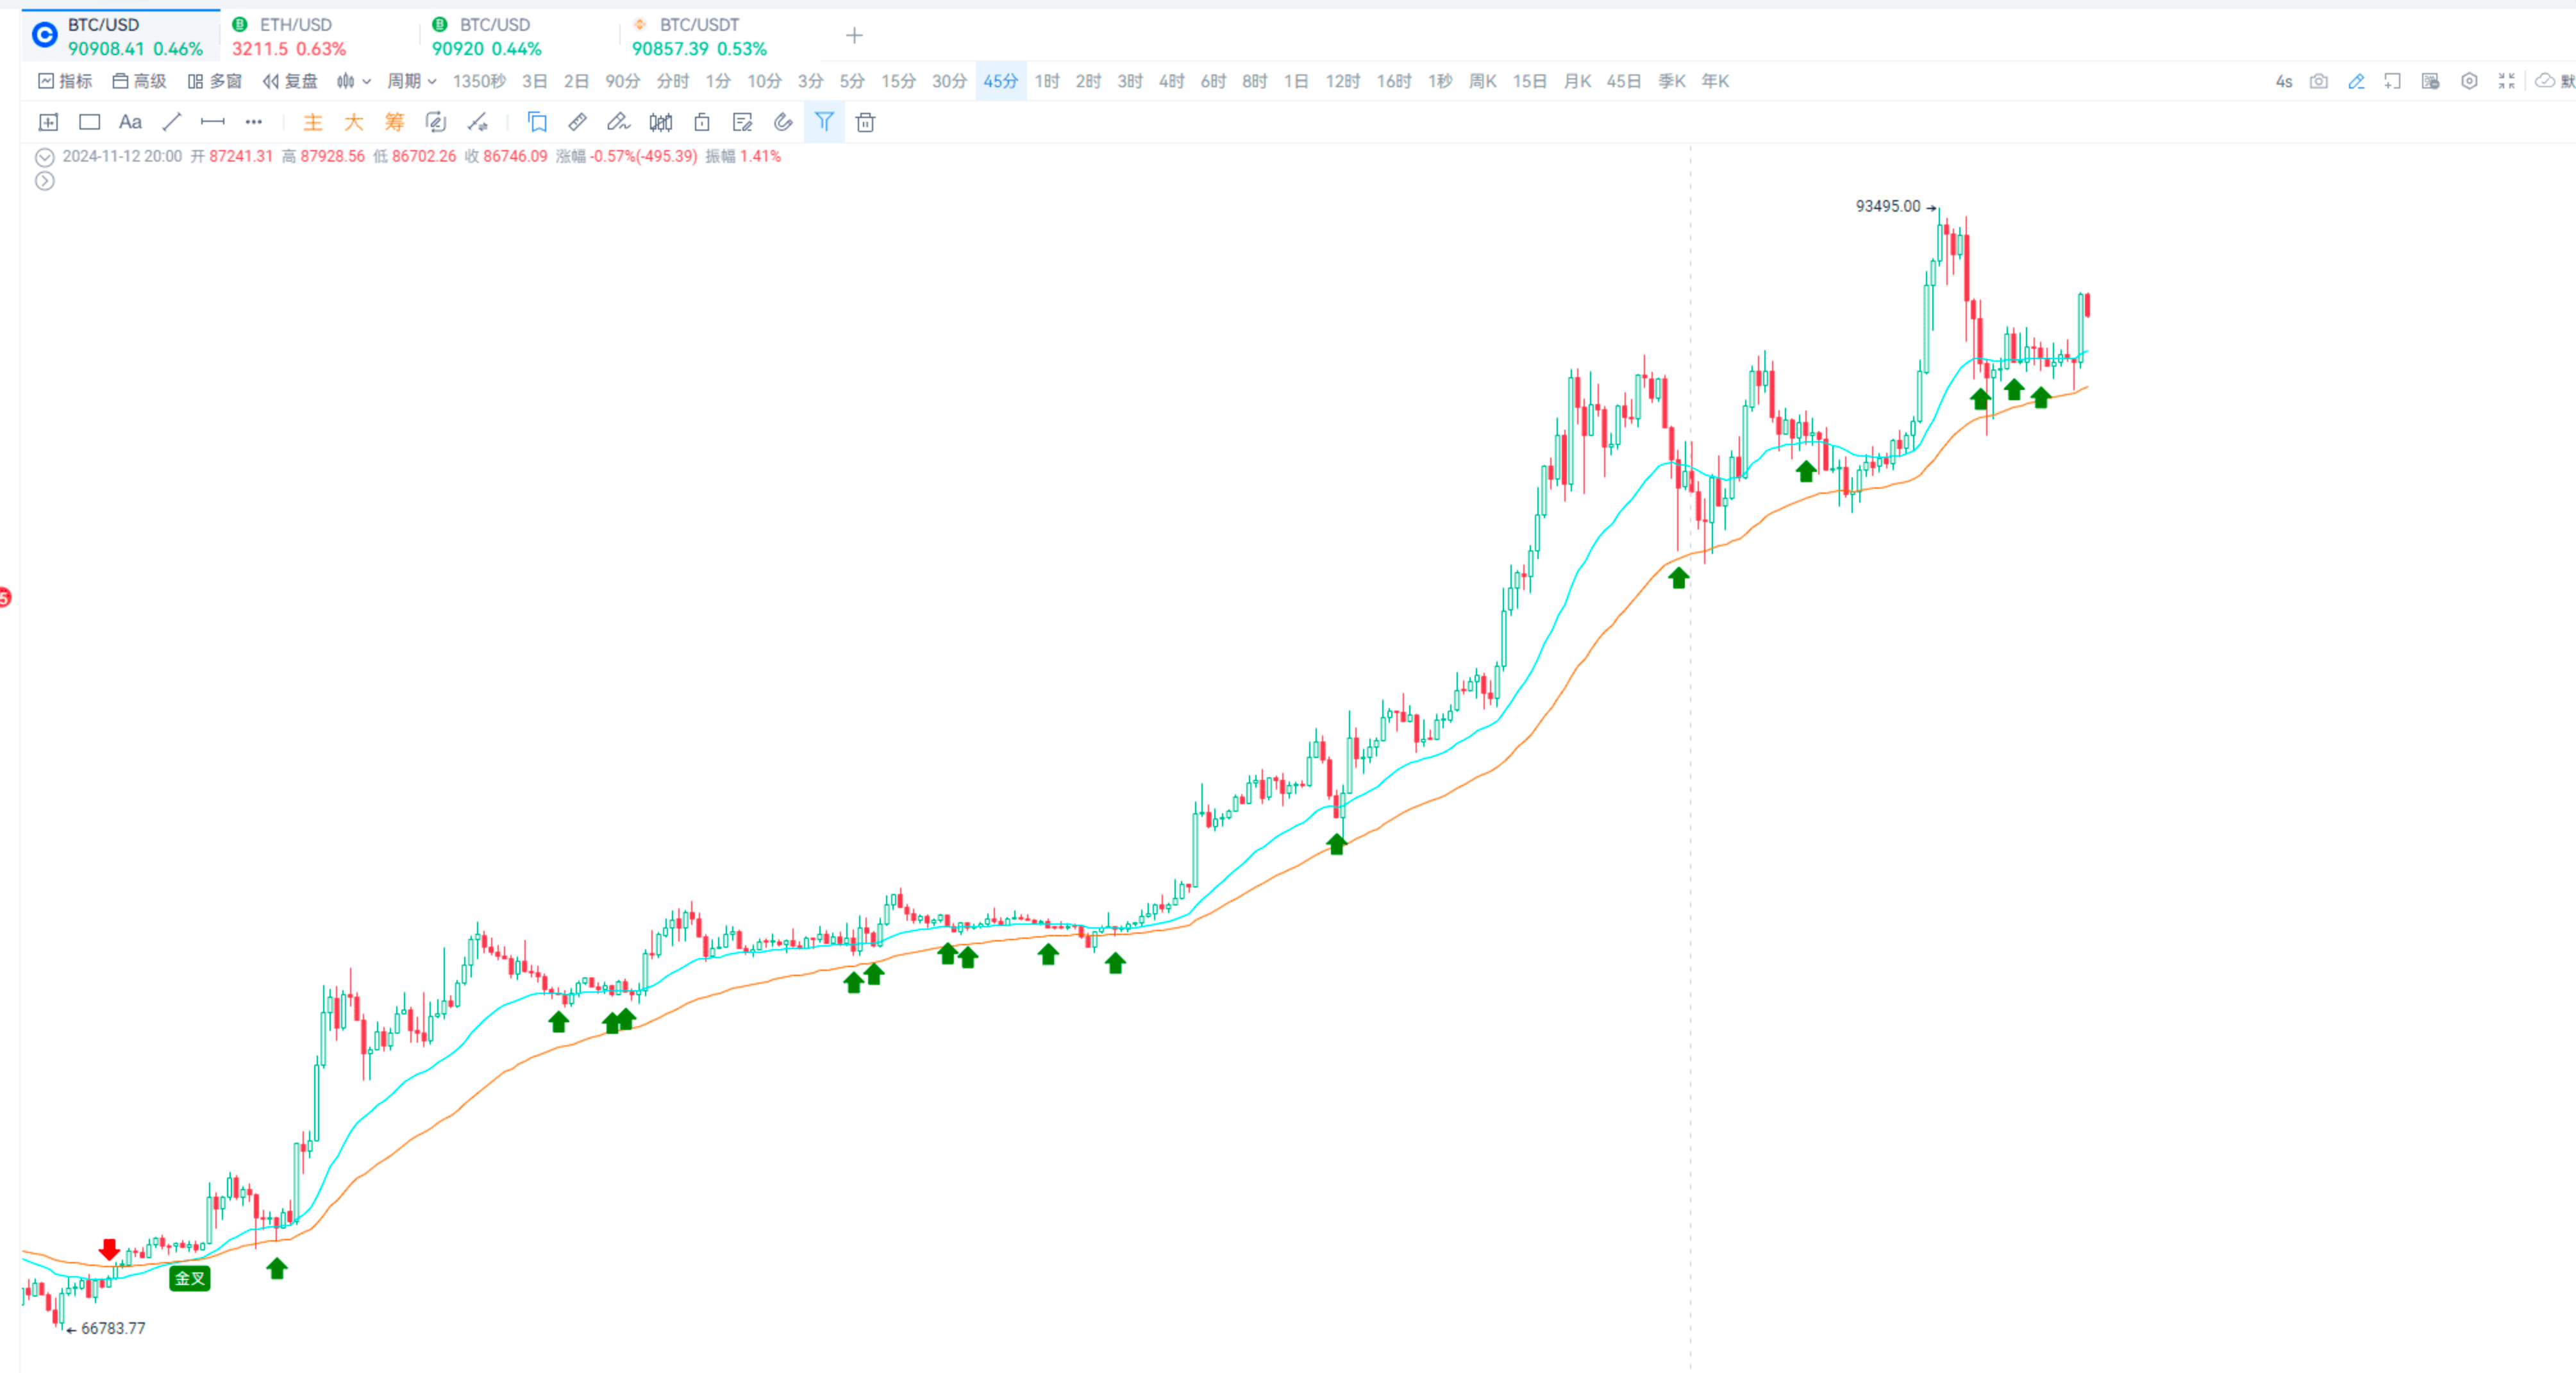
For example, the true bullish and bearish signals in my screenshot are these breakout signals, which are an upgraded version of the previous false strategy.
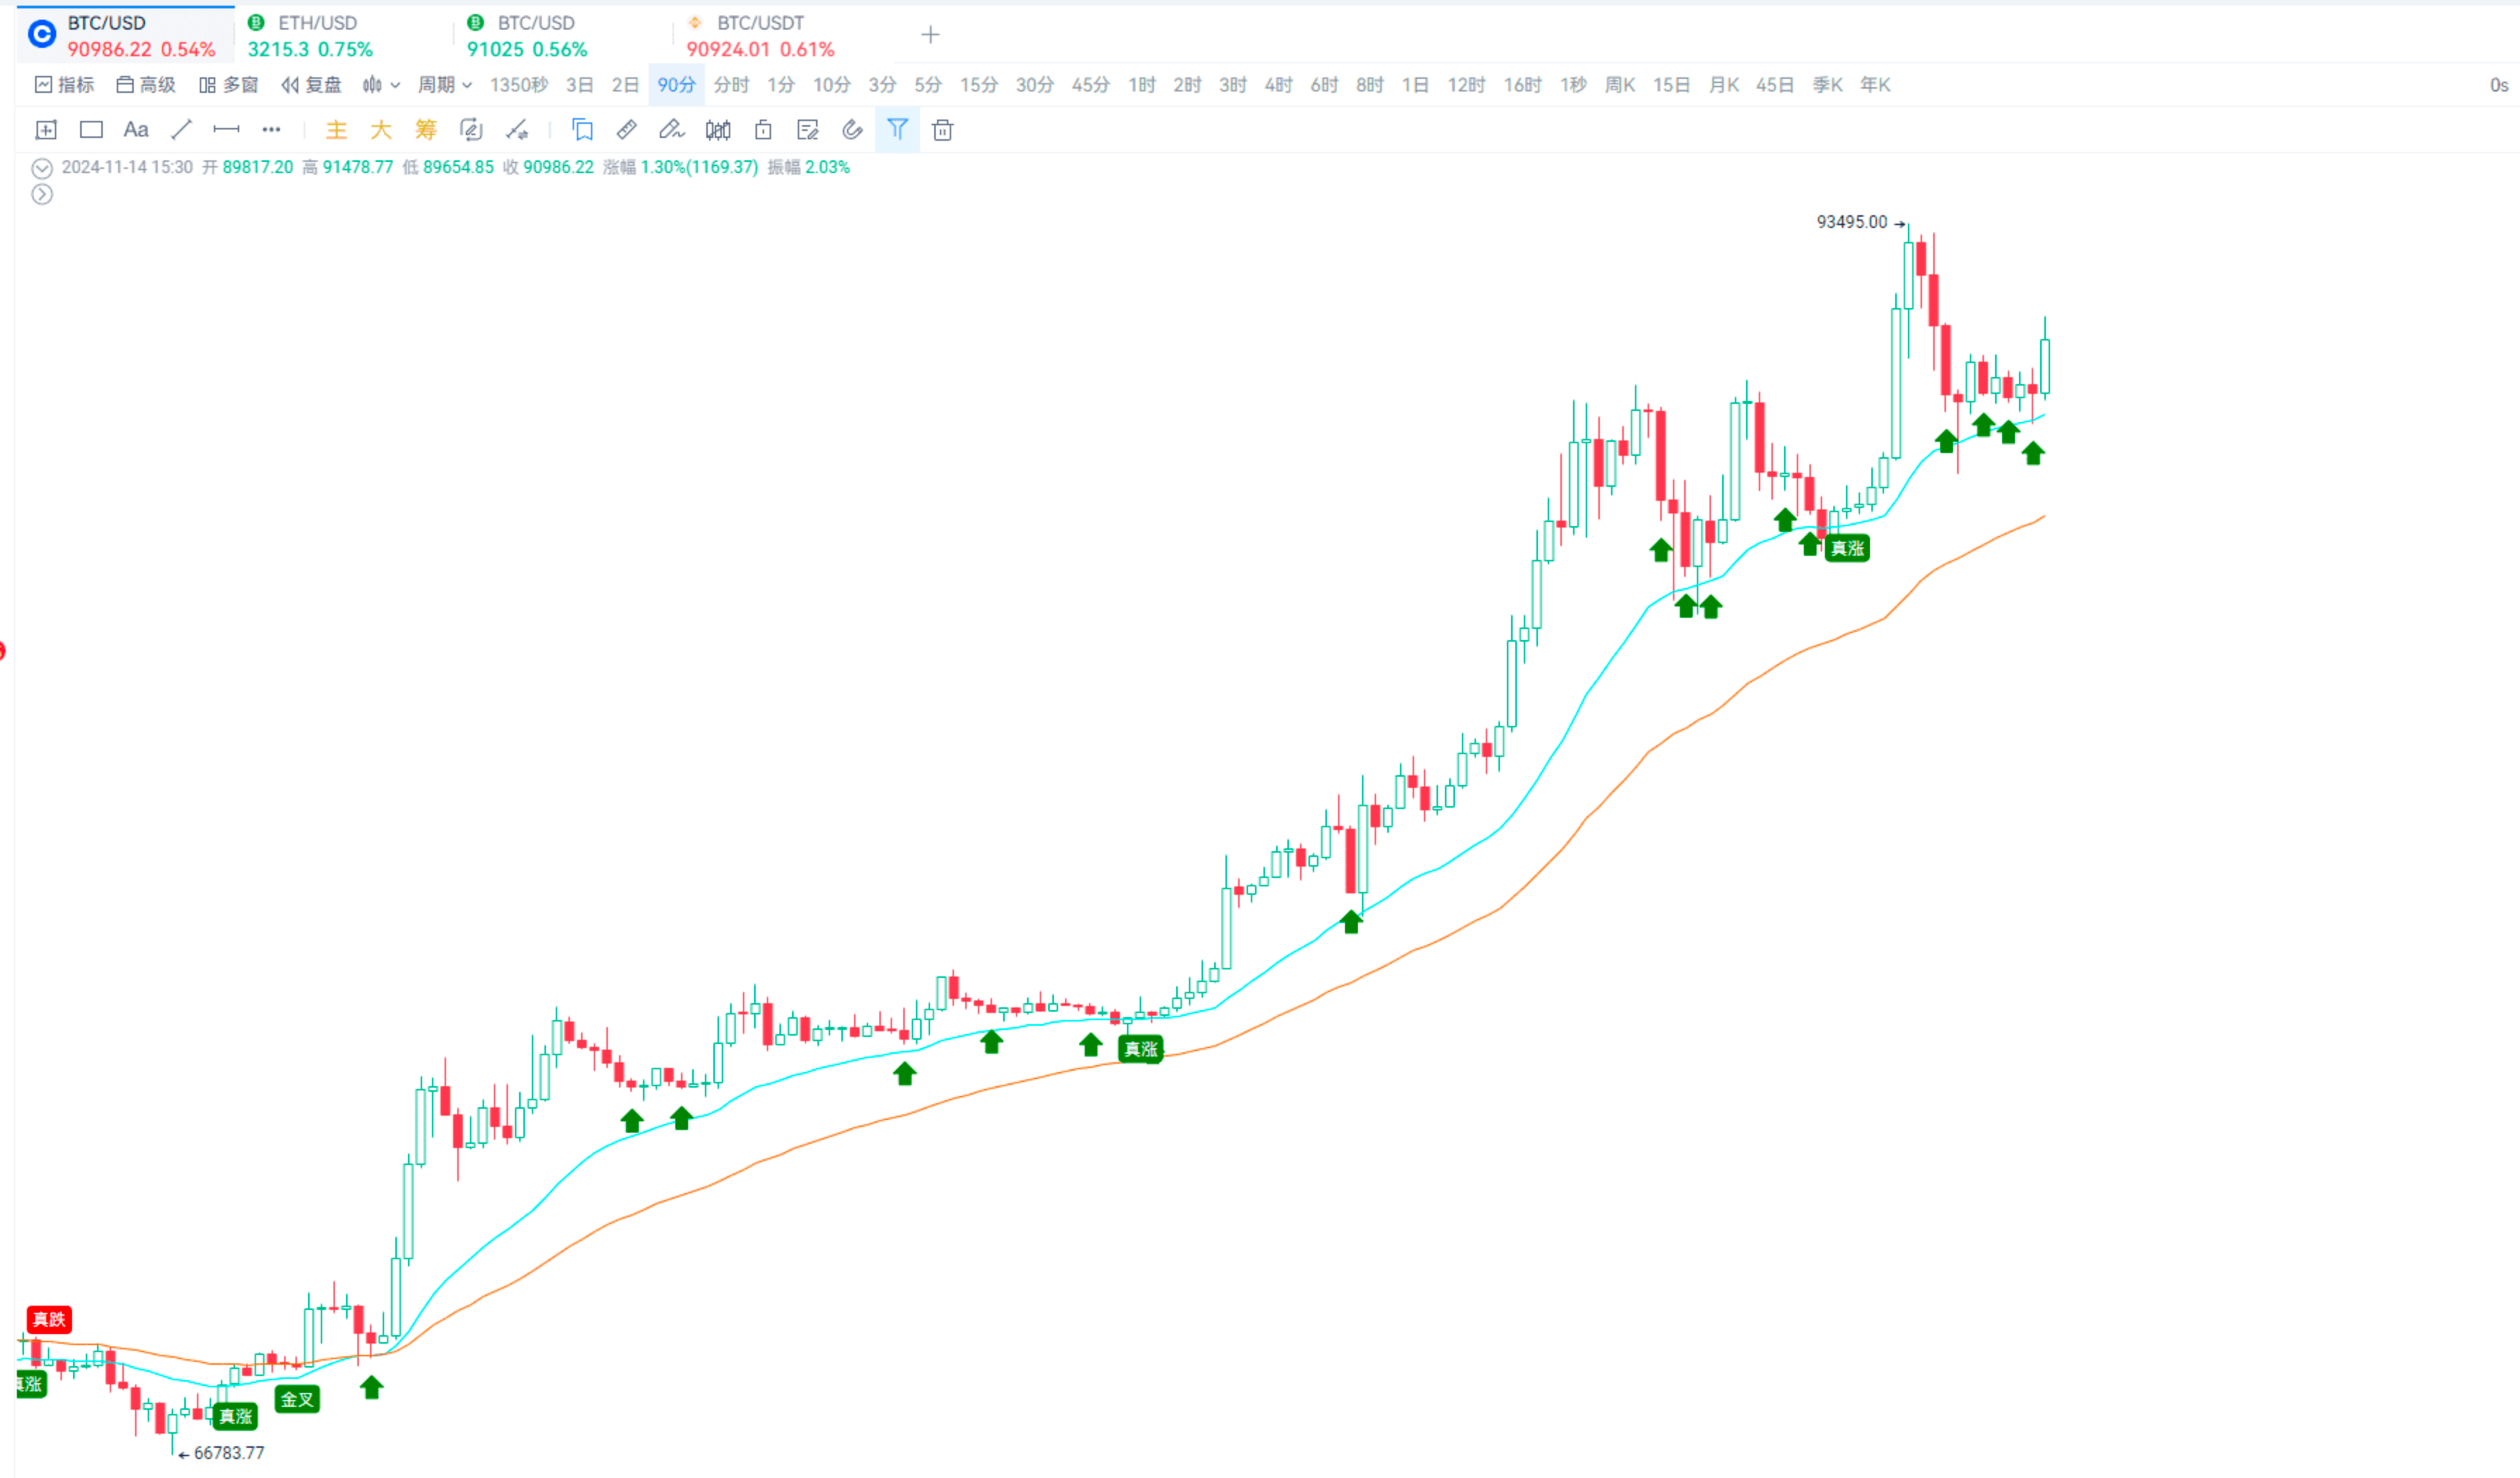
If you are interested, you can subscribe to my 【False Strategy】 and 【Breakout Hunter】 indicators.
Breakout Hunter: https://www.aicoin.com/link/script-share/details?shareHash=7dOMvoJPObMdyqaXAICoin - Leading Data Market and Smart Tools Platform
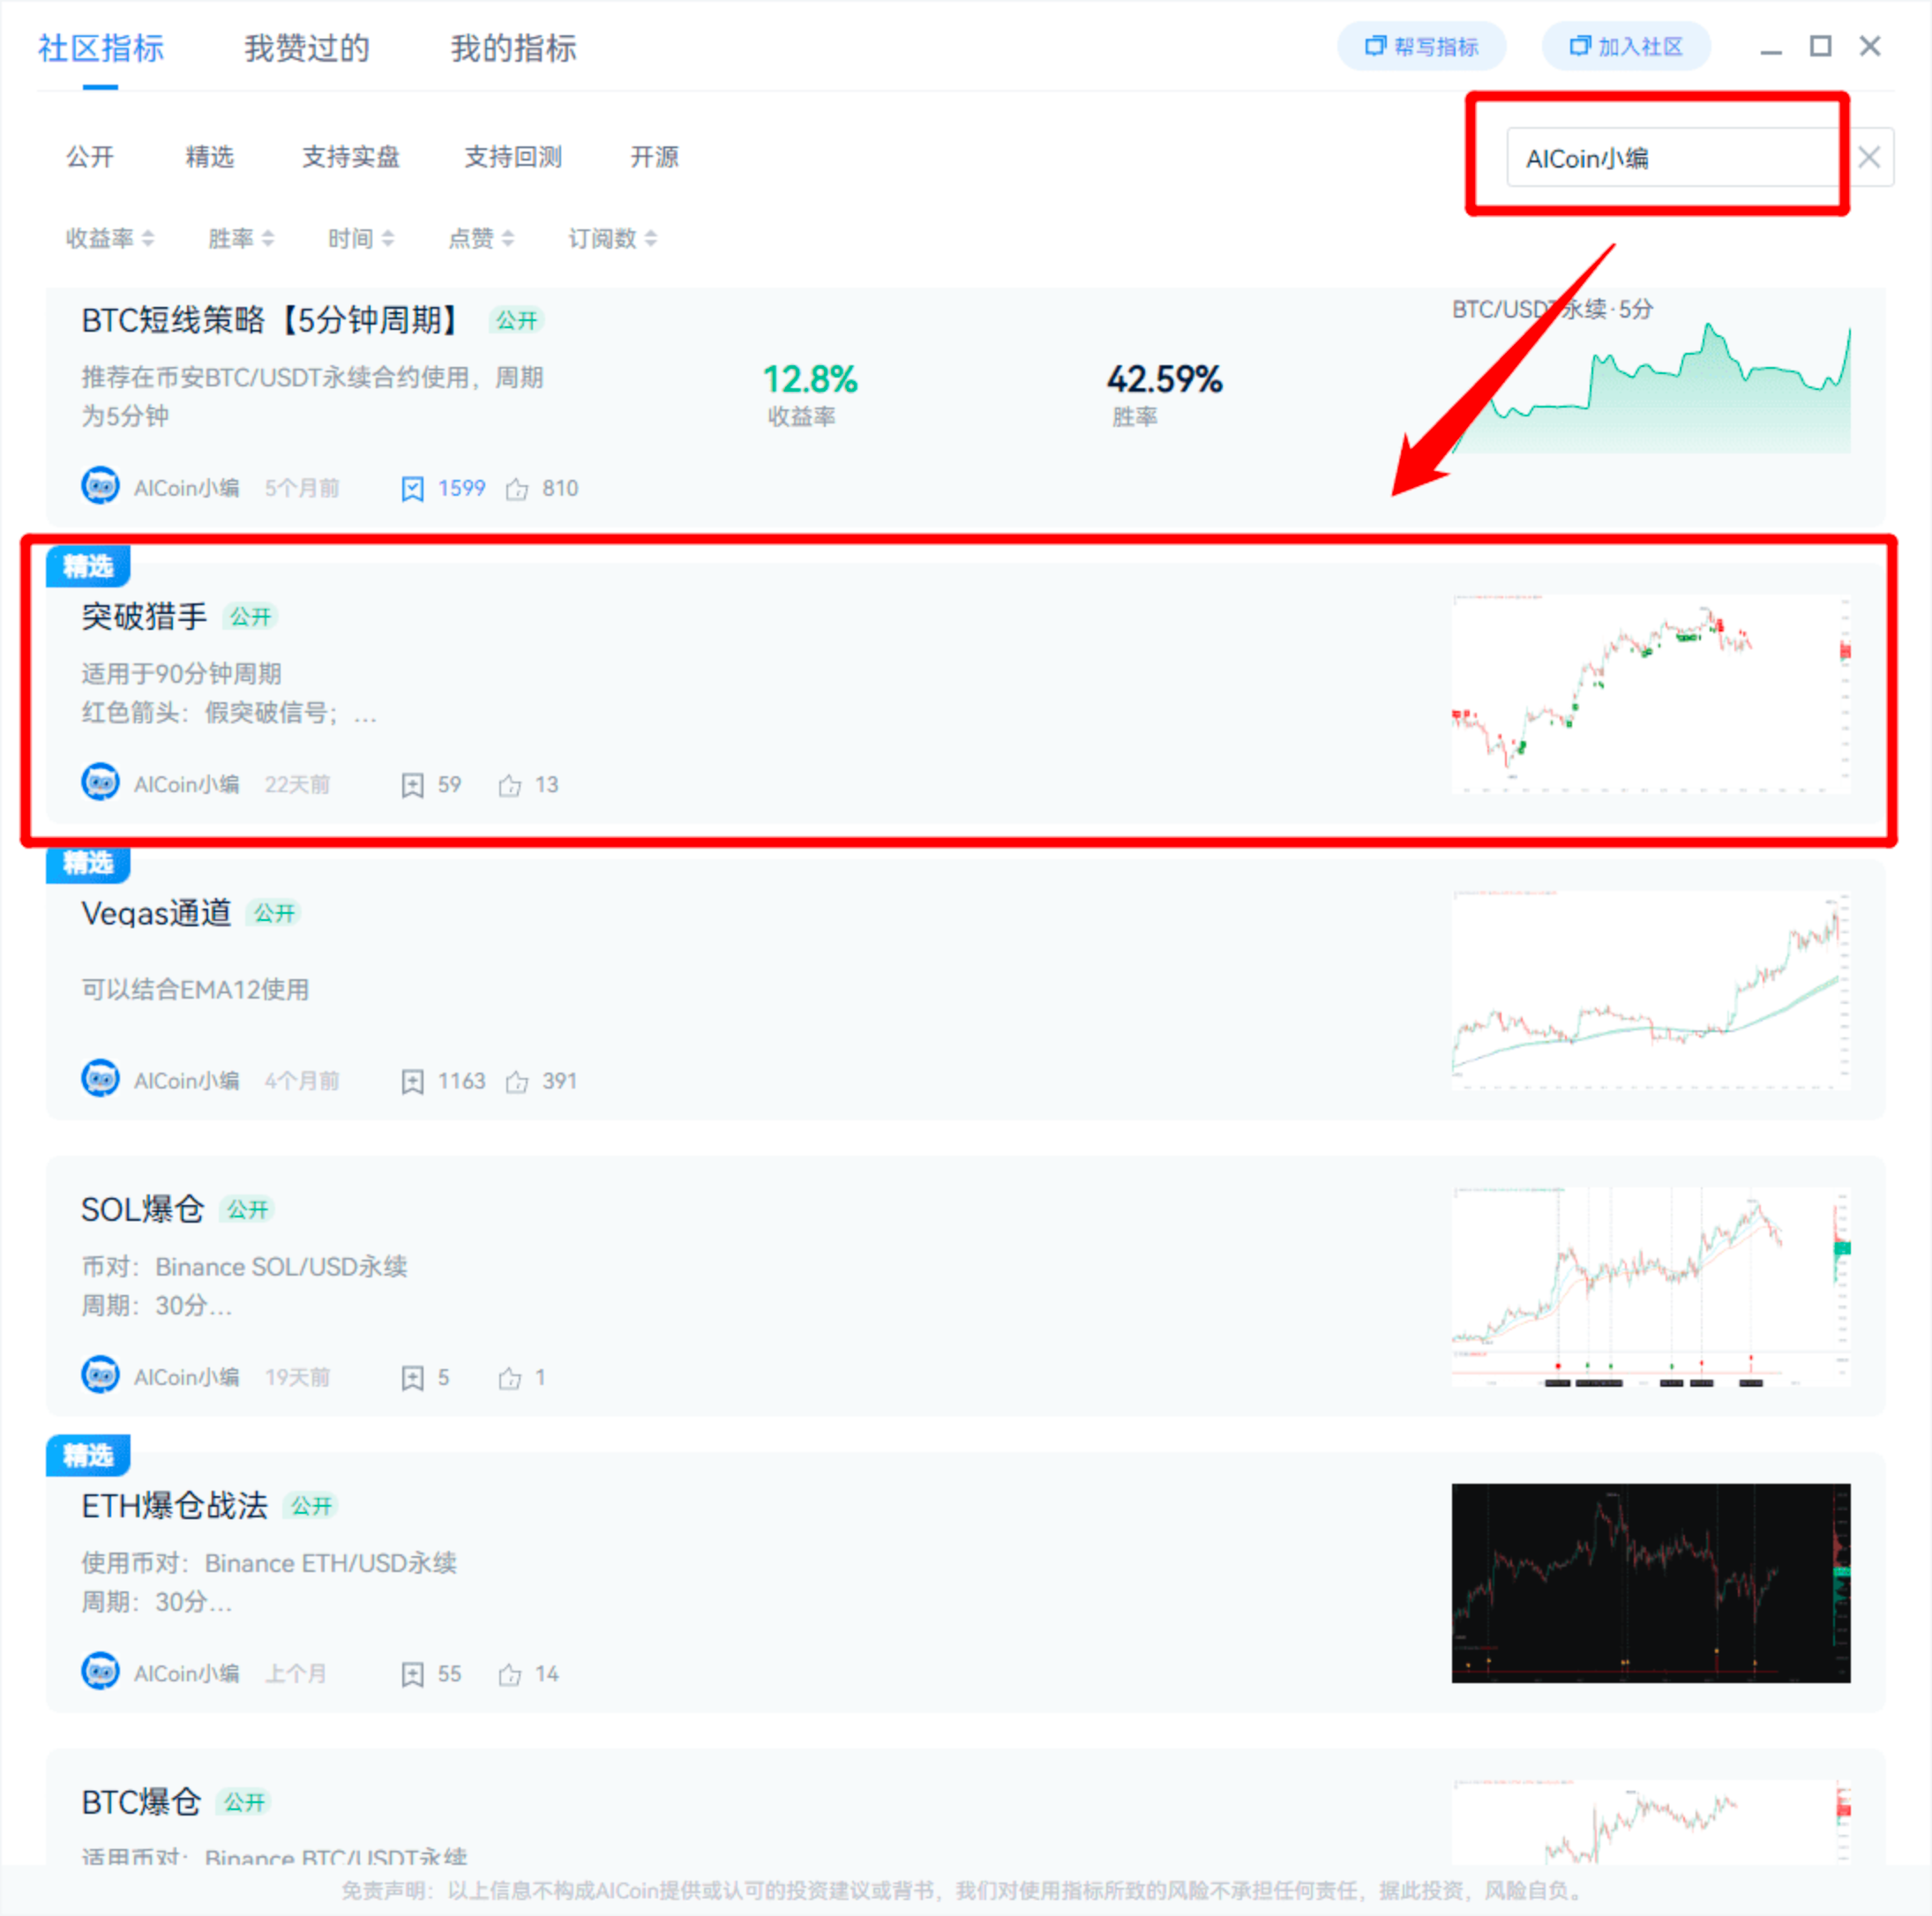
【Emphasis: Strategies are for reference only.】
Additionally, you can display the moving averages of smaller cycles on larger cycles, allowing you to observe the moving average breakout situation simultaneously.
For example, in my screenshot, the green and blue lines represent the moving averages of the 45-minute cycle.
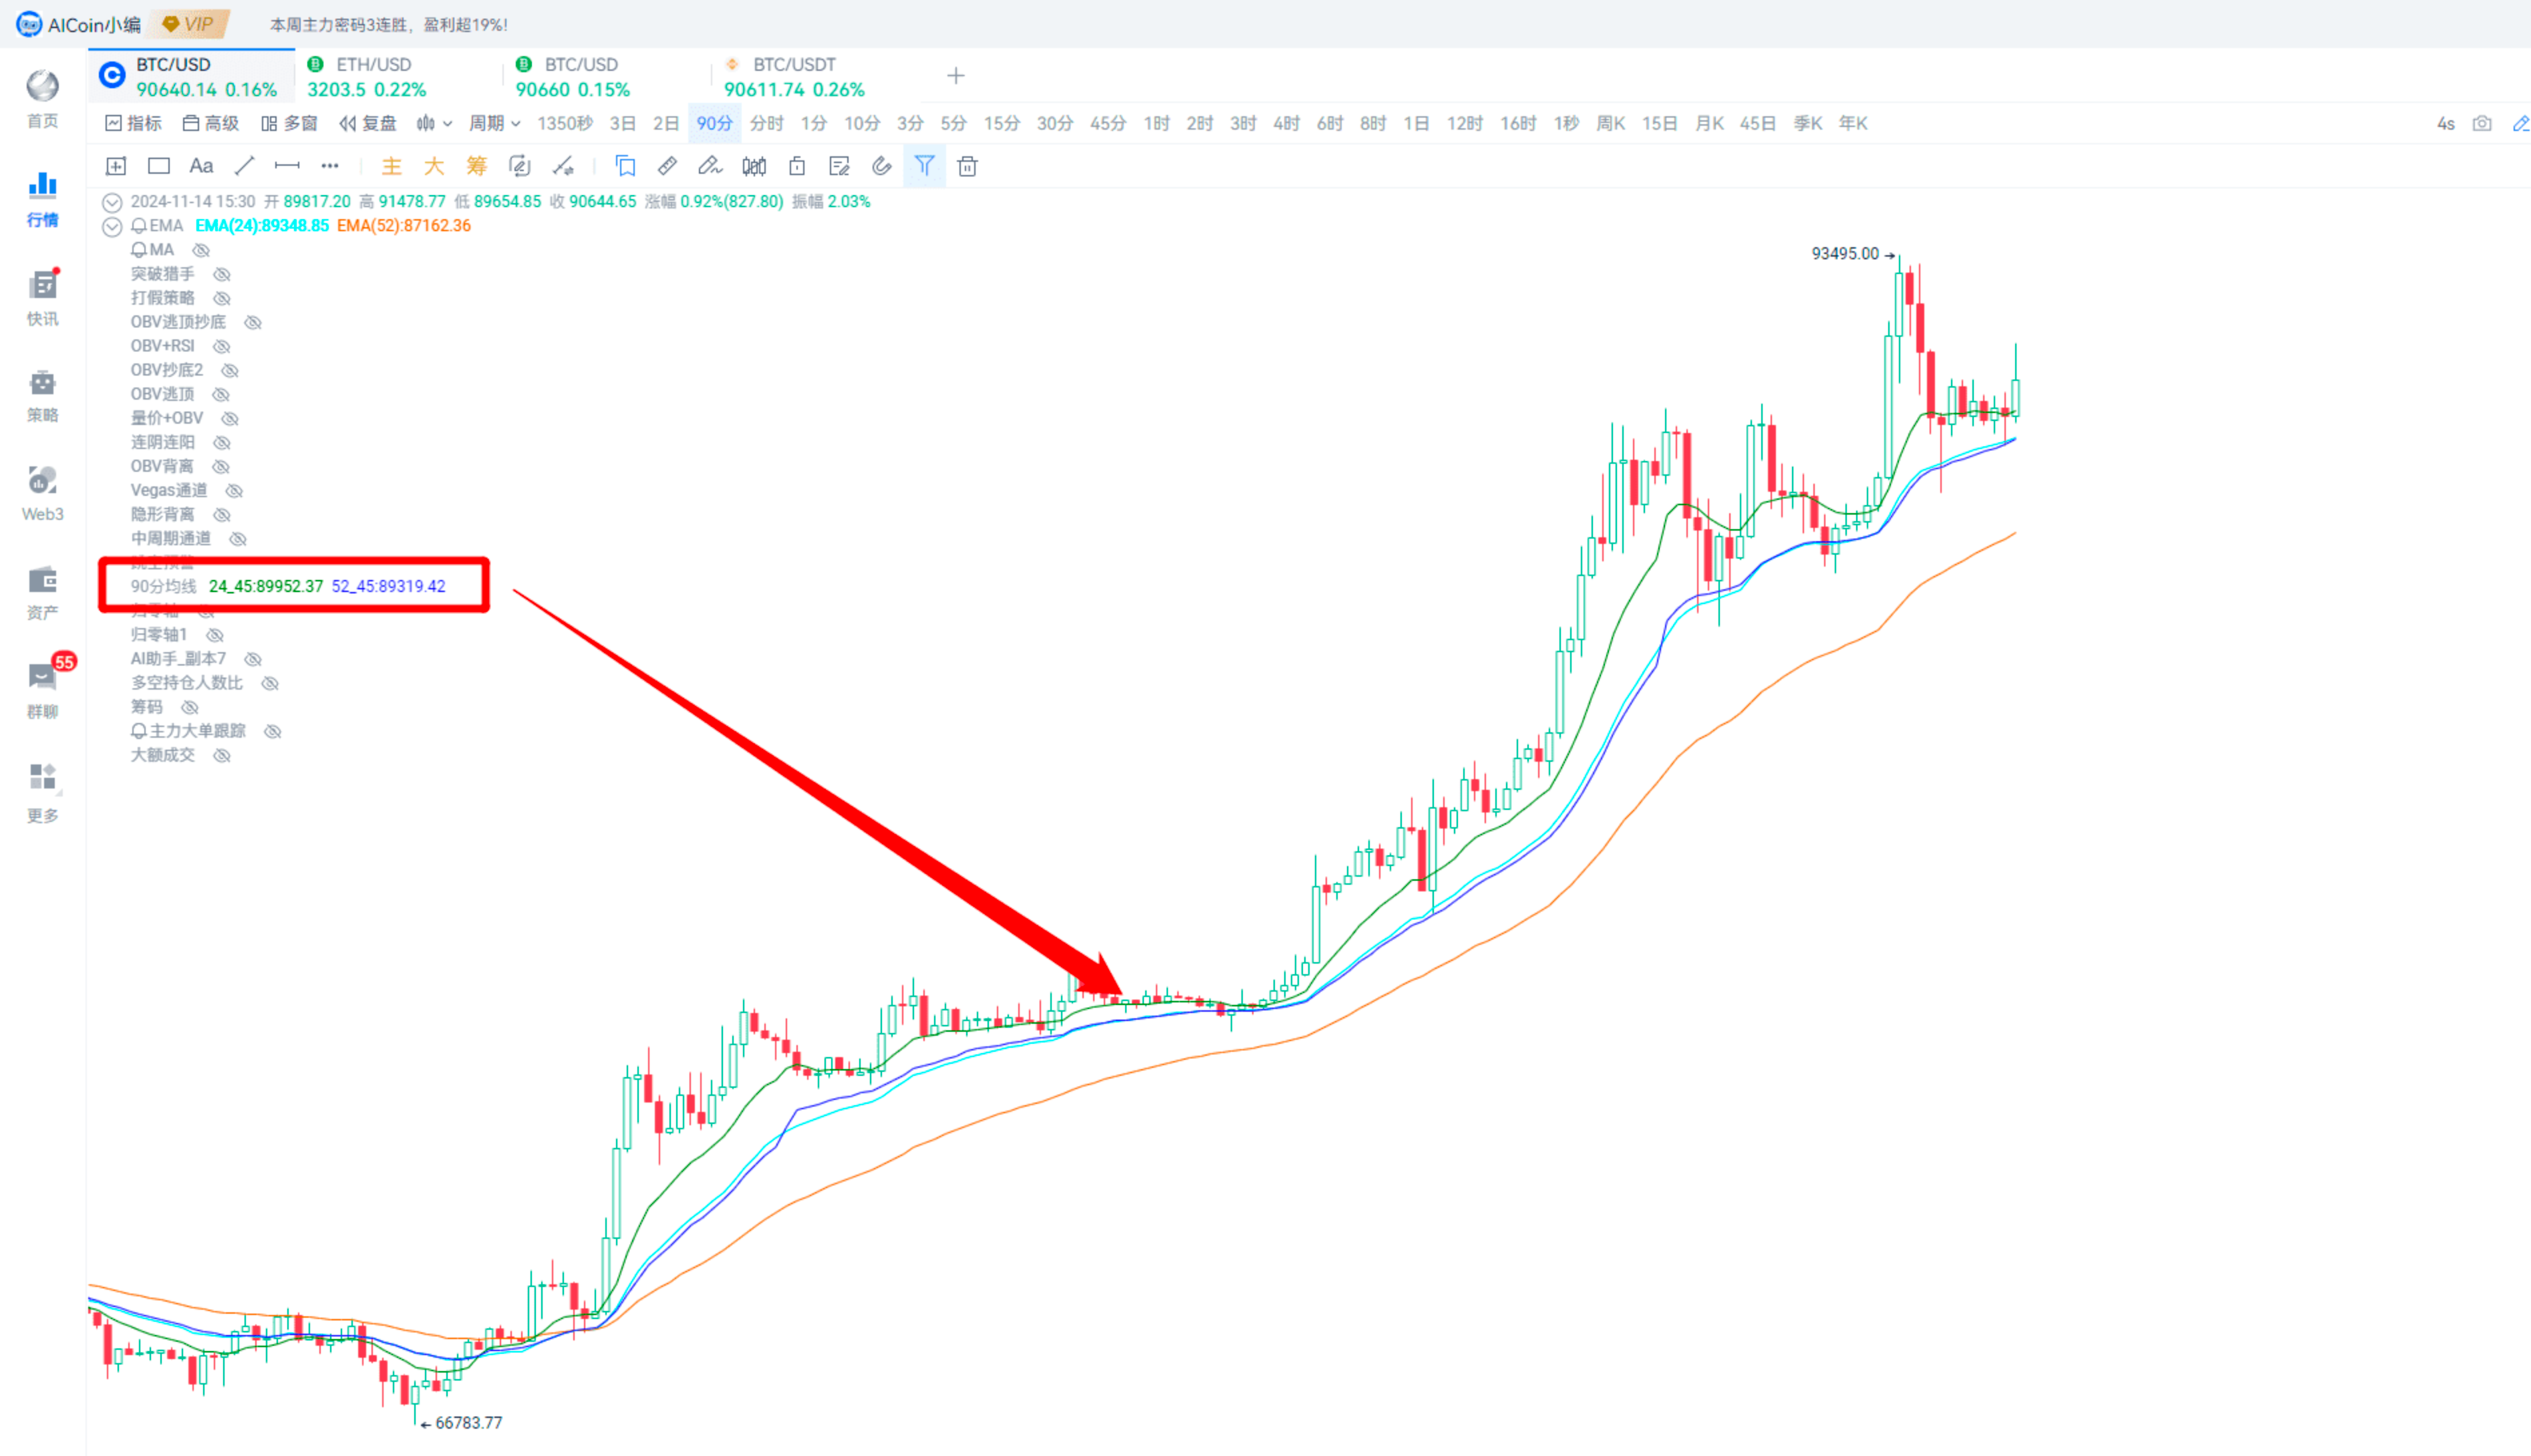
Method 4: Price Near EMA52 Moving Average, While MACD Fast and Slow Lines Approach the Zero Axis, Indicates a Good Rebound Signal
Prerequisite: The DEA slow line must be above the zero axis.
Similarly, this situation can also be monitored using custom indicators; the benefit of indicator monitoring is that you do not have to keep an eye on it manually.
This is a very good method for finding entry points.
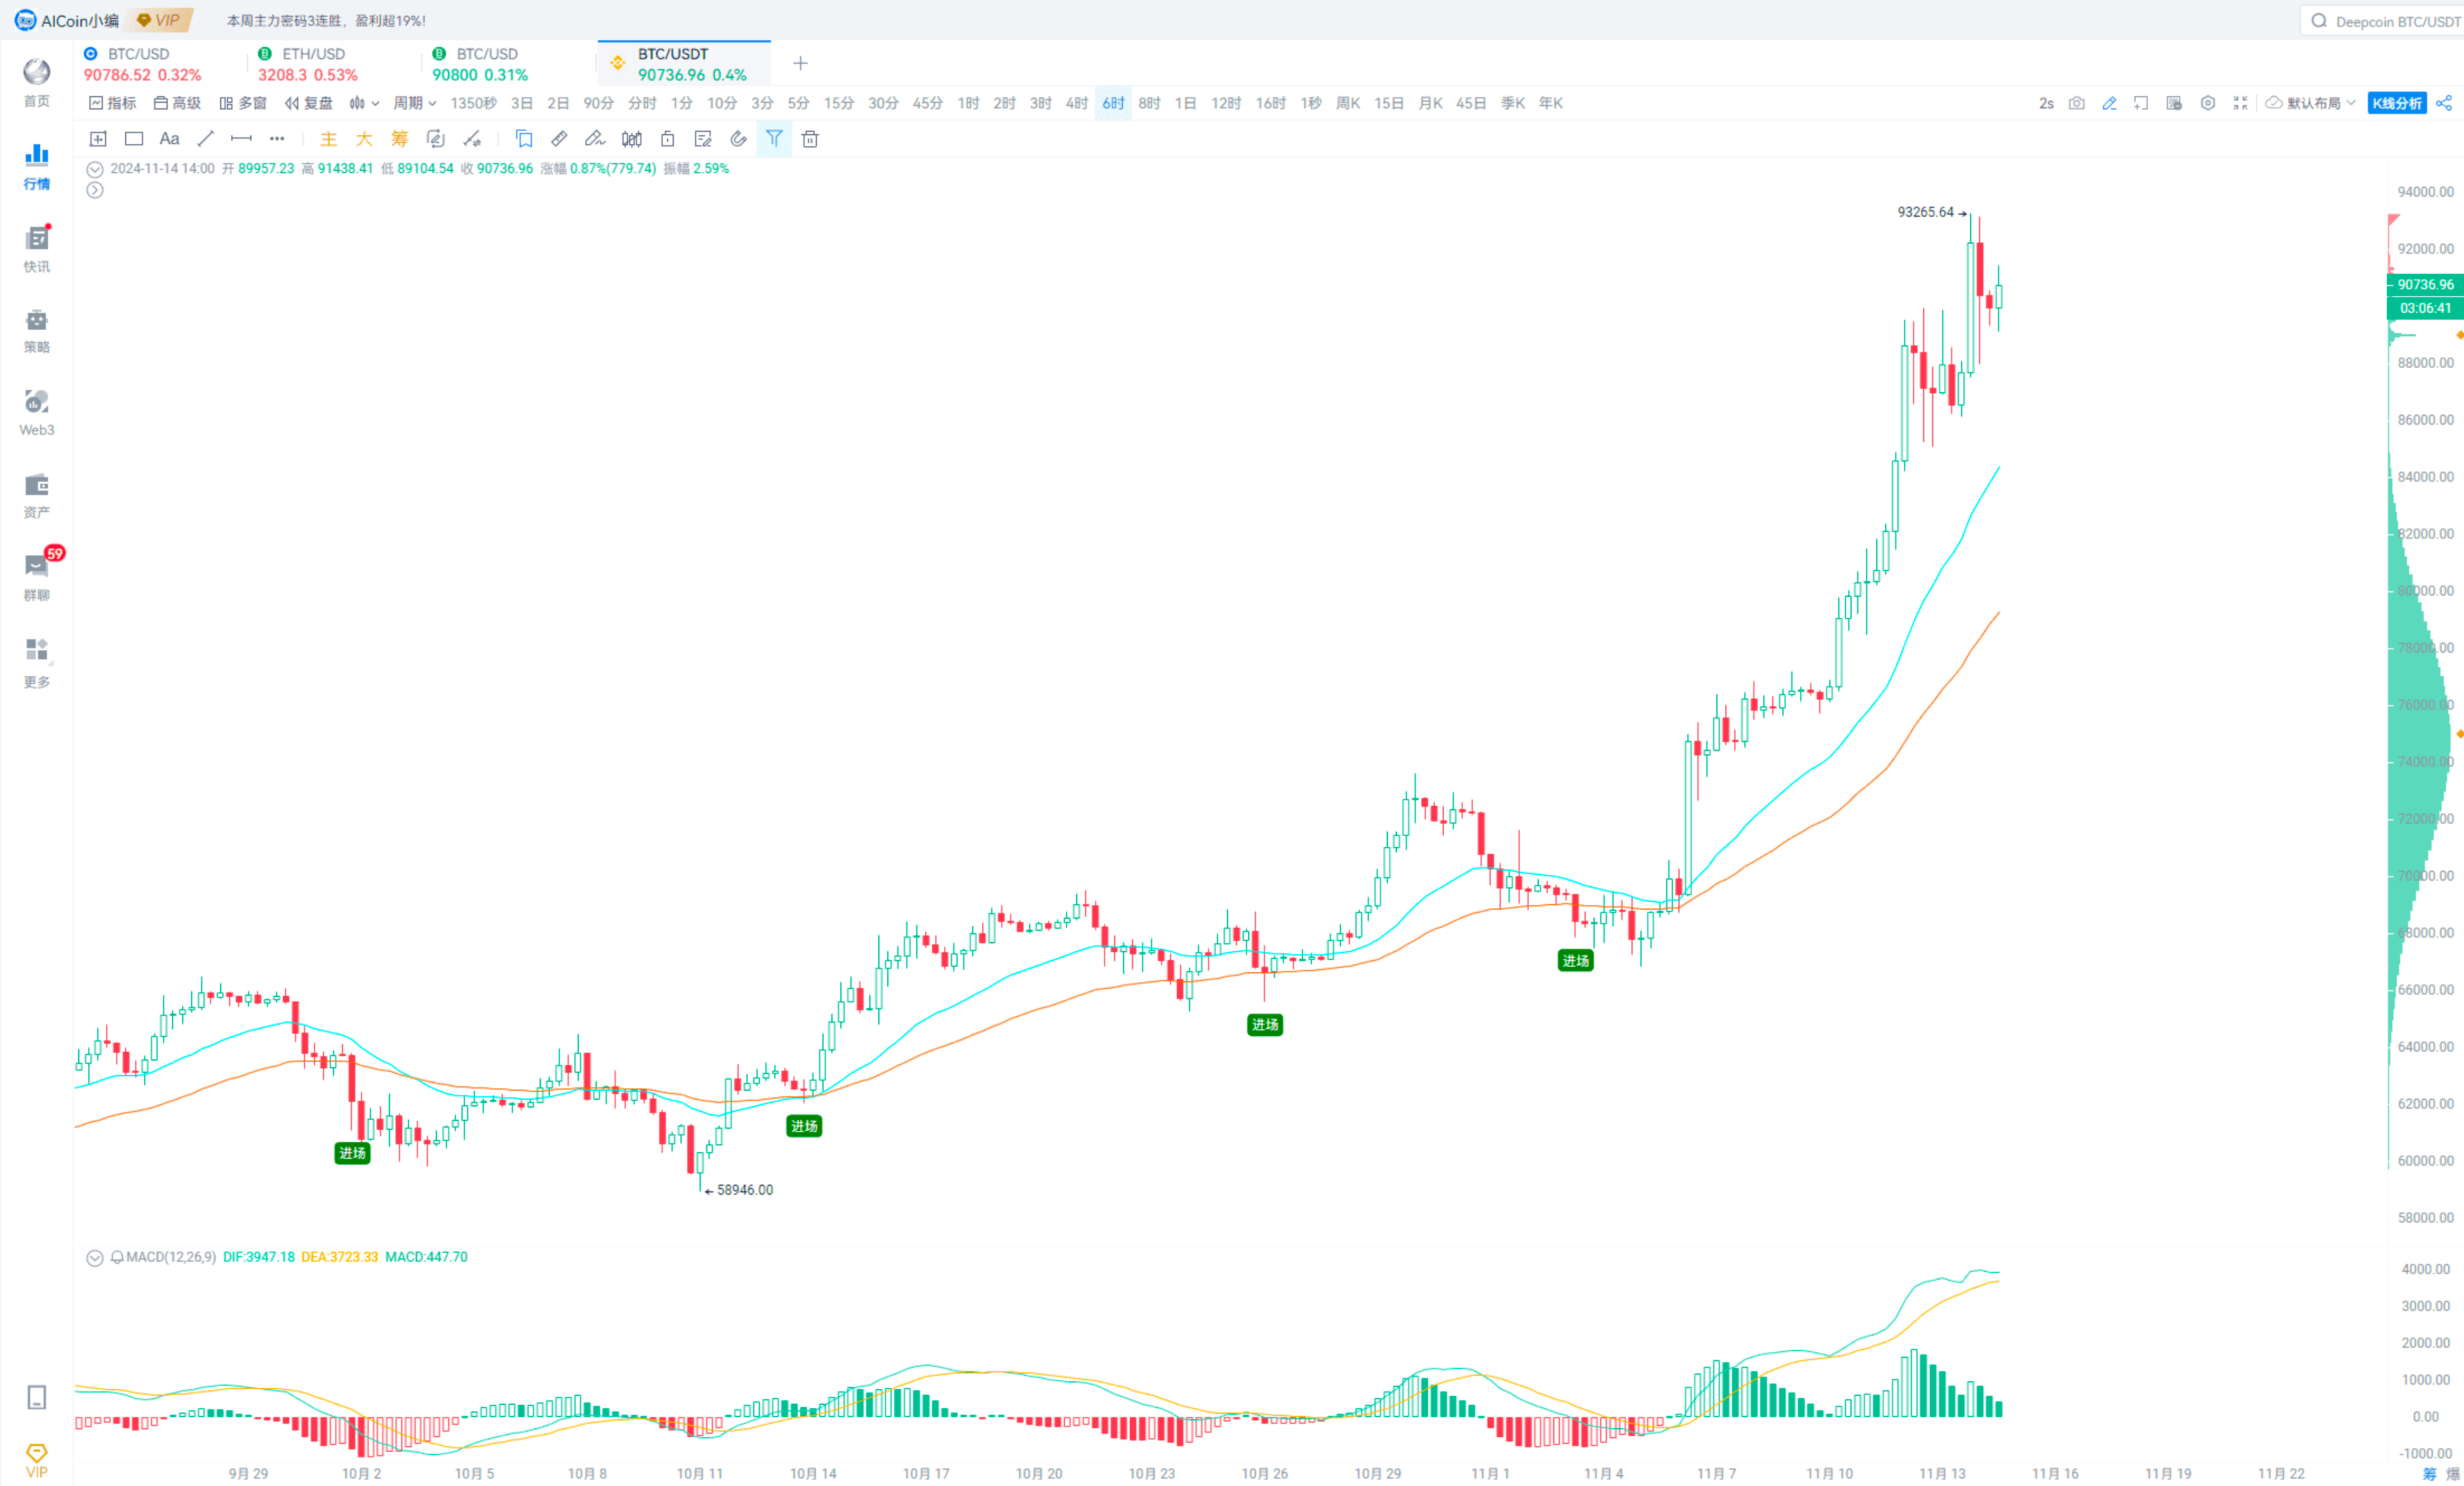
The image shows a simple example, but looking at historical signals, the performance is also very good.
A student in the live room also asked about WIN.
If WIN pulls back in a larger cycle but does not break the EMA52 moving average, or maintains above the EMA24, while the MACD fast and slow lines are infinitely close to the zero axis, it can be seen as an entry signal. 【However, specific judgments need to be made by you; I am only sharing methods.】
Using custom indicators for monitoring, you can easily grasp these signals.

Additionally, let's analyze a simple method for finding take-profit points after the price reaches a new high.
Just look at the large order positions, combined with the full depth chart, it becomes easier~
Just observe the points where the large order positions overlap with the order accumulation shown in the full depth, which indicates the positions where the main force is concentrating on selling/taking profit.
For example, in the current market, you can focus on the spot market, especially looking at Coinbase.
This is a screenshot from earlier on the 14th, where there are multiple large sell orders around 95,000, and there is also significant order accumulation, so it needs to be closely monitored.
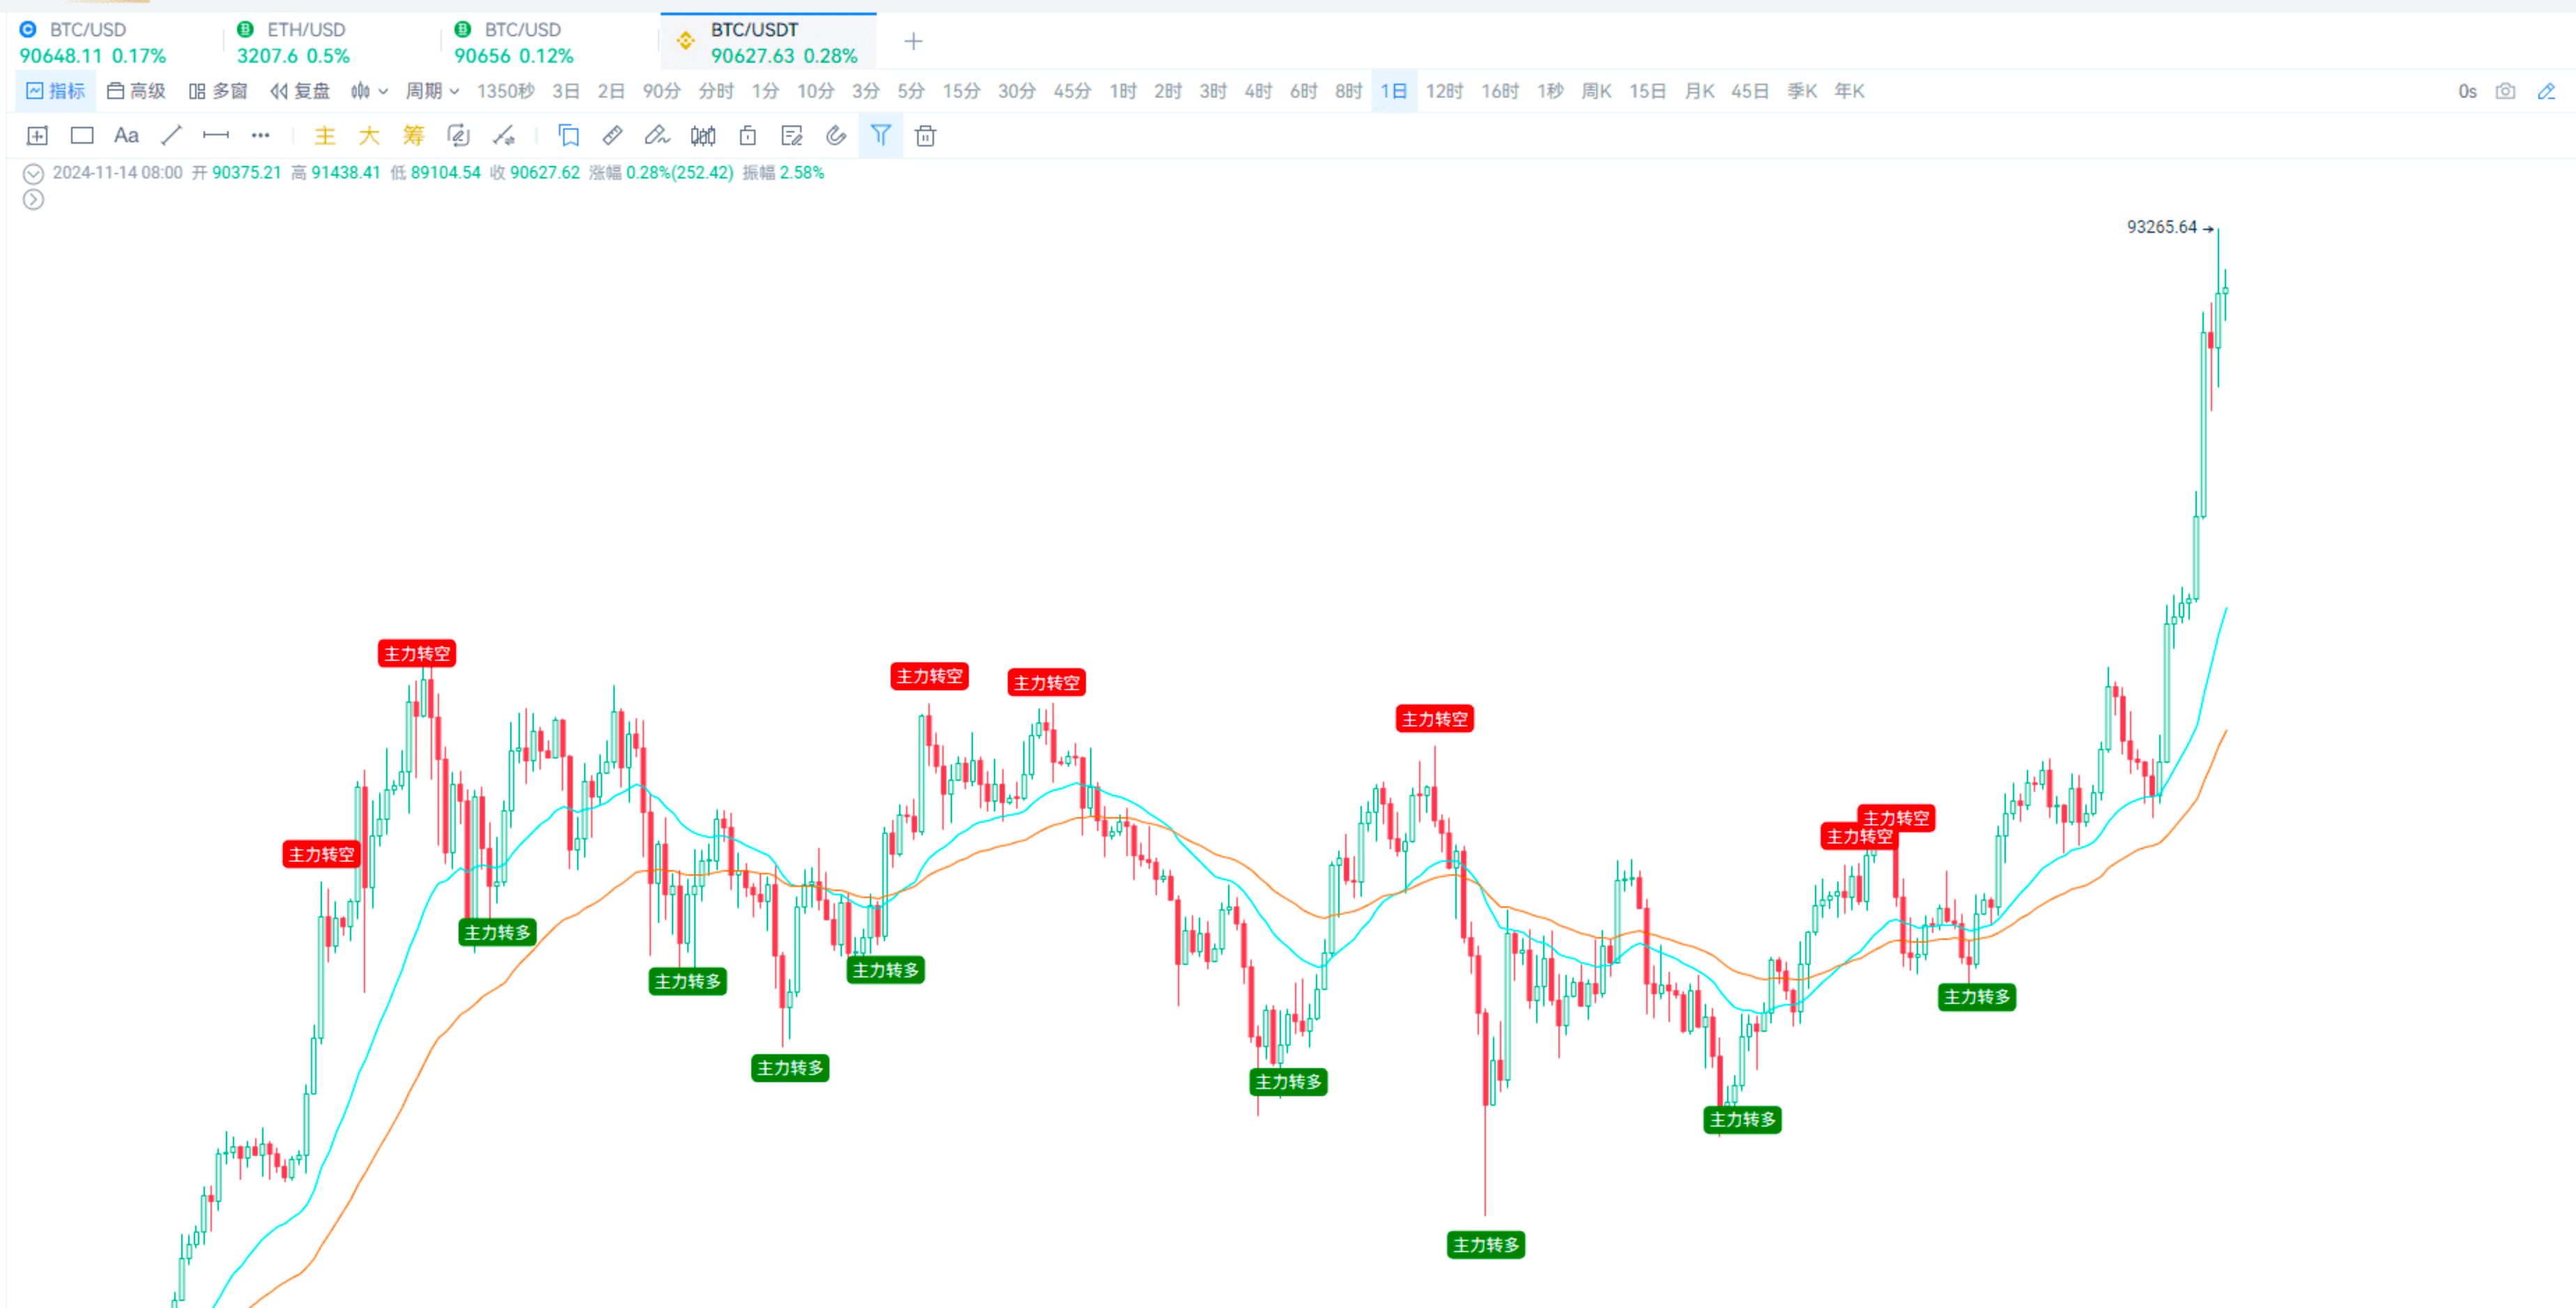
Method 5: Carving a Boat to Seek a Sword, Set Long and Short Position Ratio Thresholds
There is actually another method for the long and short position ratio, which is also carving a boat to seek a sword. Select a cycle, pull historical data, find high and low points and the corresponding ratio of positions, and then convert the numerical situation into an indicator.
For example, this is my daily level.
Summary:
Carving a boat to seek a sword, find consecutive bullish and bearish signals.
Gap patterns: Upward gaps indicate bullishness, downward gaps indicate bearishness.
Pullbacks that do not break the moving average indicate bullishness.
Price near the EMA52 moving average, while MACD fast and slow lines approach the zero axis.
Carving a boat to seek a sword, set long and short position ratio thresholds.
The above methods can basically be implemented using custom indicators.
Non-member friends can follow the tutorials provided by Yingying to operate and customize their own scripts.
Member friends can use our AI assistant to let the program write, or contact our customer service for assistance in writing.
This concludes the content of this sharing.
Thank you for watching, and we hope every AICoin user can find suitable indicator strategies and achieve financial success!
Recommended Reading
The Best Path to Quick Freedom in a Bull Market: Funding Fee Arbitrage
Decoding the Economic Trio: Interest Rates, CPI, and Non-Farm Payrolls!
For more live content, please follow the AICoin "AICoin - Leading Data Market and Smart Tools Platform" section, and feel free to download AICoin - Leading Data Market and Smart Tools Platform.
免责声明:本文章仅代表作者个人观点,不代表本平台的立场和观点。本文章仅供信息分享,不构成对任何人的任何投资建议。用户与作者之间的任何争议,与本平台无关。如网页中刊载的文章或图片涉及侵权,请提供相关的权利证明和身份证明发送邮件到support@aicoin.com,本平台相关工作人员将会进行核查。


