On December 23 at 16:00, the AICoin editor conducted a graphic and text sharing session on the topic of 【Excellent Bottom-Fishing Secrets】. Below is a summary of the live broadcast content.
Before sharing the key insights, let’s discuss a few news updates.
First, on Christmas, the US stock market will be closed on Tuesday and Wednesday, which will reduce liquidity in the US market. Pay attention to the Asian market trends.
Second, at 21:00 tonight, keep an eye on our news updates. MicroStrategy may announce an increase in holdings again. If there is indeed an increase, it is likely to trigger a relatively rapid market movement. Additionally, MicroStrategy's stock MSTR will officially be included in the Nasdaq 100, which is also worth watching.
Third, in early January next year, FTX is set to make payments, which may bring about $15 billion in stablecoin liquidity.
Fourth, Trump will move into the White House on January 20 next year.
These news items may impact the market, so they should be closely monitored.
The main focus is on speculative expectations, especially regarding Trump's inauguration. There will be an oath-taking ceremony, and even if he just mentions Bitcoin, it is likely to drive prices up. However, one point to note is that market risk aversion has increased, and this year we have seen many instances of "good news leading to bad outcomes." Therefore, it is not ruled out that there may be a wave of selling after Trump takes office!
Some friends in the comments mentioned that interest rate cuts are the best example. Initially, the expectations for rate cuts were very positive; as long as the Federal Reserve continues to inject liquidity, funds would flow in. But now, the expectations for rate cuts have changed, and Powell is causing disturbances, leading to a drop in Bitcoin.
I just wanted you to pay attention to these events; I’m not giving any directional advice.
That’s all for the news updates; now let’s move on to the key insights!
First tool: AI Grid
For those interested in grid trading, here’s a winning strategy:
After a surge: Set up a short grid to capture price pullback opportunities;
After a drop: Start a long grid to strategically buy at lows;
In a volatile market: Deploy a neutral grid, short at highs/close longs, and close shorts/buy at lows.
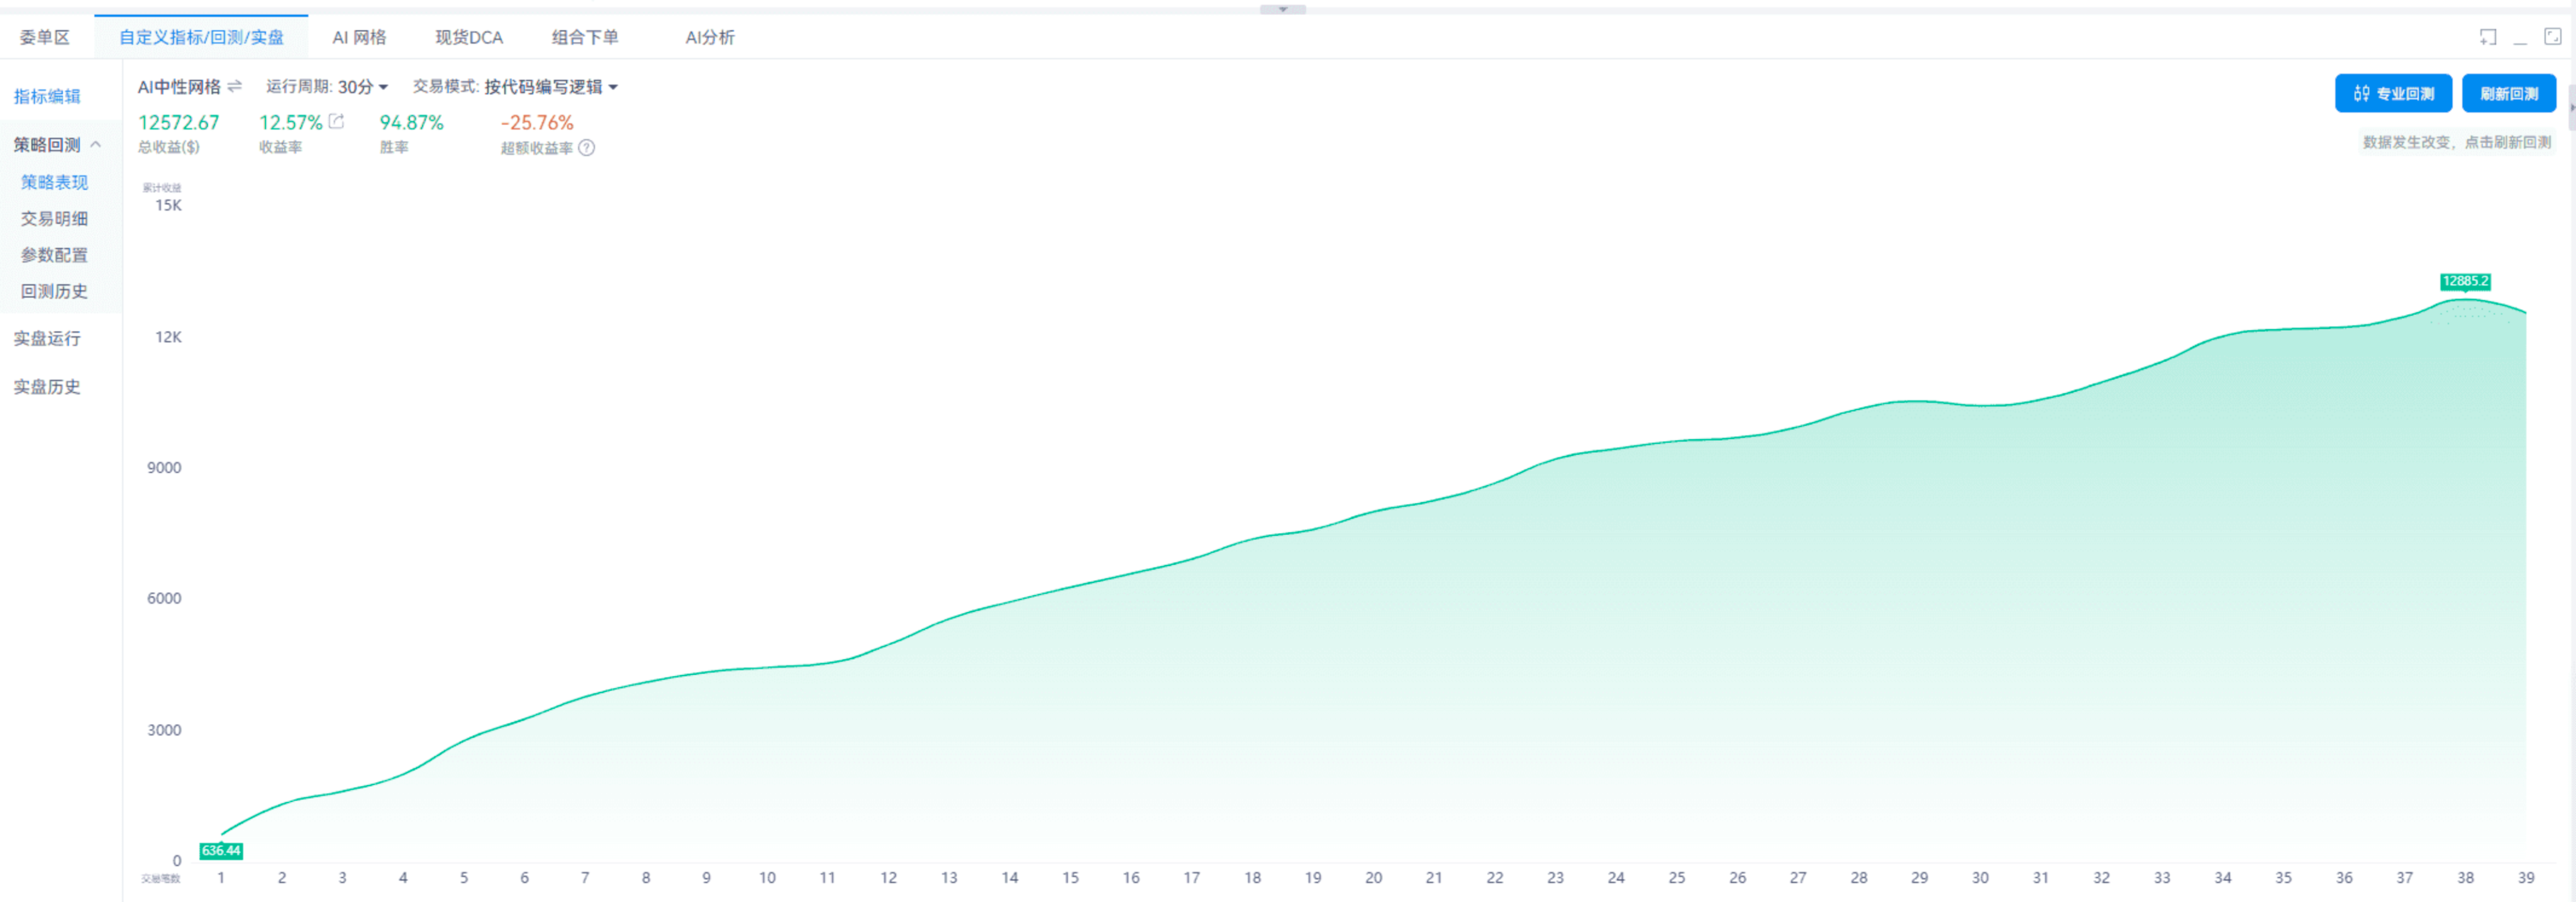
Grids can be backtested with custom indicators for win rates.
For example, see the screenshot:
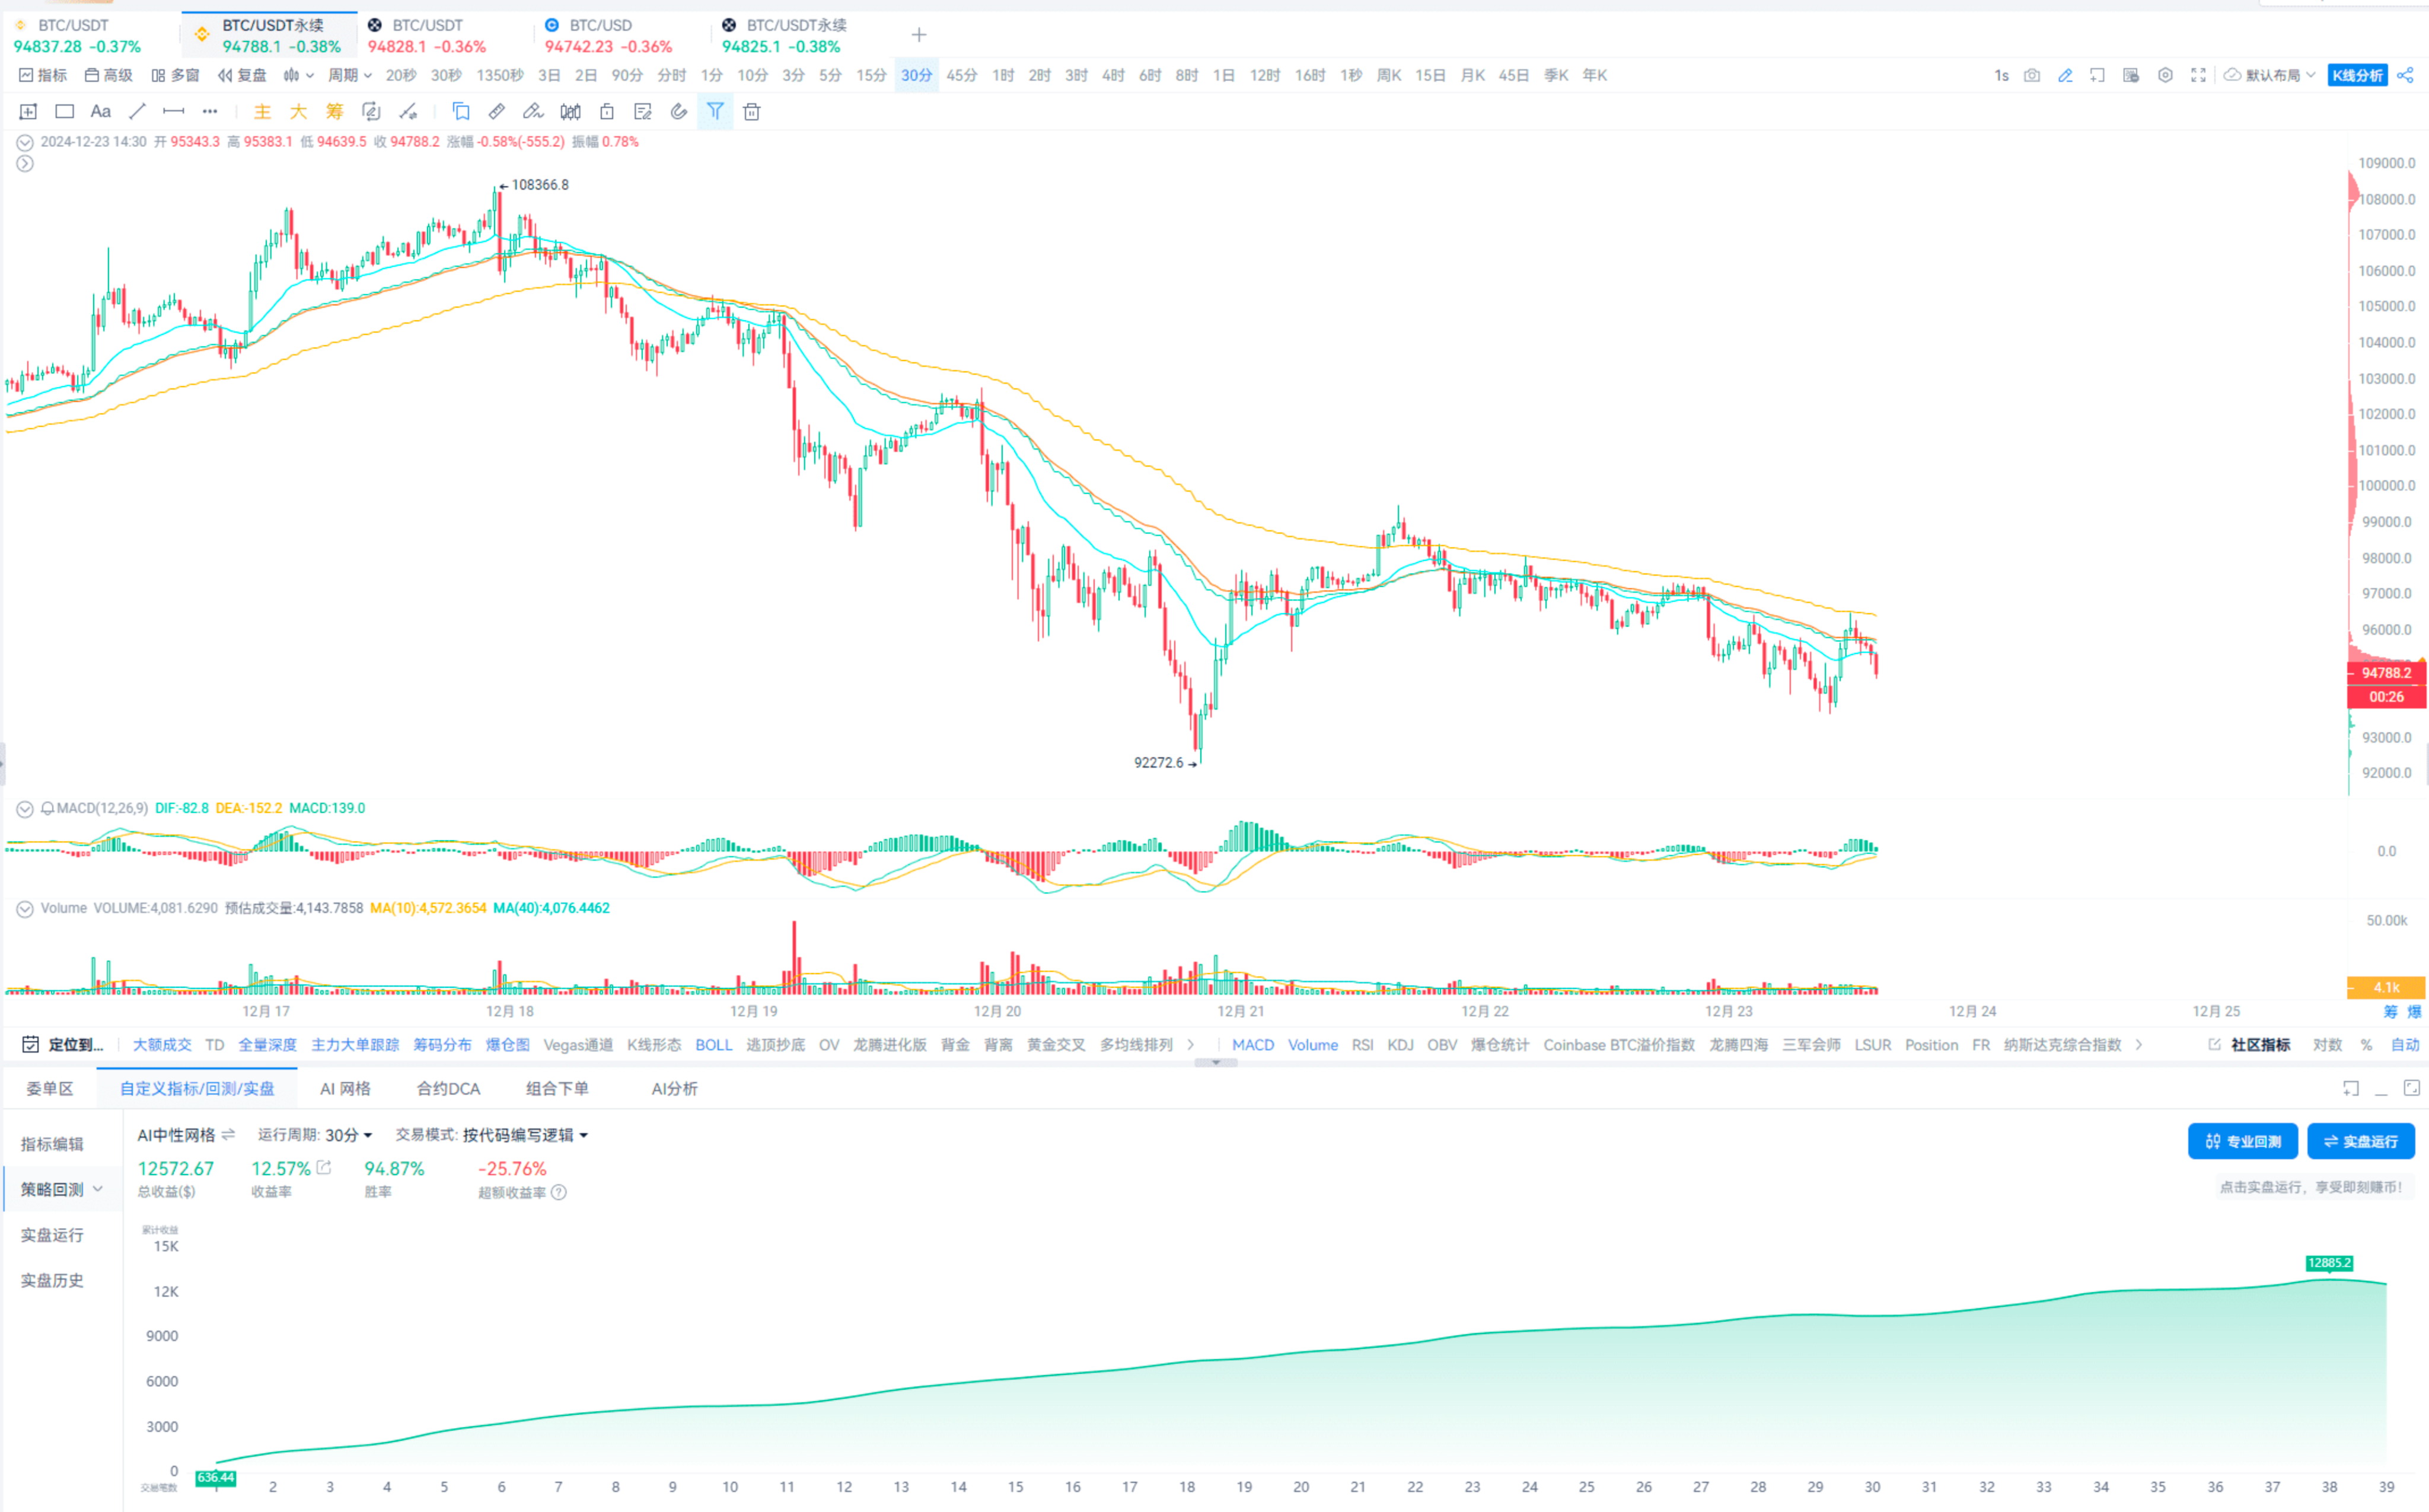
This is a neutral grid, in the range of 92,000~108,000, with 20 grids (10 grids up and down).
If you’re unsure how to set it up, you can directly use our backtested strategies; you just need to invest the amount to run it.
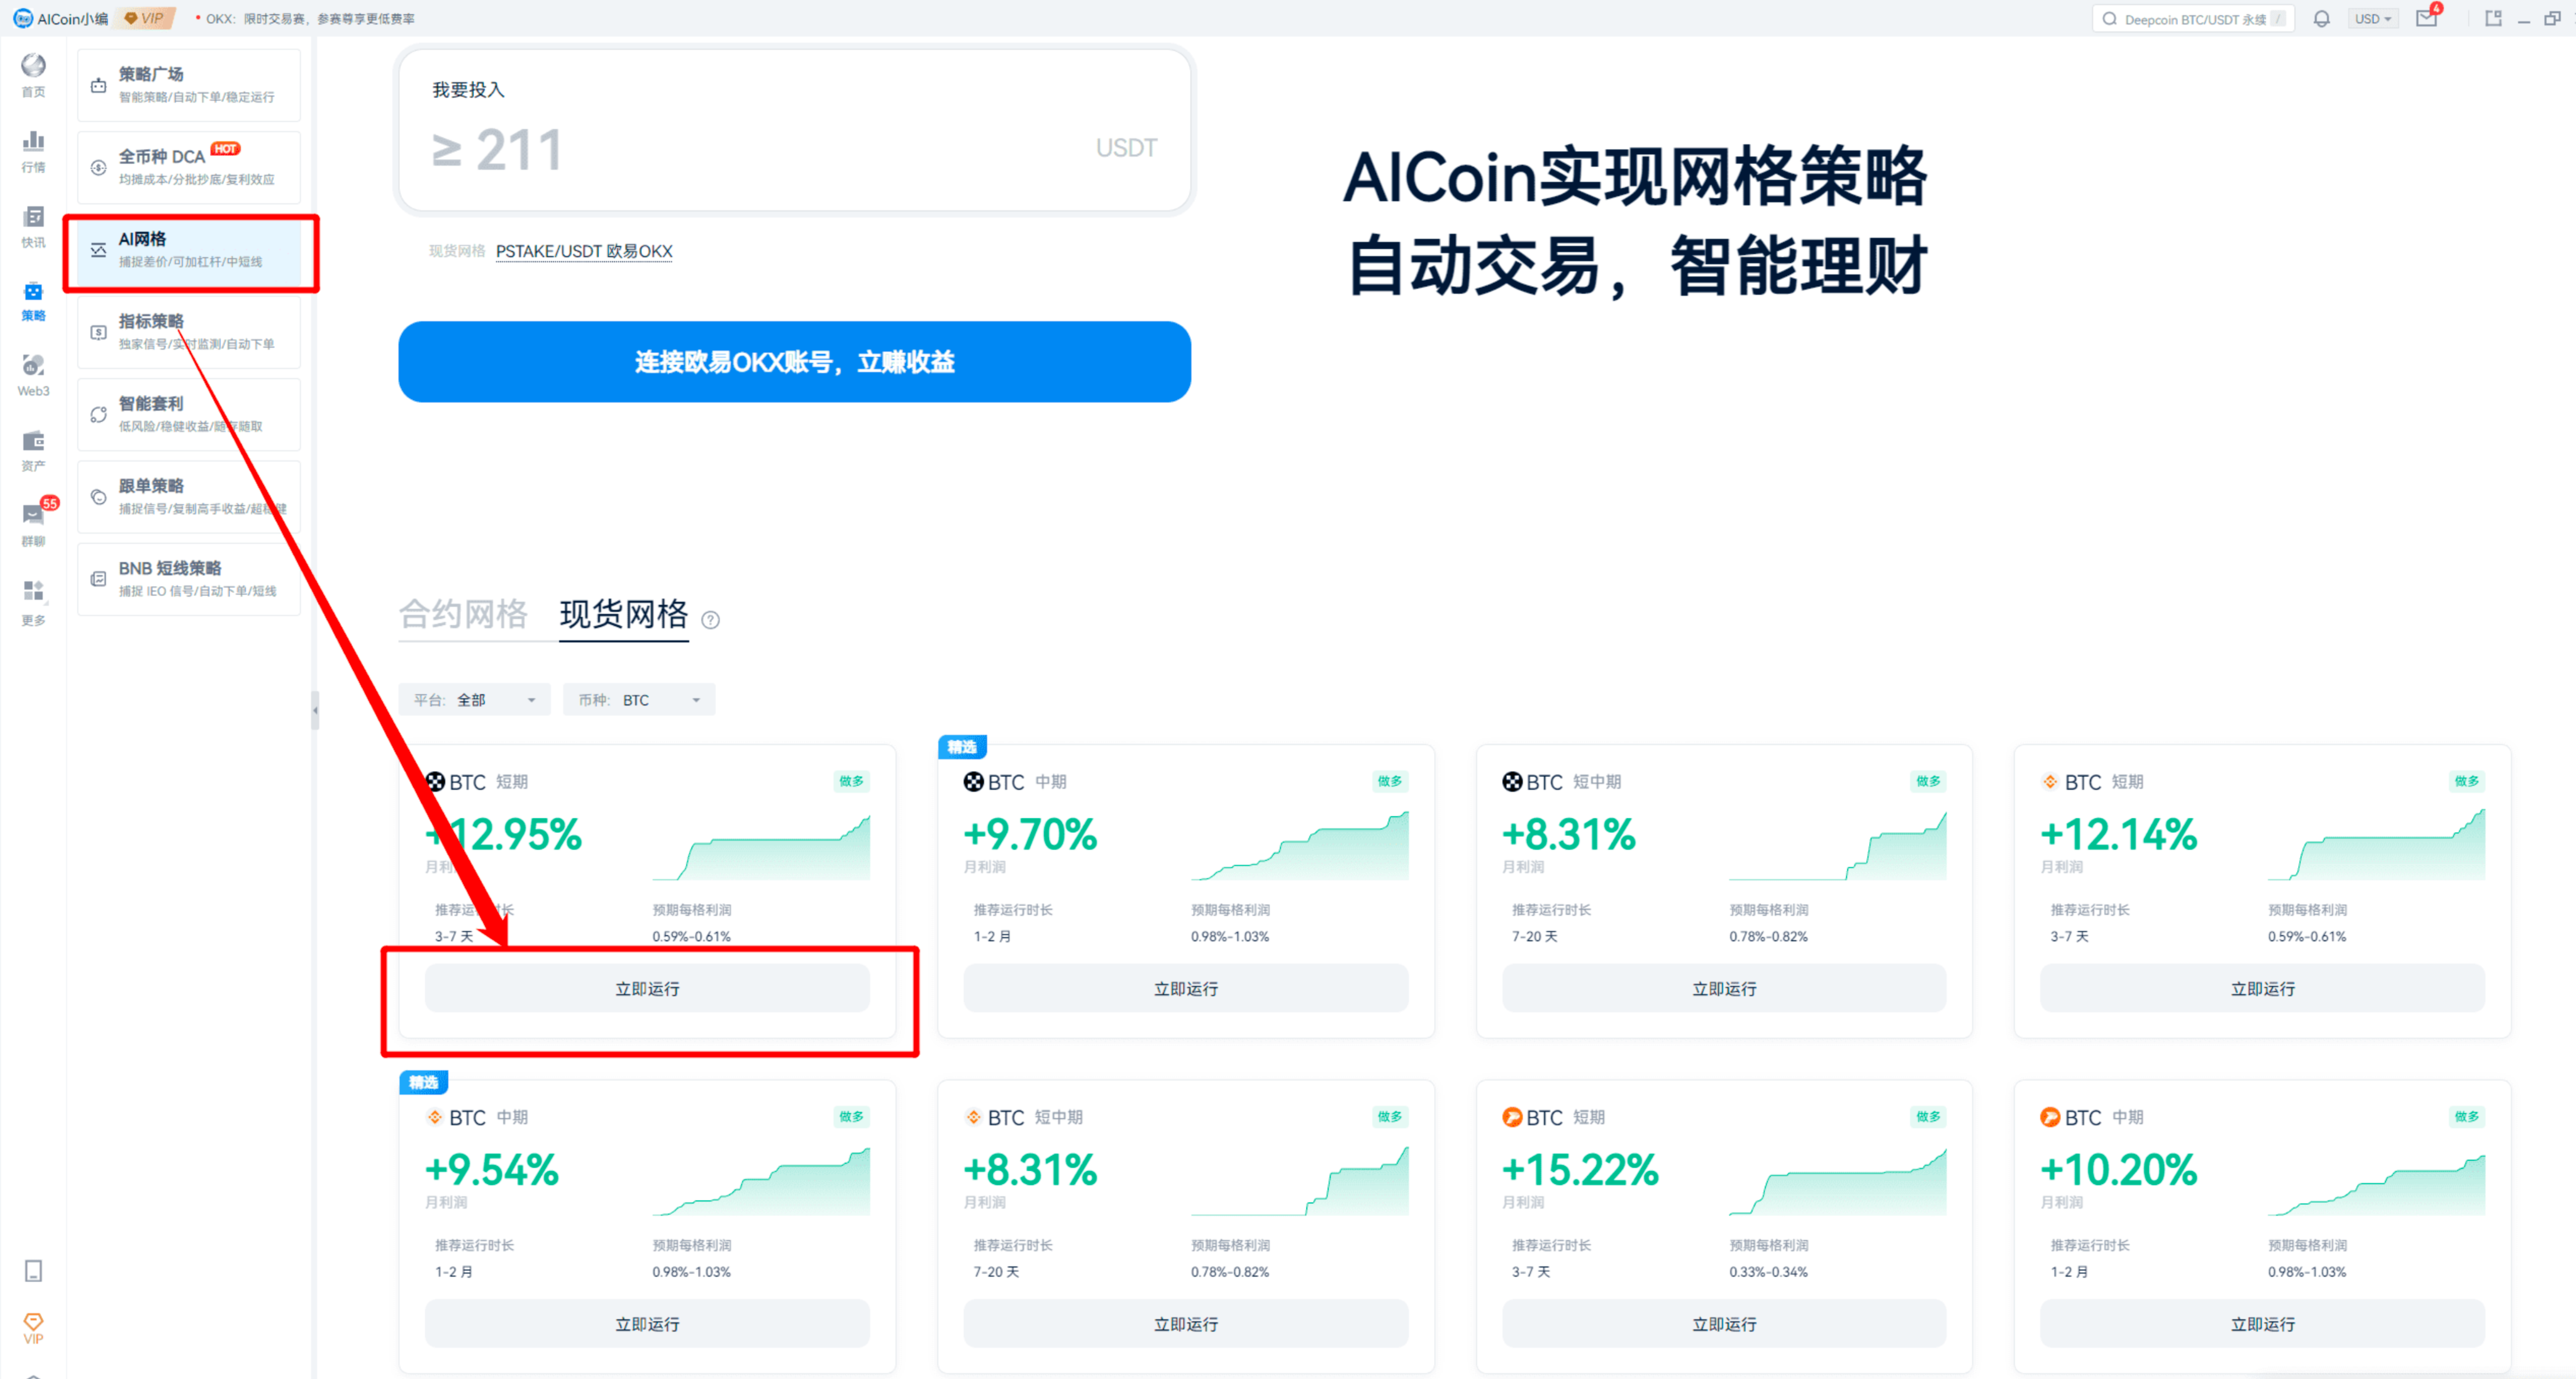
For those seeking stability, stick to spot trading, but make sure to set take-profit and stop-loss levels!!!
You can refer to this article for related strategies, which includes some tips on how to set up grids: https://www.aicoin.com/zh-Hans/article/420406
For setting take-profit and stop-loss, see the image.
Next, let’s share some key insights!
Tip 1: Topping Out Technique
I personally find large orders particularly interesting, especially large orders on Binance, Coinbase, and OKX.
Look at the order book.
Before large sell orders are filled, it indicates bullish sentiment; after they are filled, it indicates bearish sentiment.
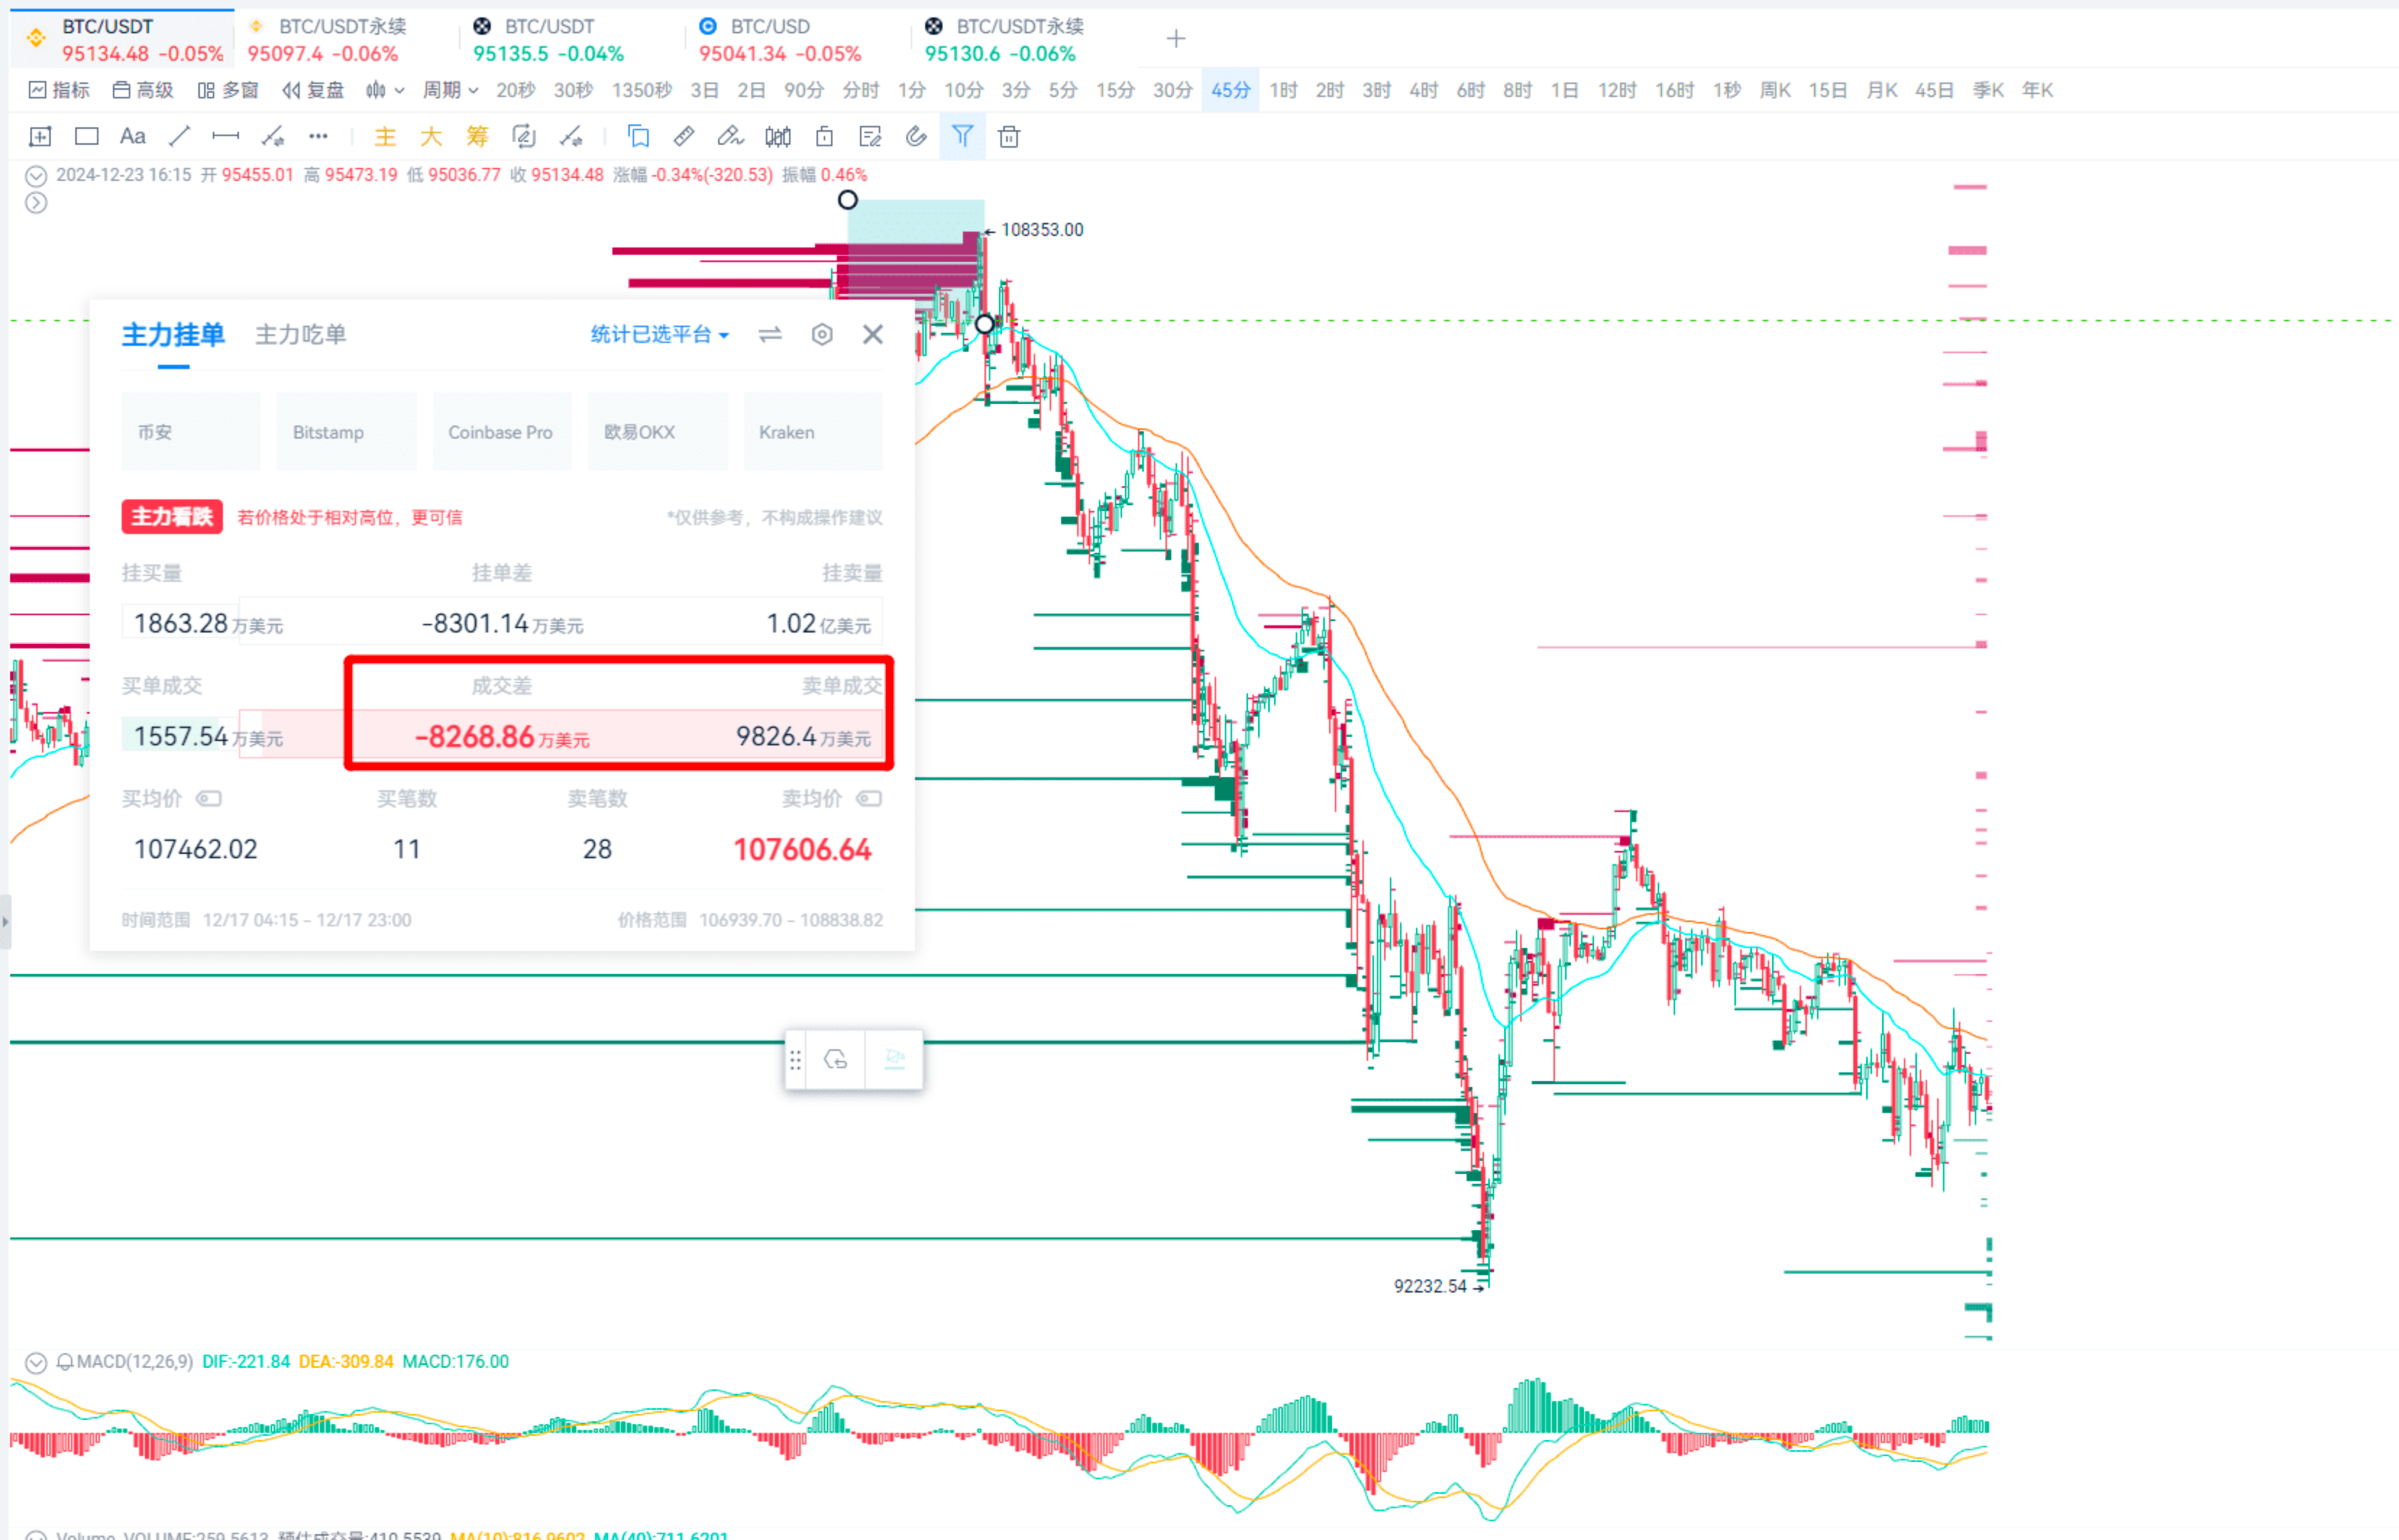
Recently, I have been focusing on spot trading.
Similarly, for large buy orders: before they are filled, it indicates bearish sentiment; after they are filled, it indicates bullish sentiment.
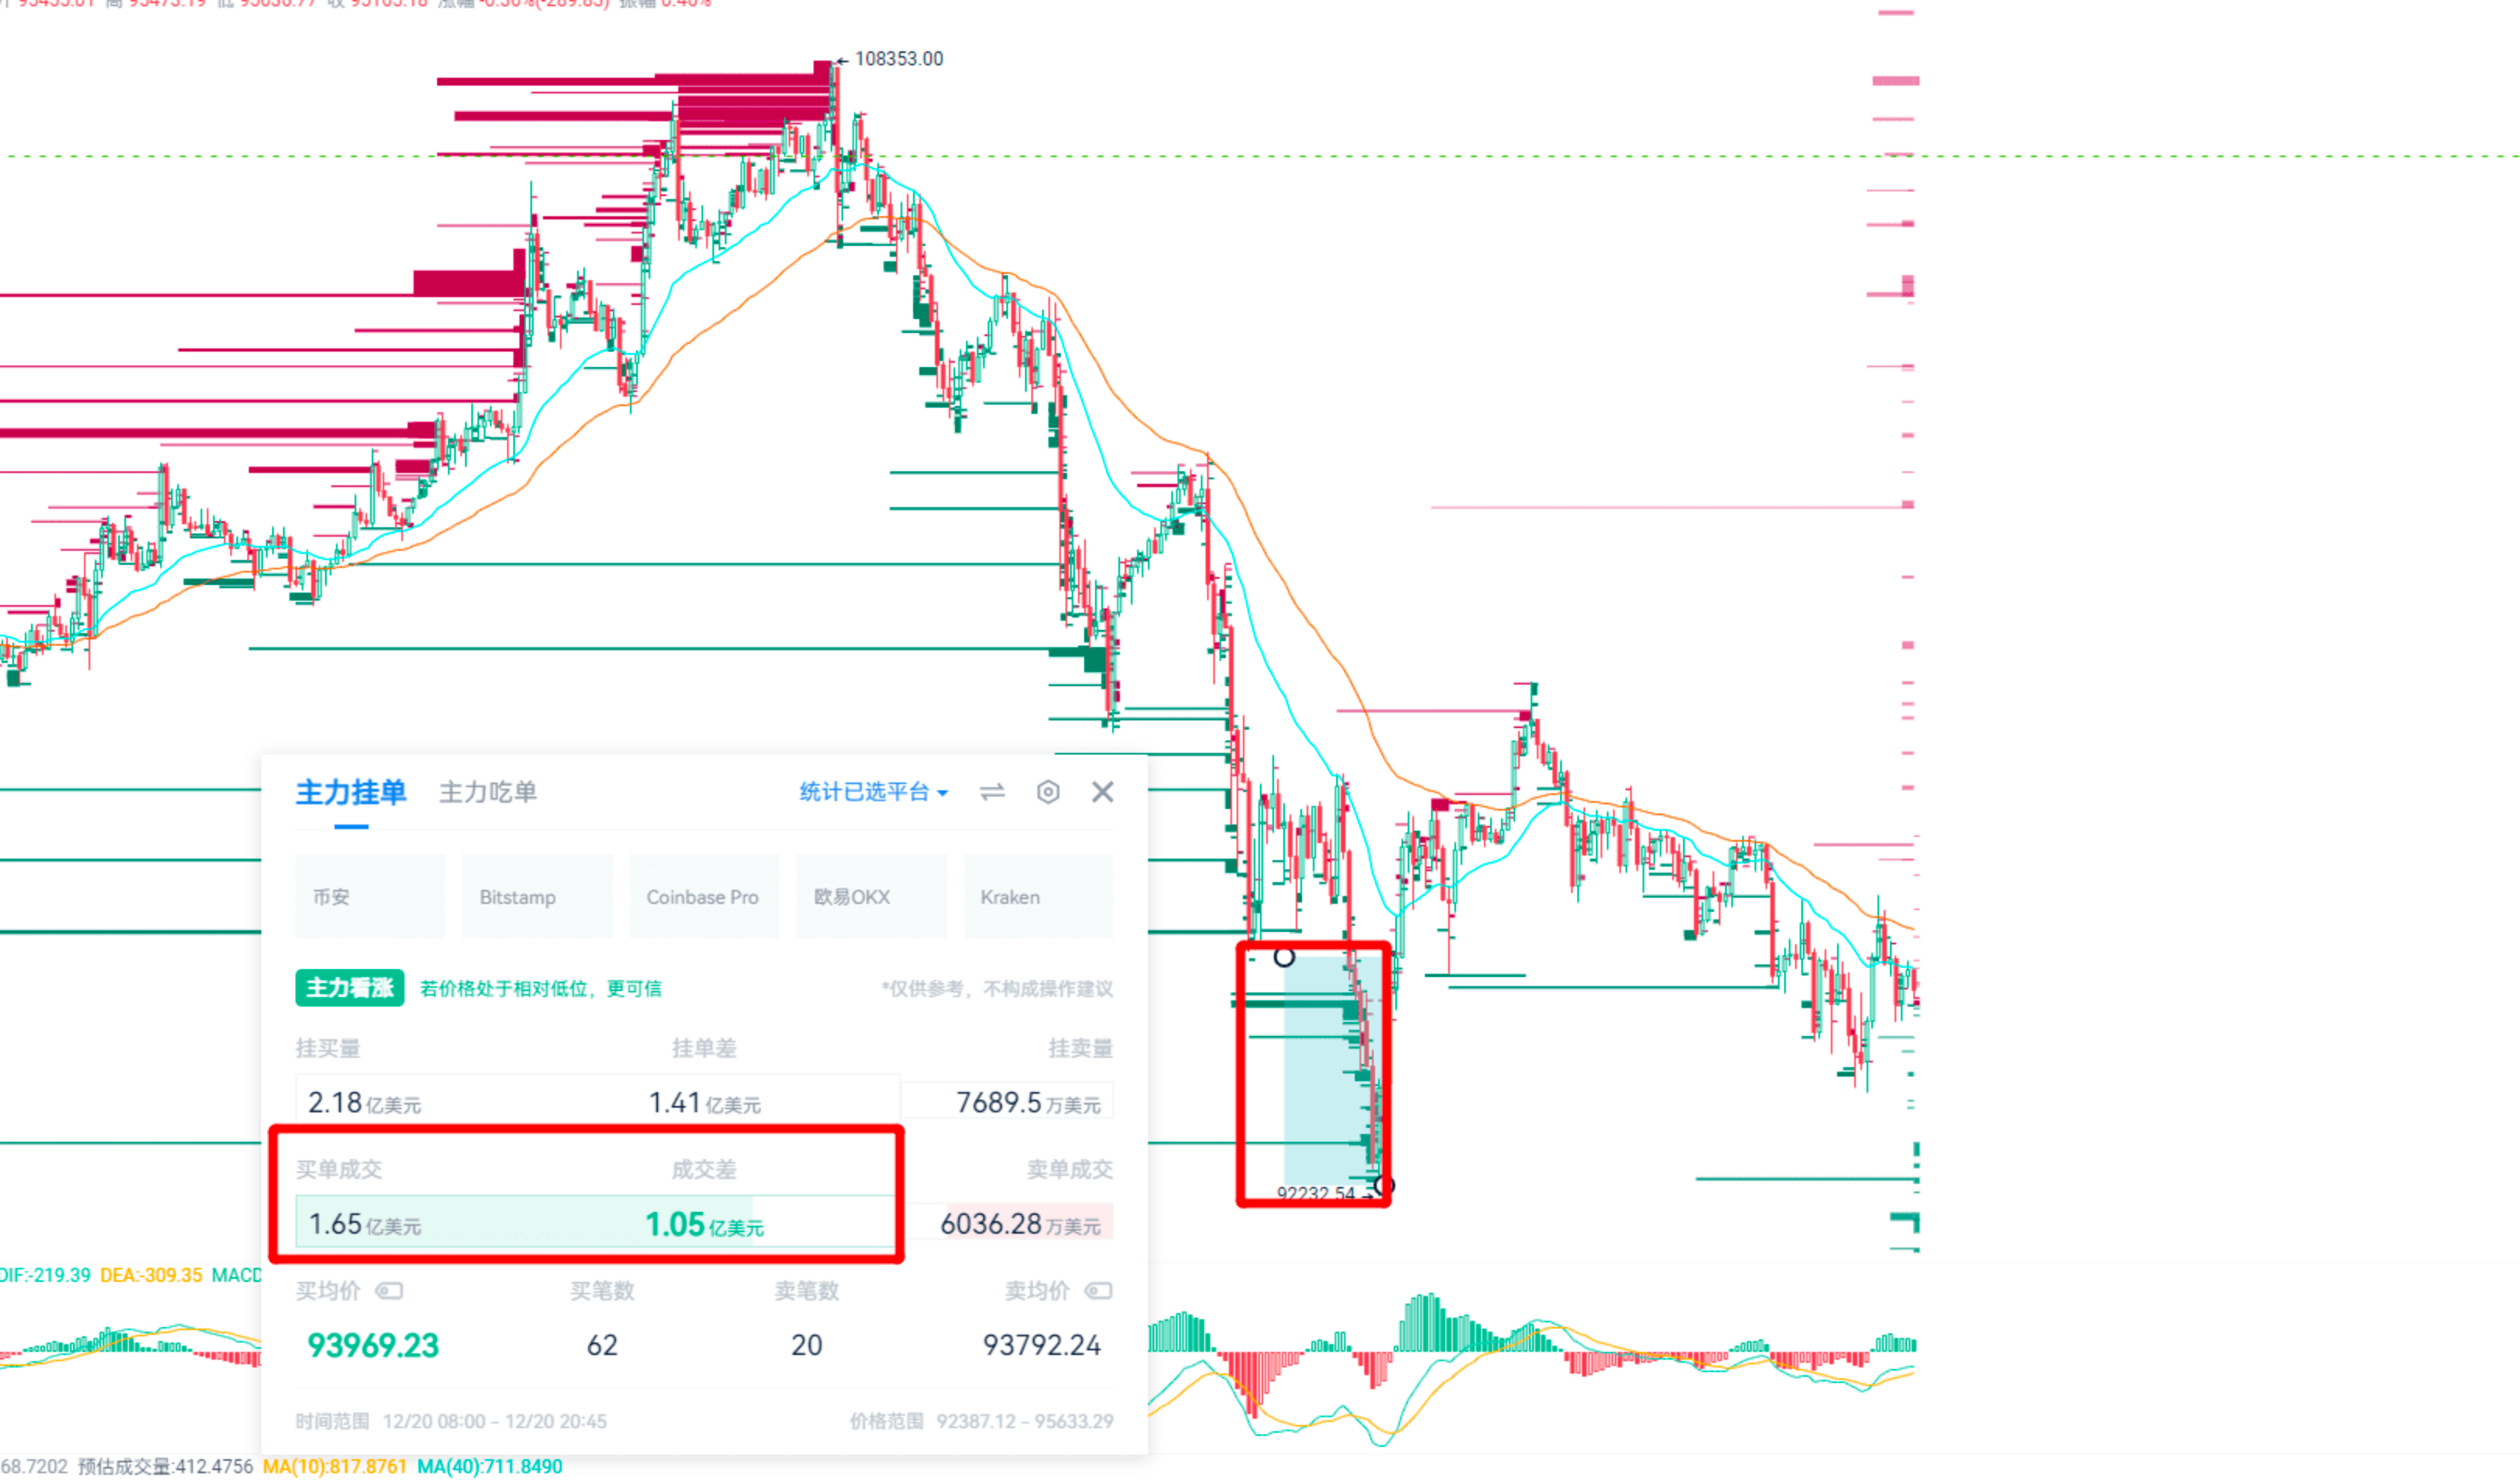
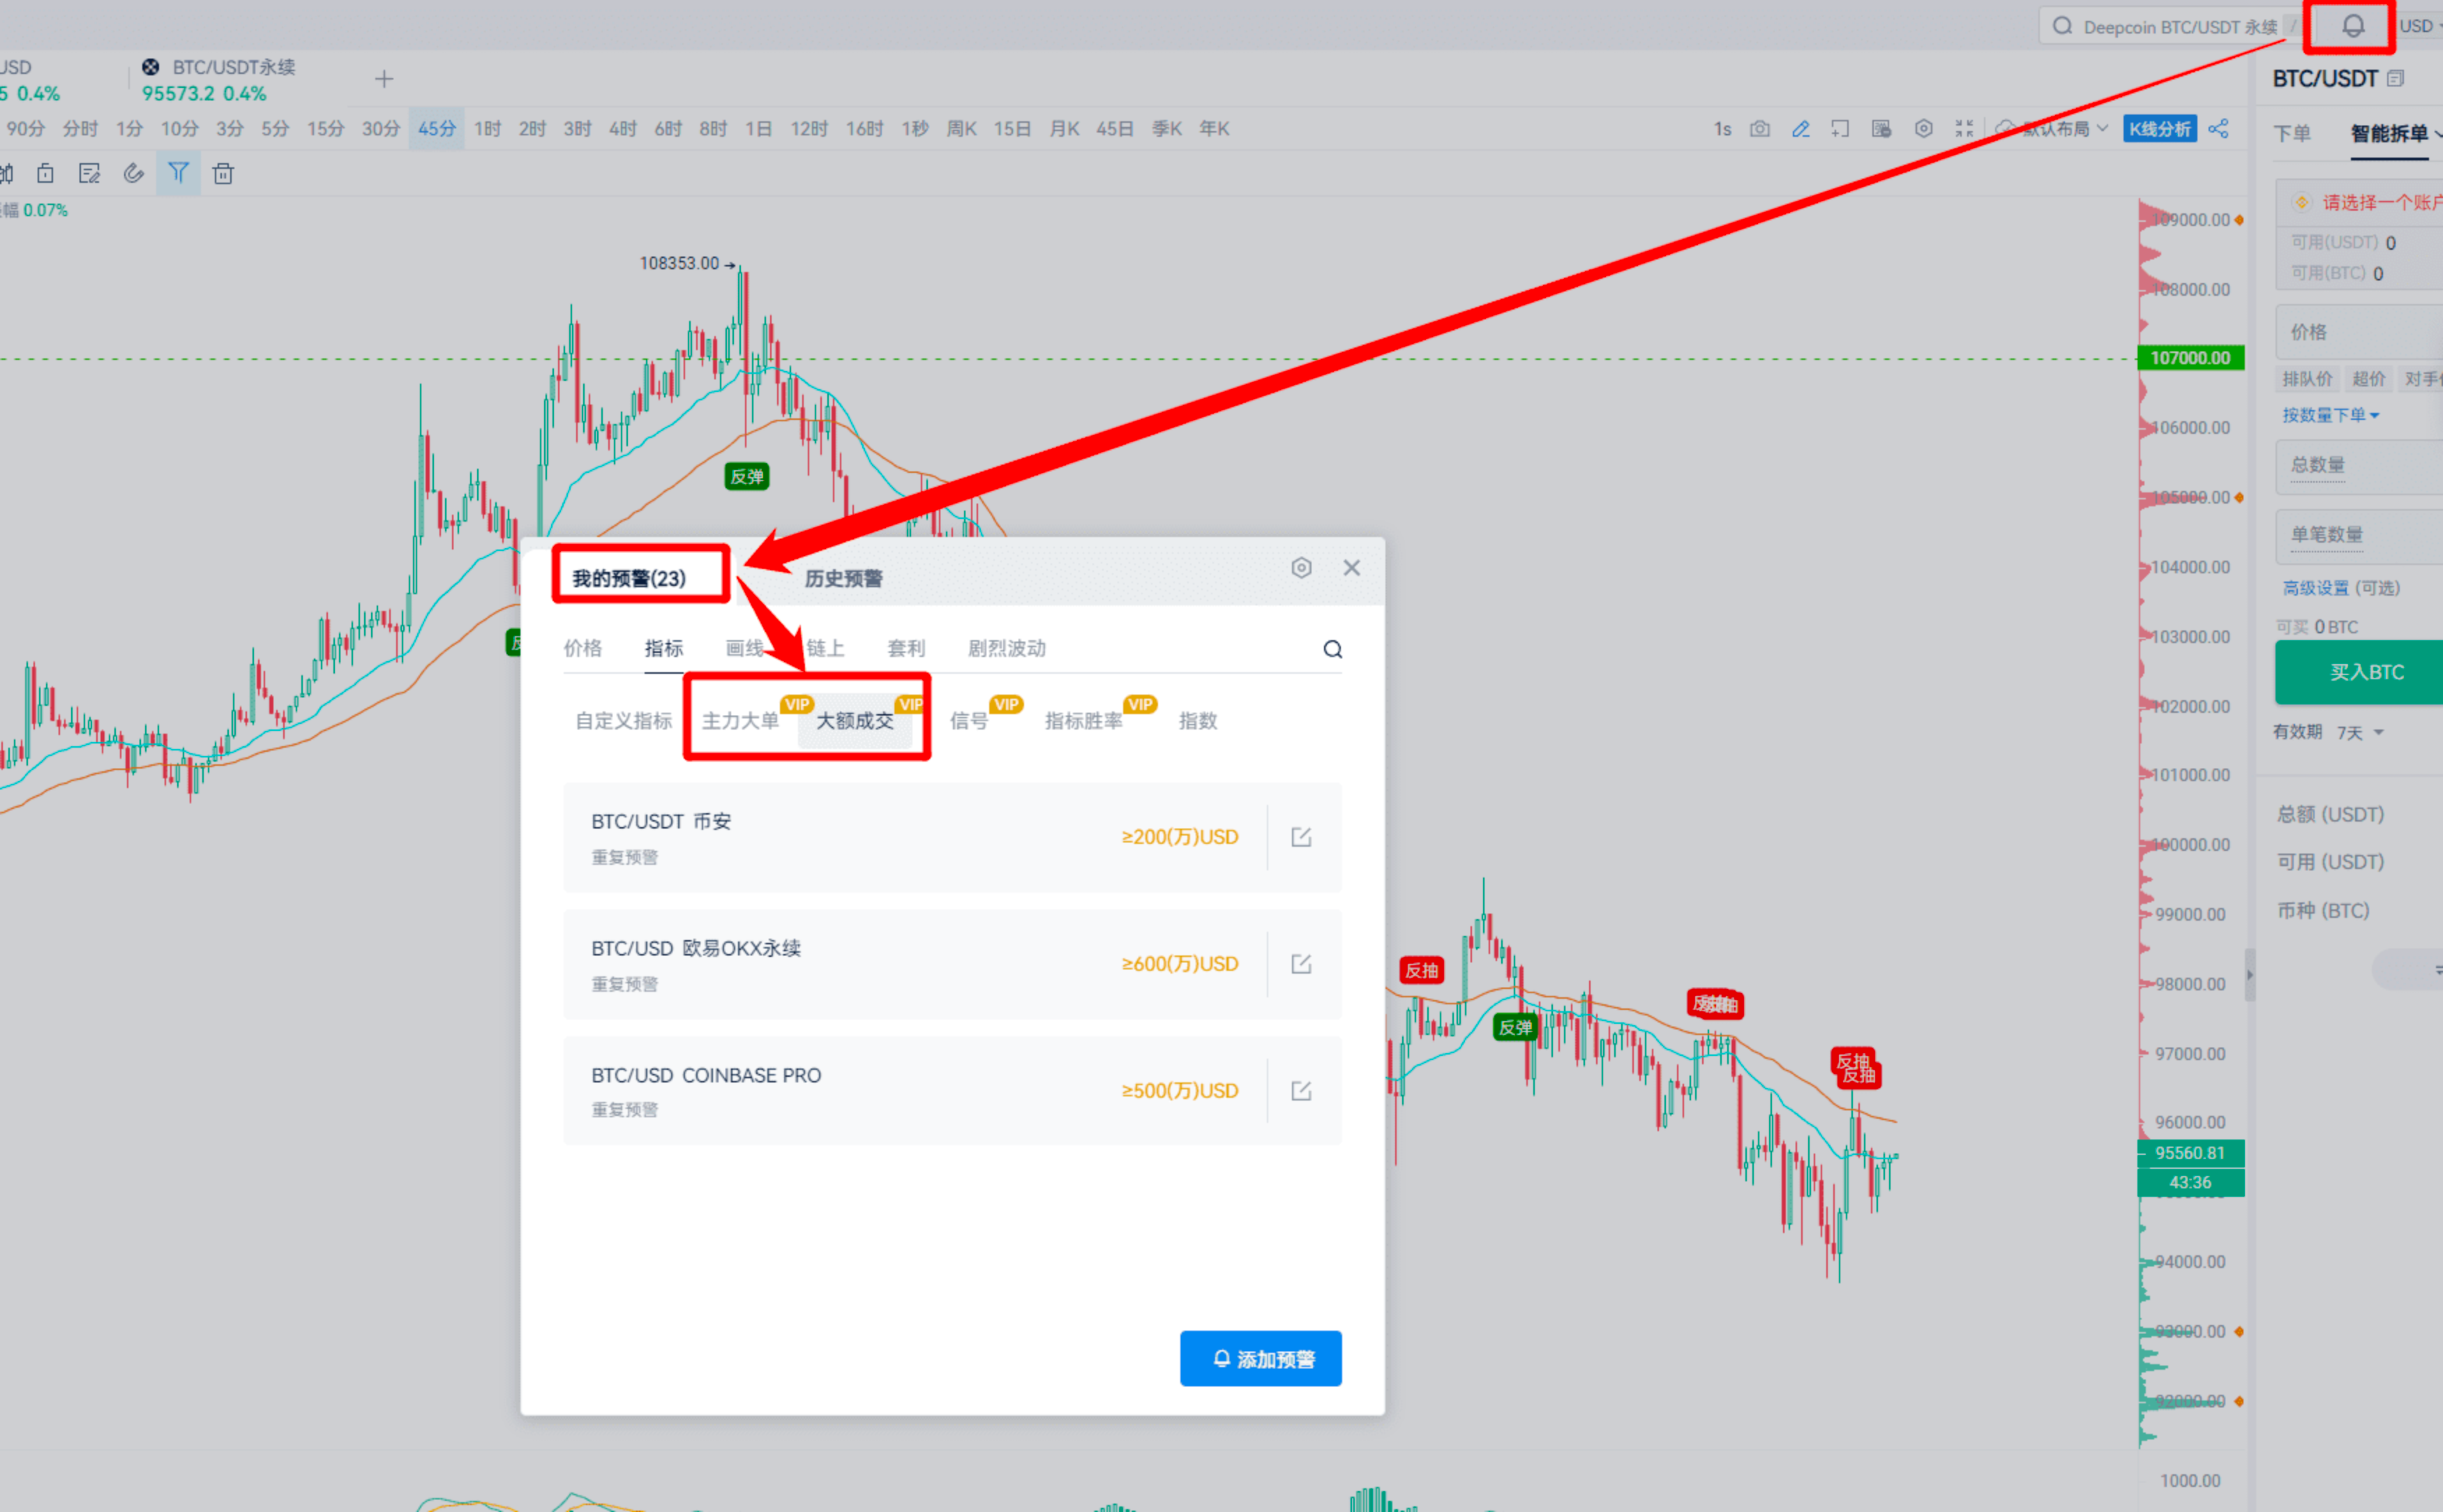
Another topping out technique is to watch for large transactions, mainly to see if big players are selling off.
Large players sell at market prices, so we need to monitor large transactions. Large transactions track the market activity of big players; red indicates sell orders, and green indicates buy orders.
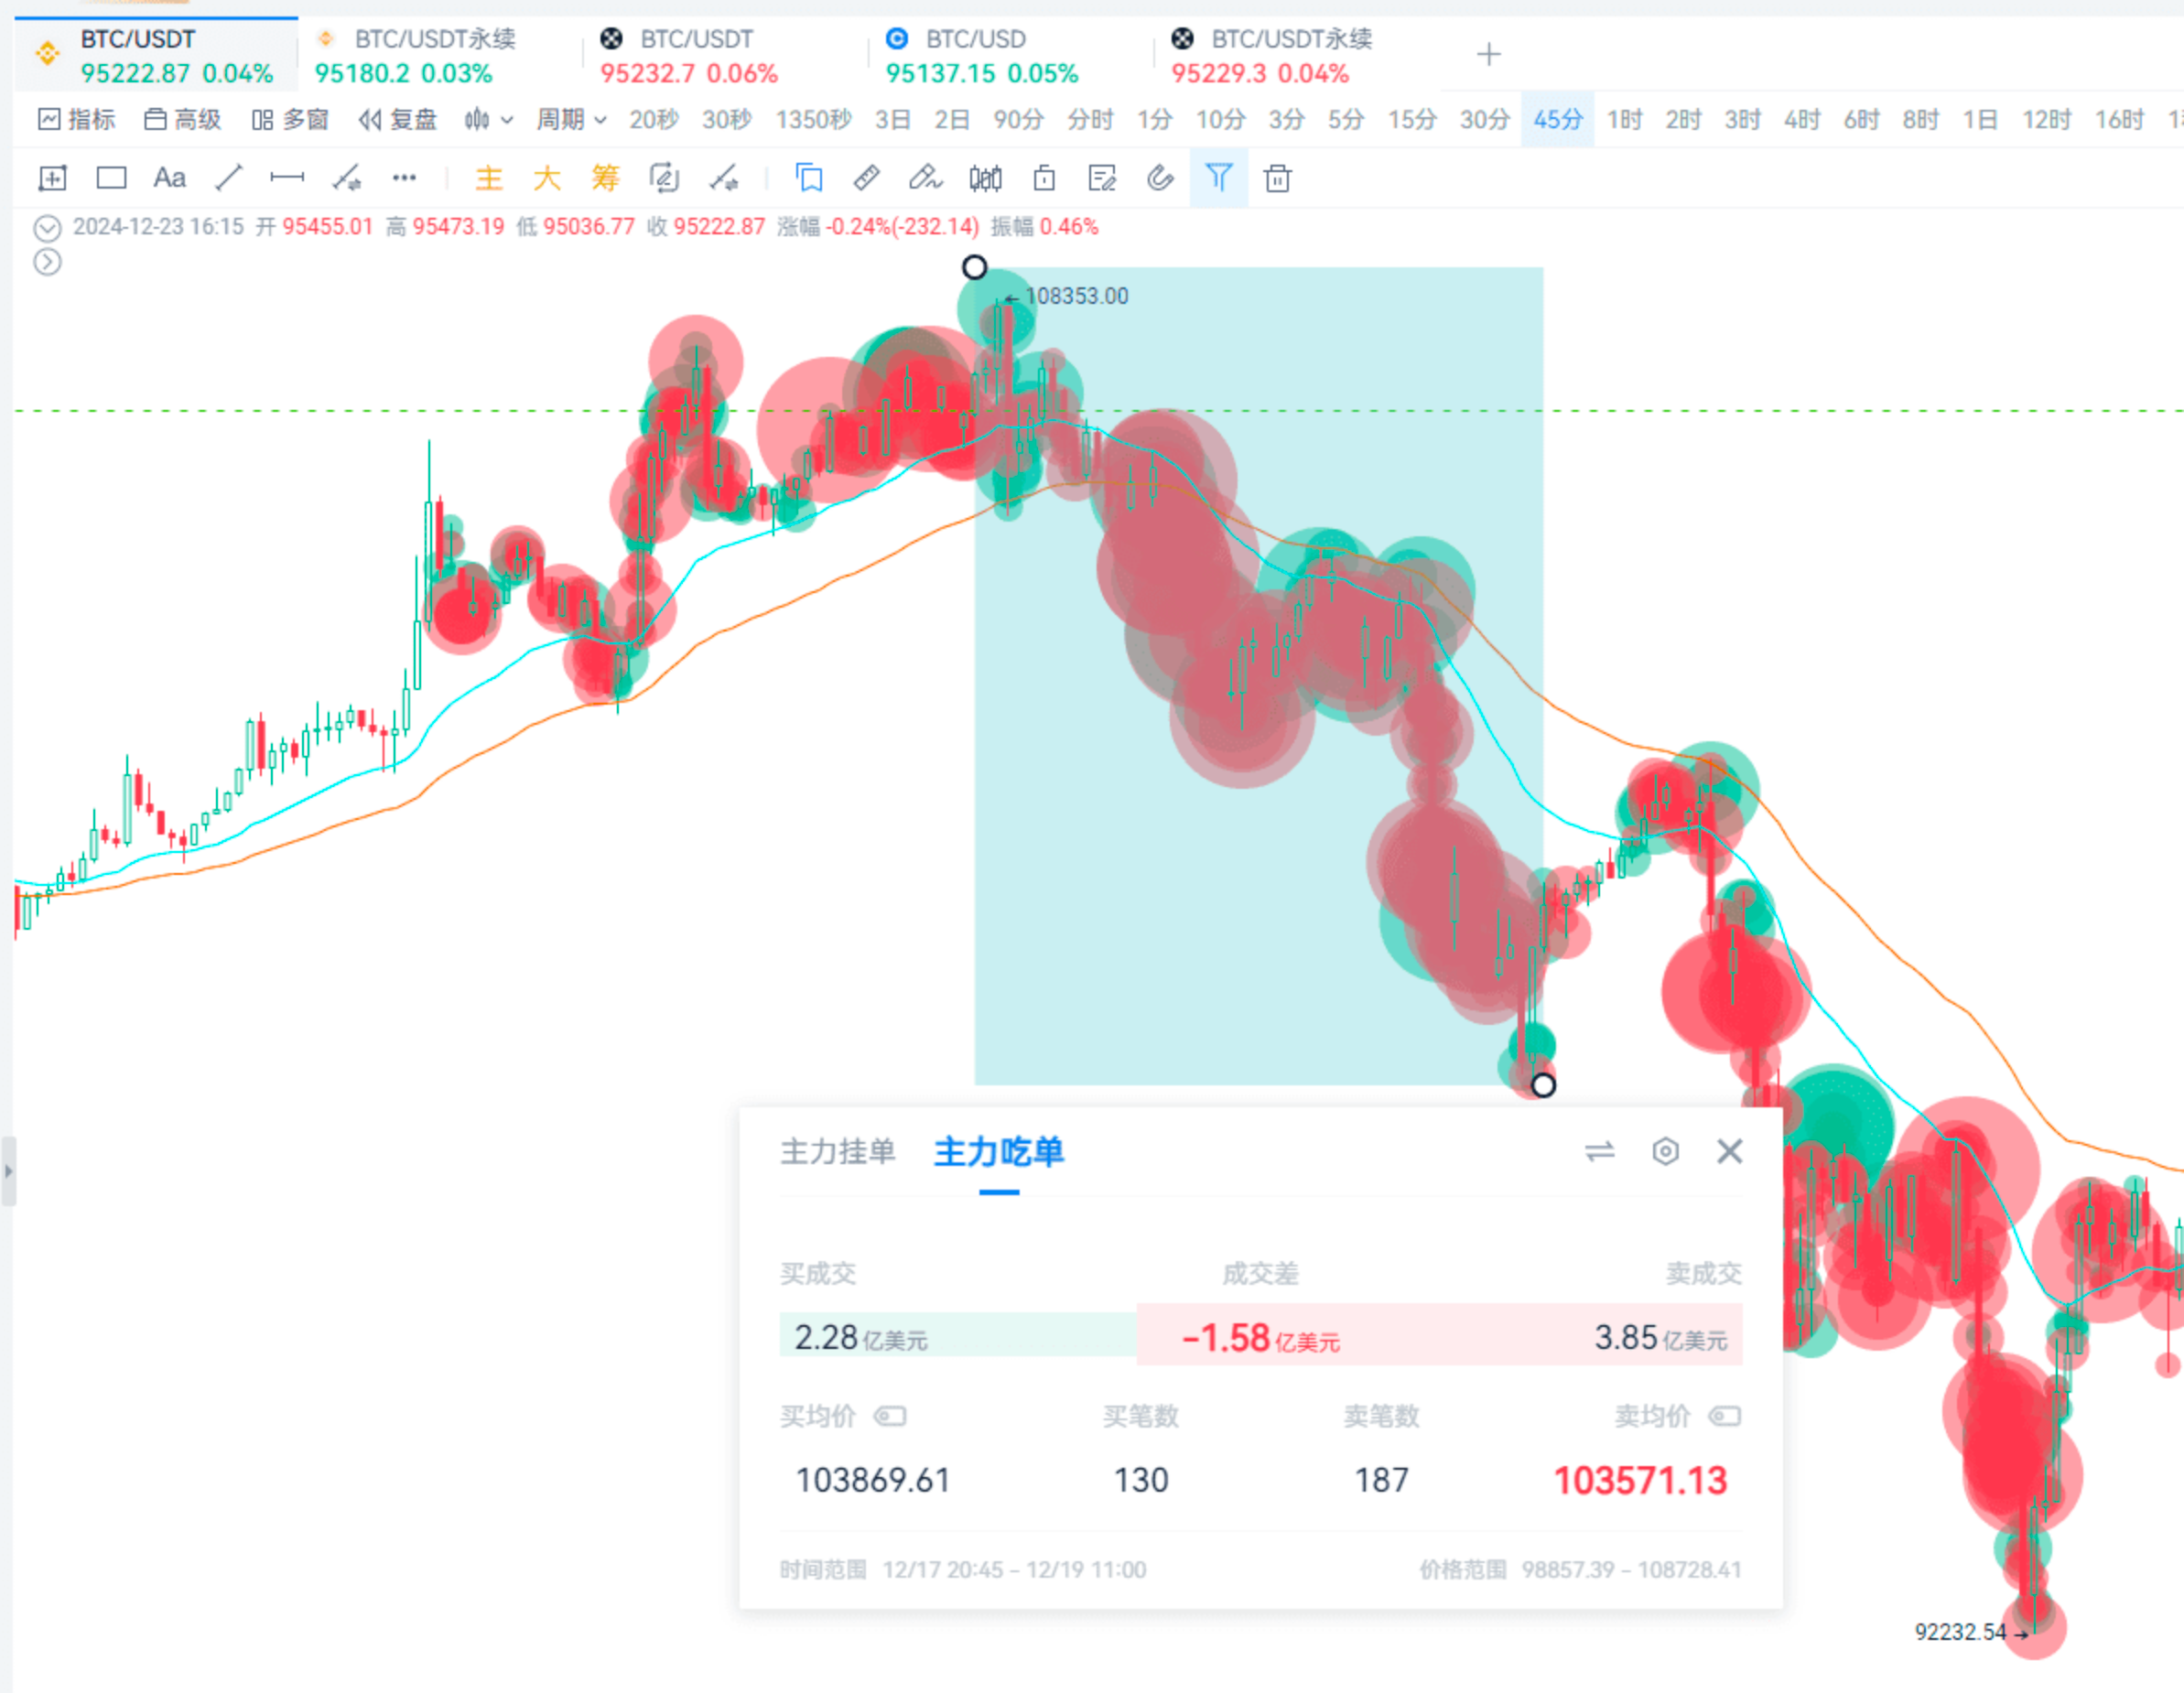
Focus on extremely large orders, for example, in Binance spot trading, look for transactions over $5 million. If there are concentrated large orders appearing, it indicates strong selling pressure, so don’t rush to bottom-fish.
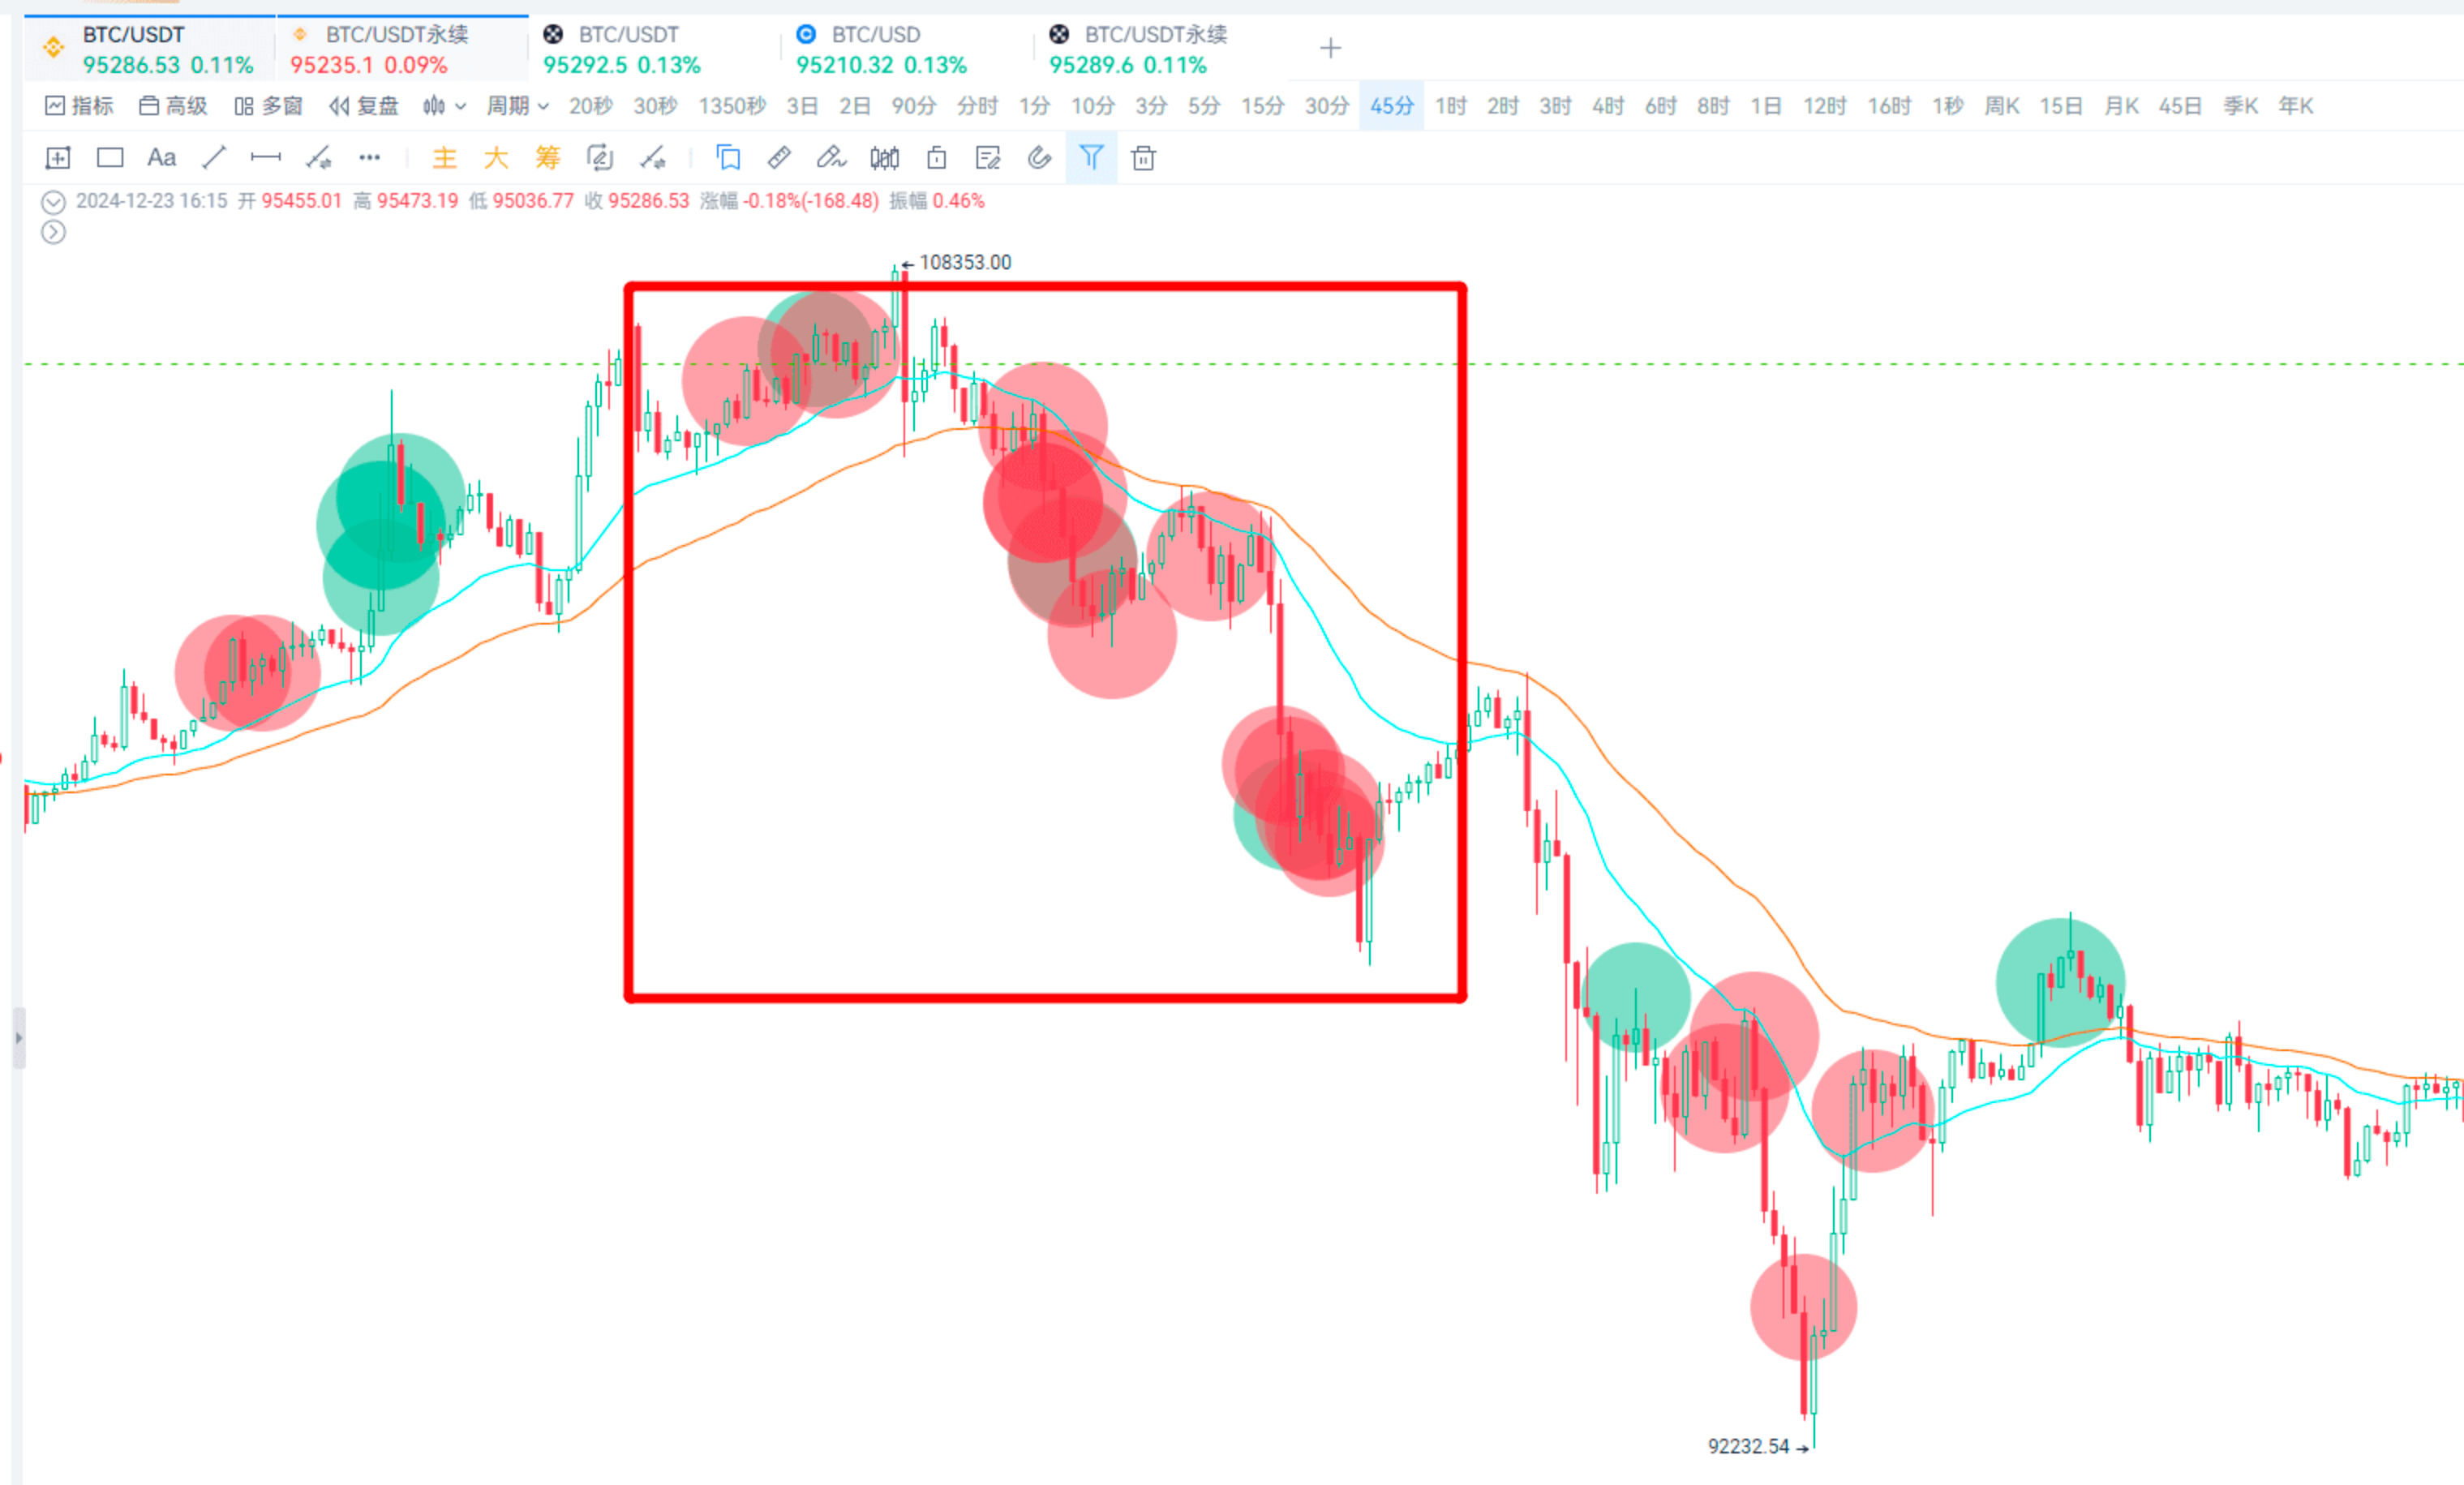
As shown in the image.
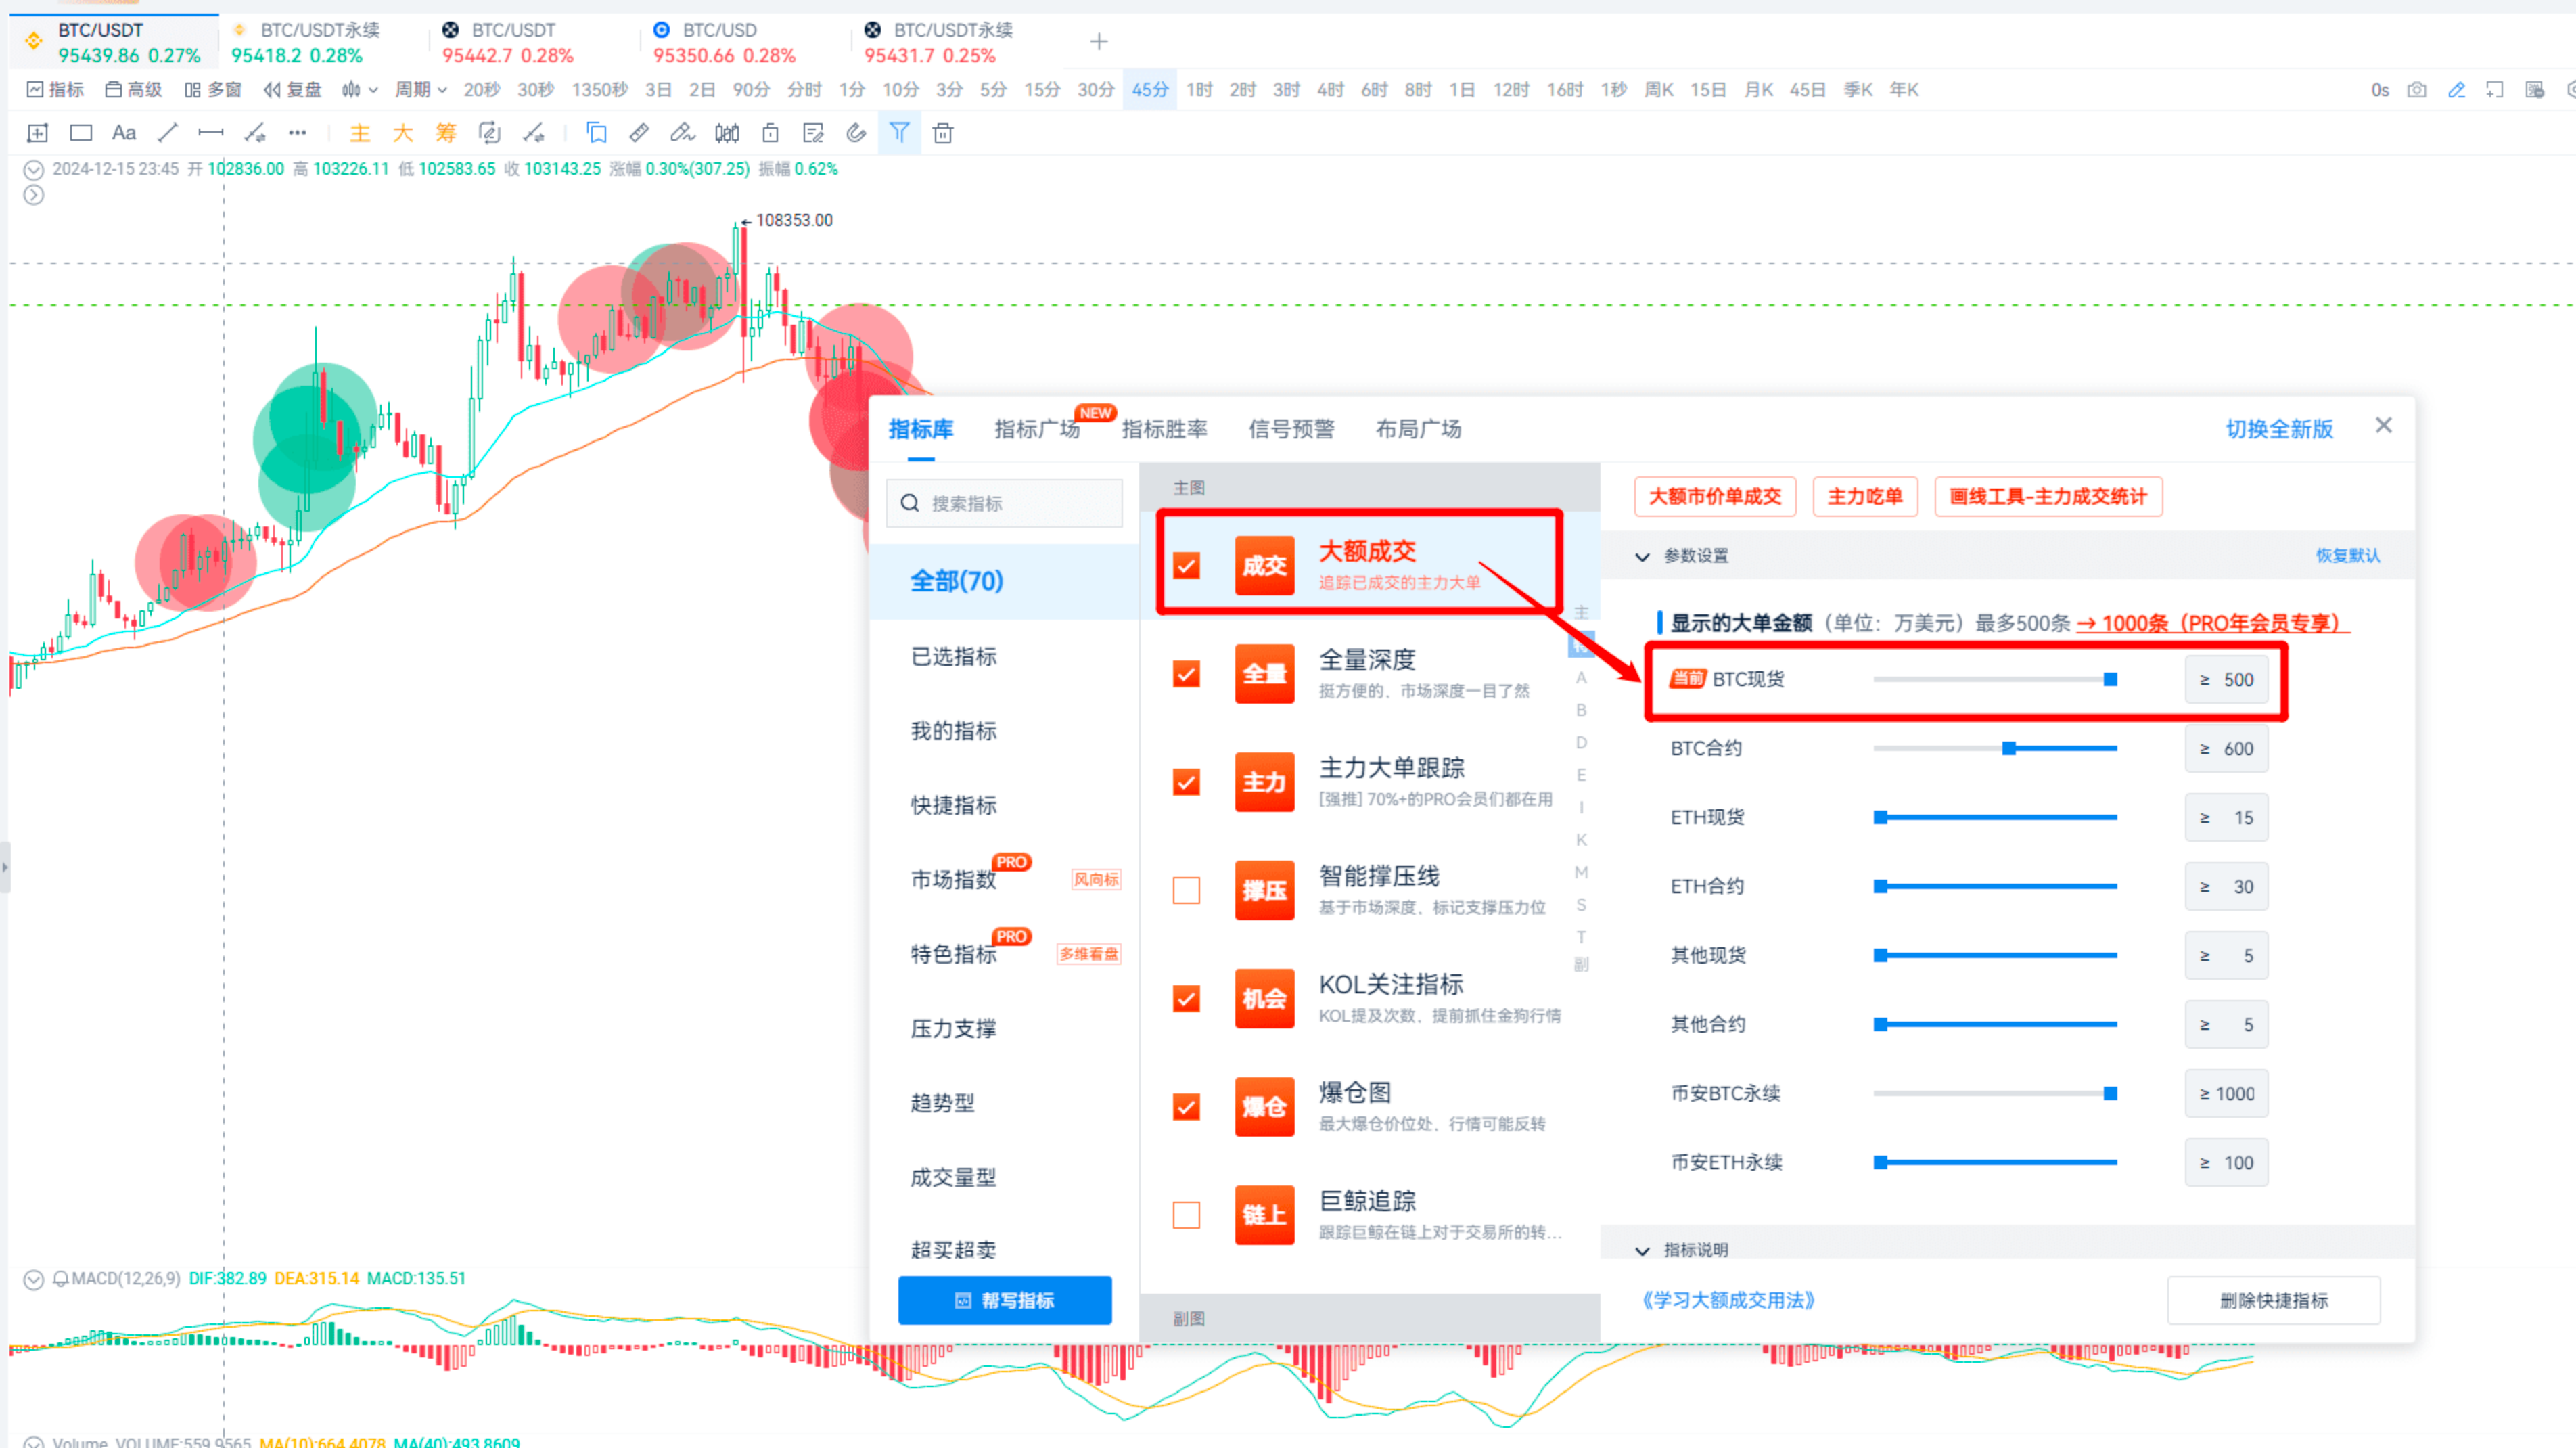
For PRO users, you can use the above two techniques.
Spot trading has no leverage; it involves real capital.
For non-members, consider using MACD divergence and look for line divergences!
Other divergences can also be used; I’m mainly sharing my techniques here.
For divergence, look at the DIF line and select the period.
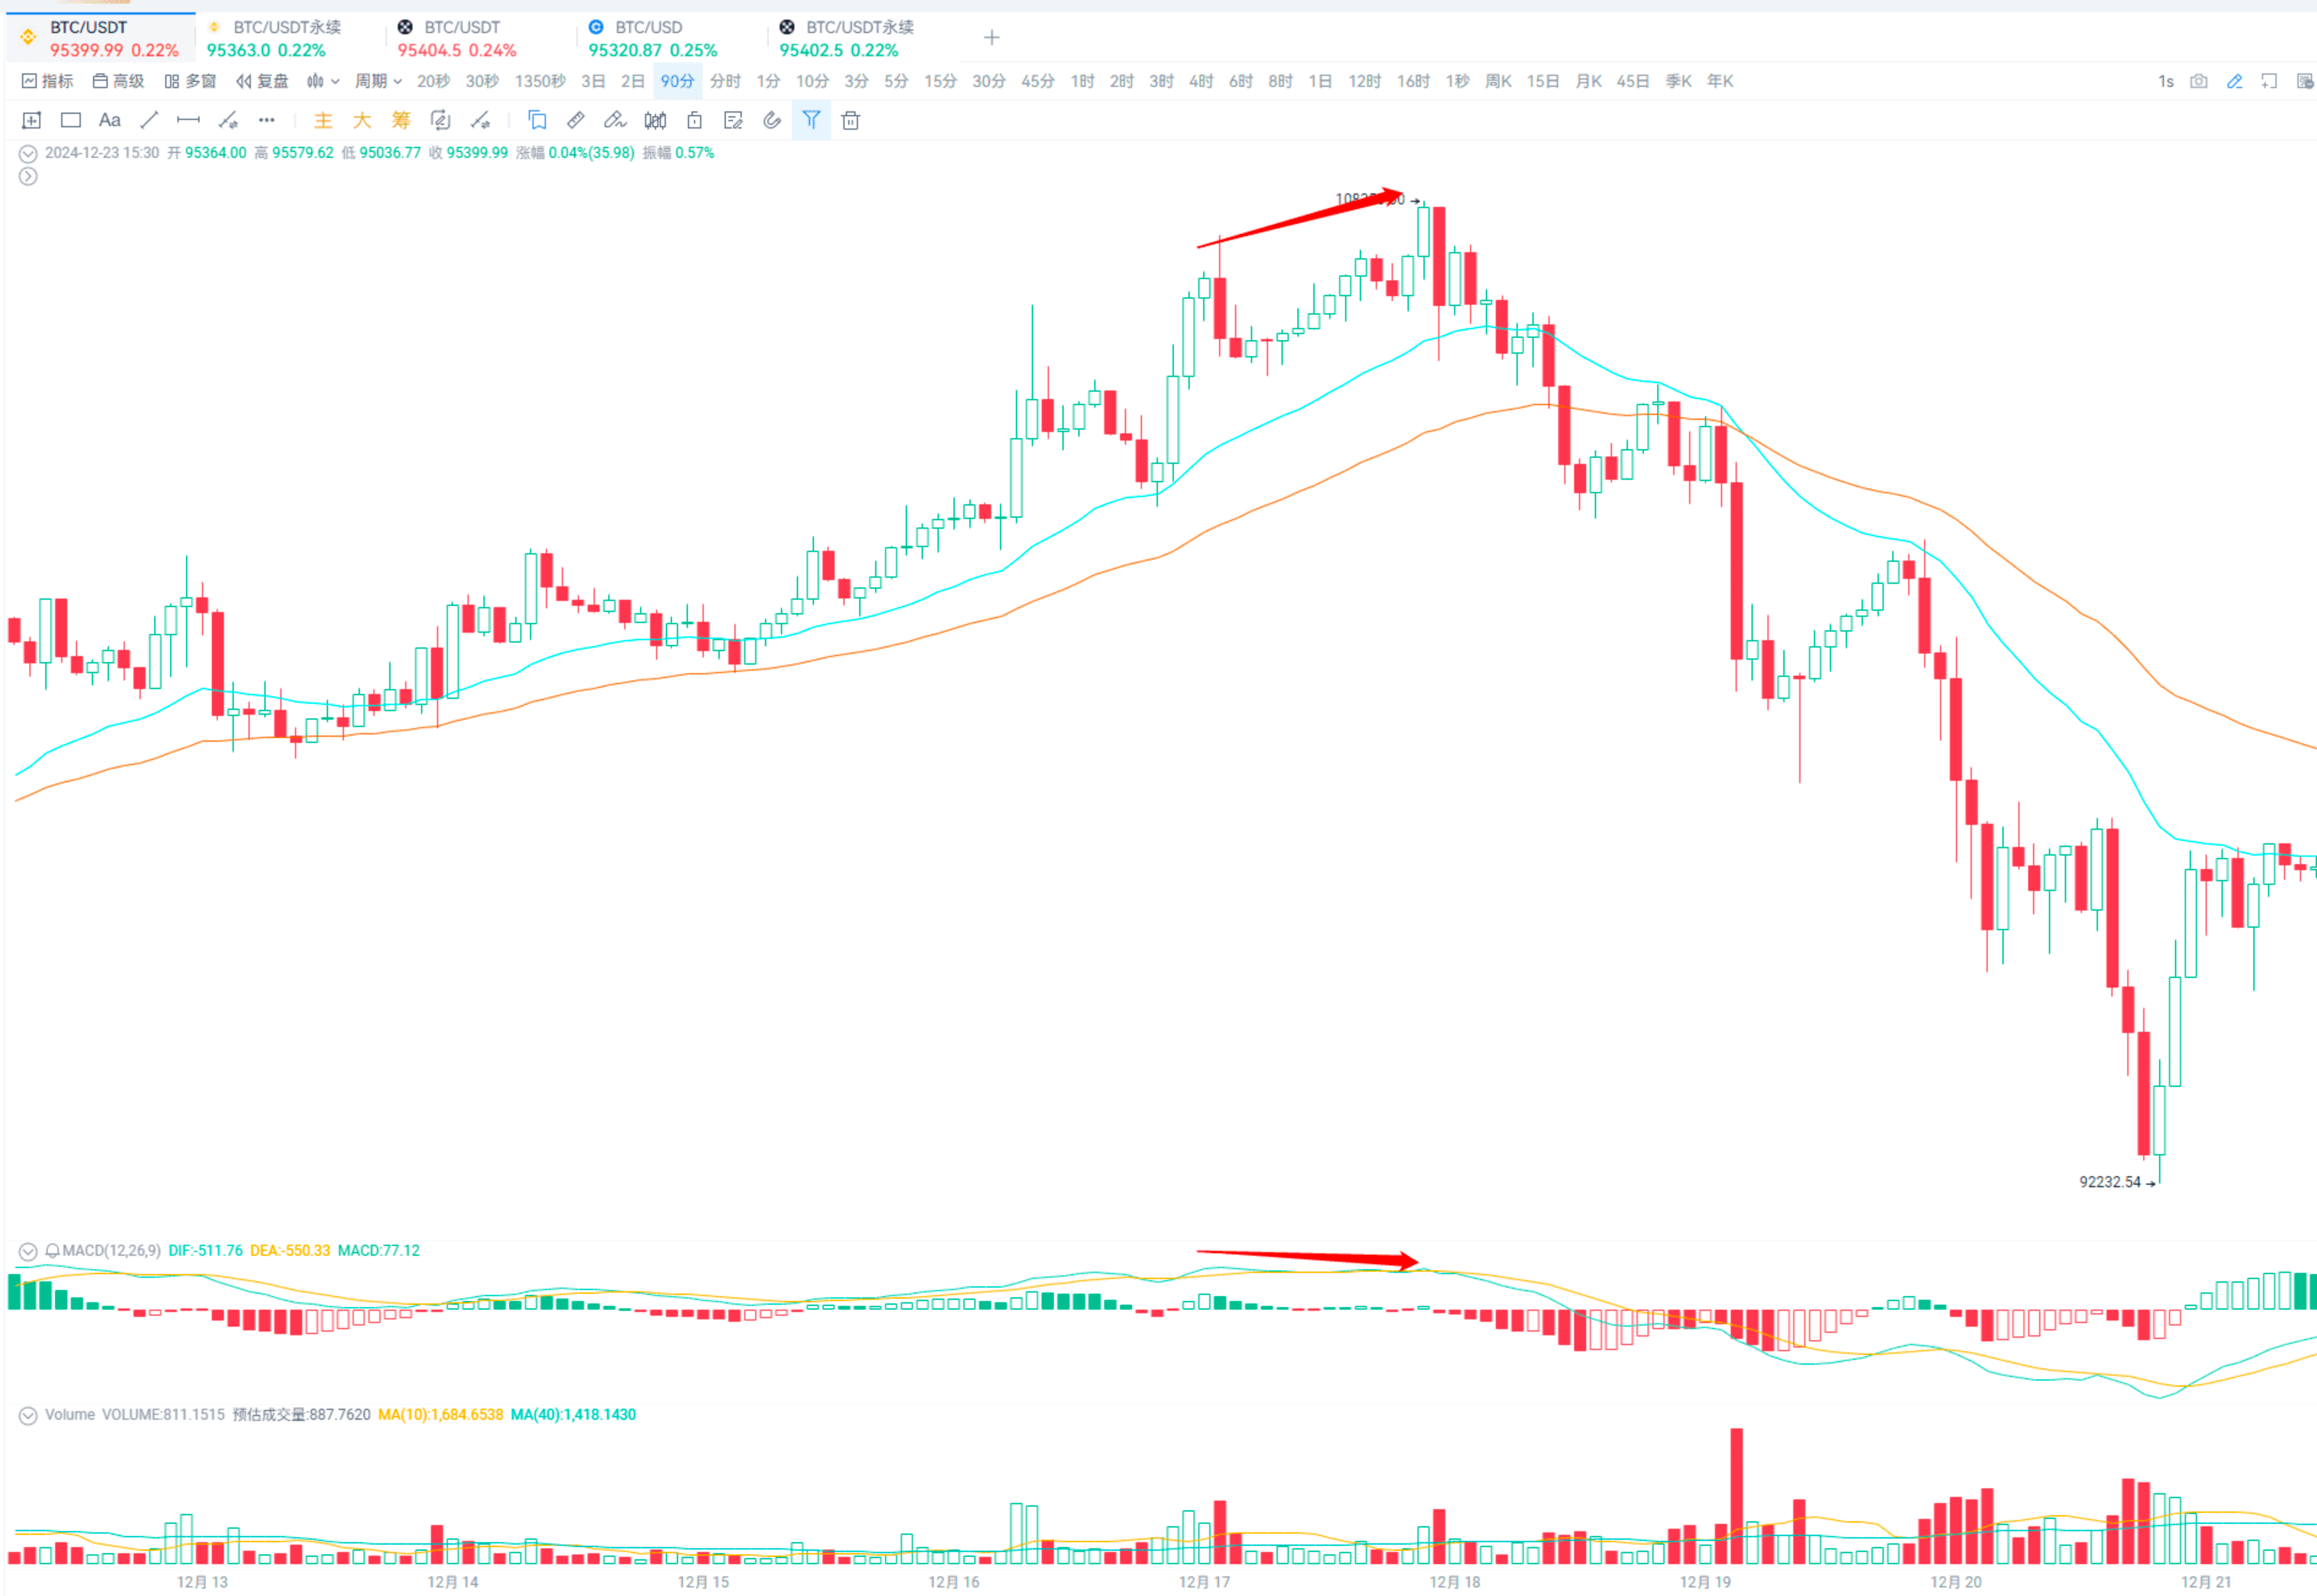
Line divergence is acceptable for judging entry and exit points.
As shown in the screenshot, there is a bar divergence, but the line does not diverge, which means the trend hasn’t changed.
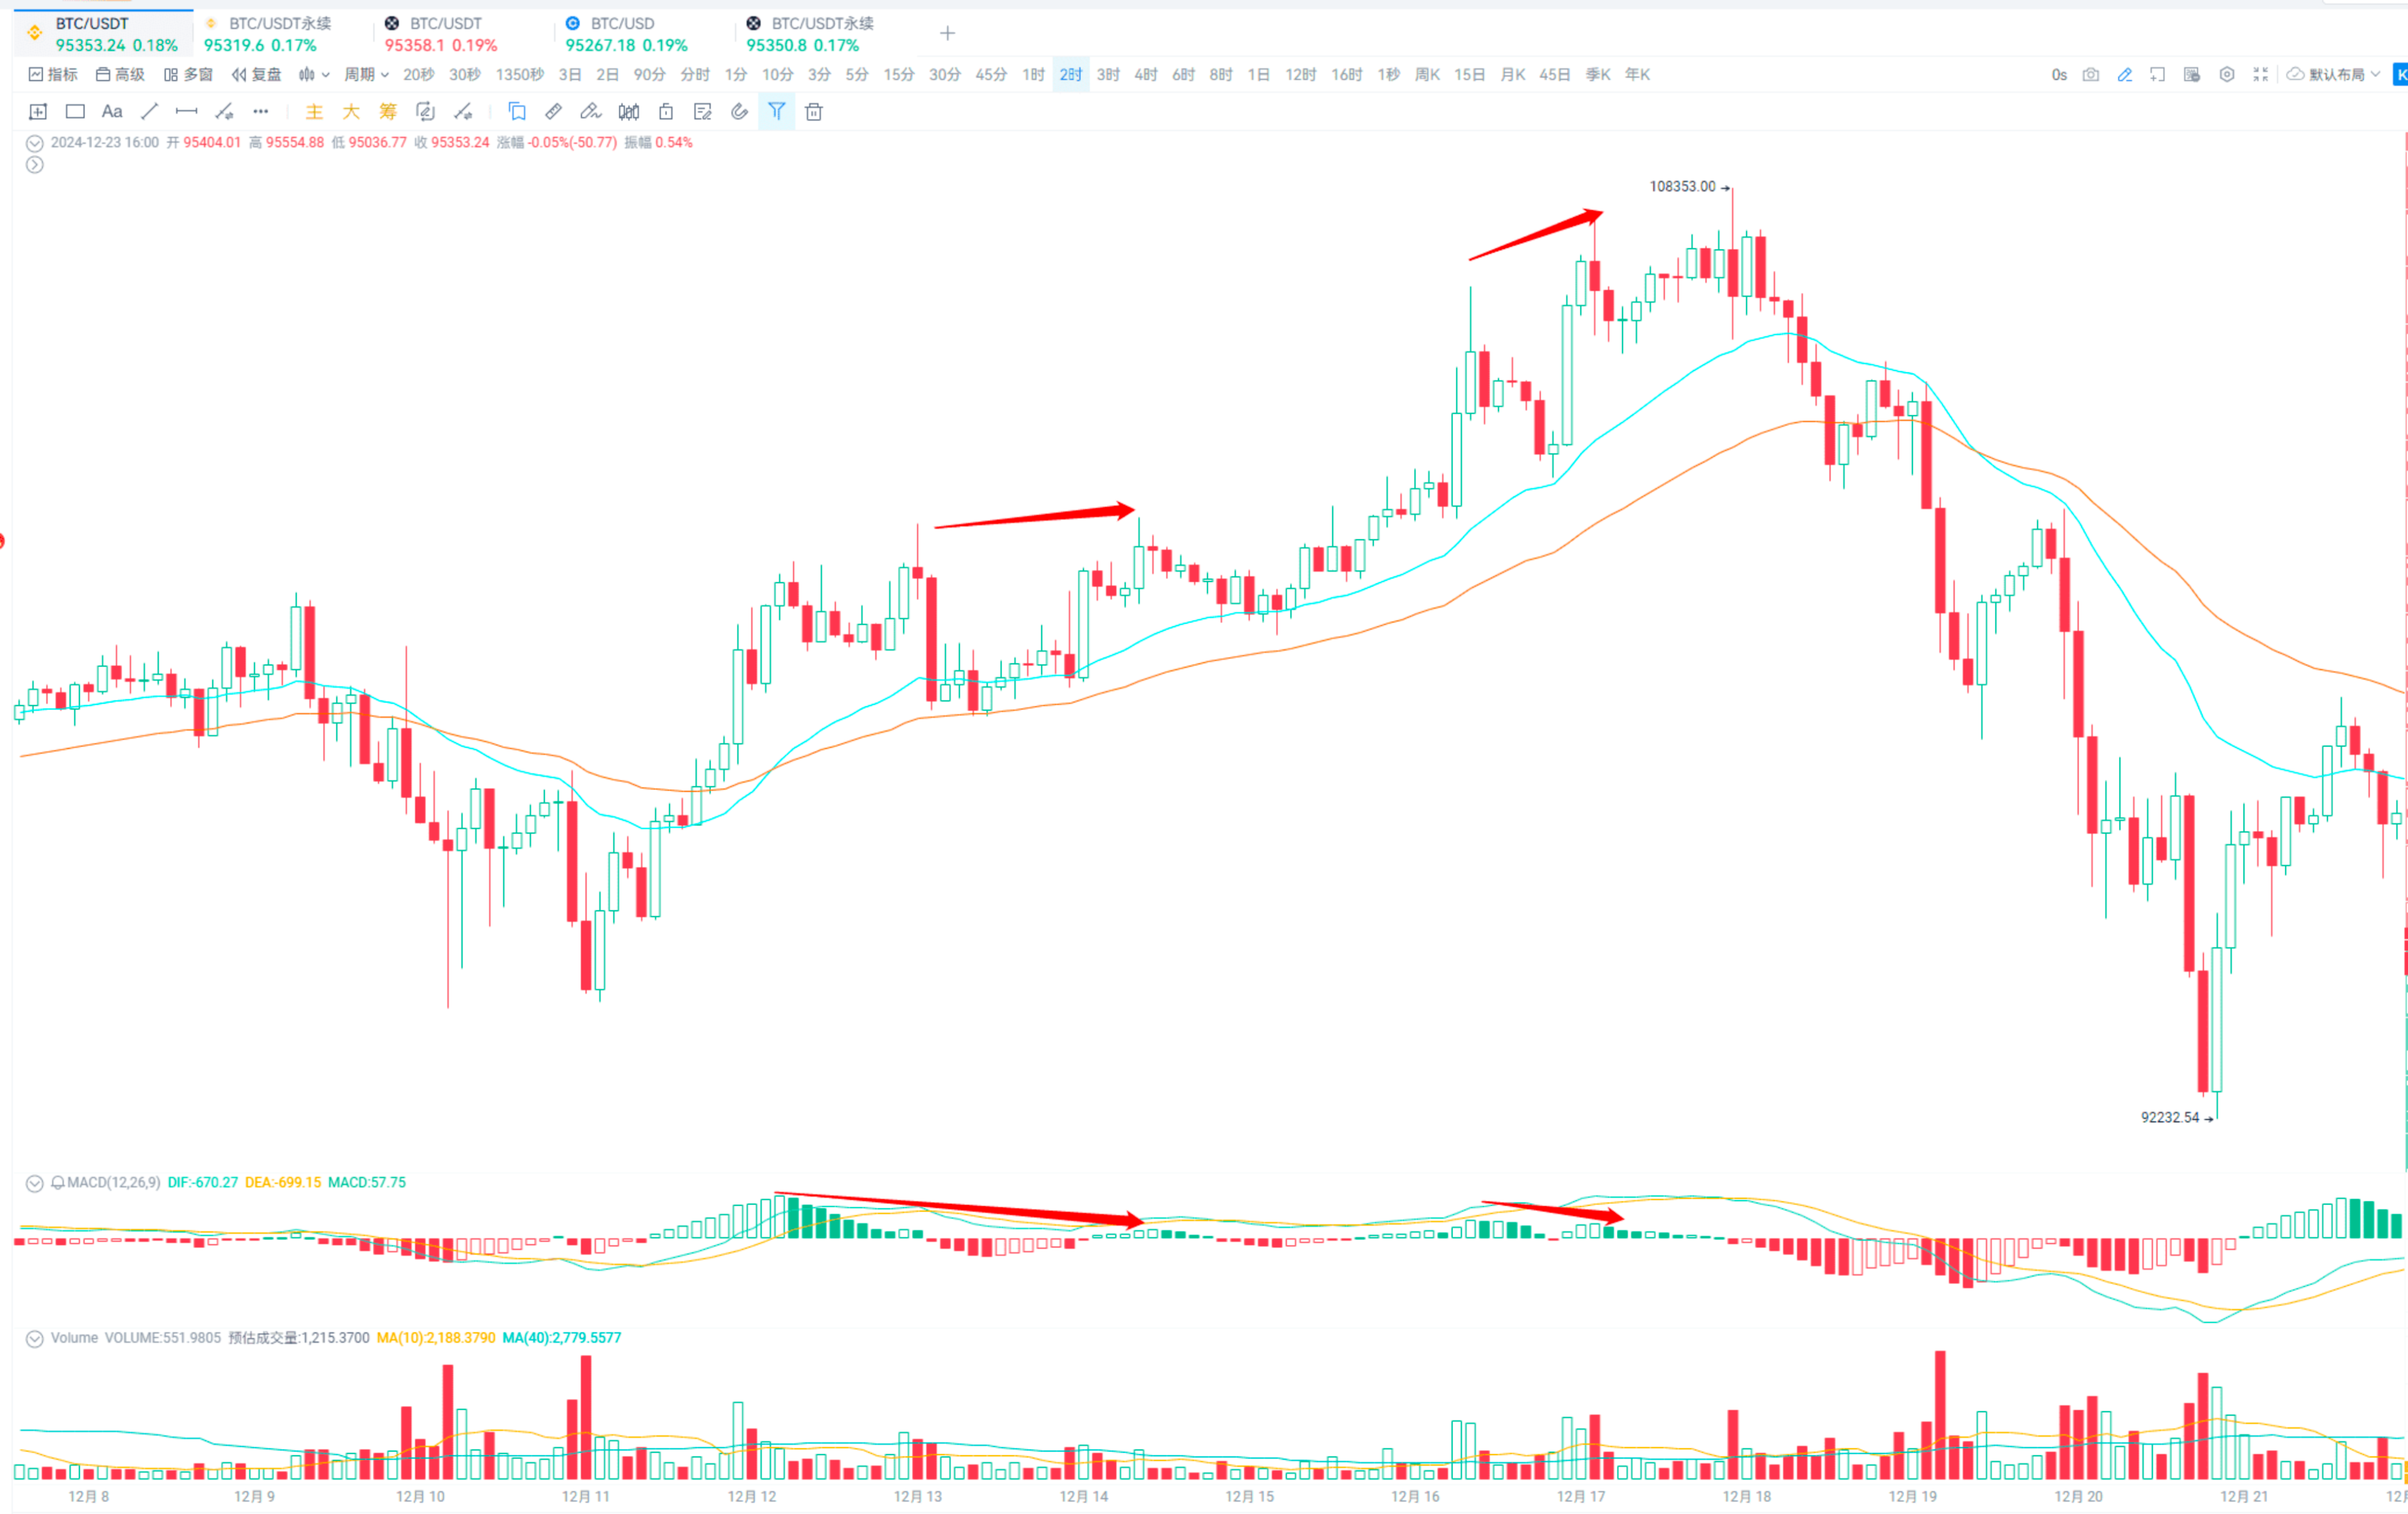
Line top divergence: price makes a new high, but the DIF line does not.
The K-line peaks are getting higher, but the DIF line peaks are getting lower.
Some friends in the comments asked what works well with MACD. Personally, I prefer using EMA combined with MACD. I usually use EMA24 and EMA52, which can help determine direction and support/resistance levels. Using moving averages to judge pullback effects works very well.
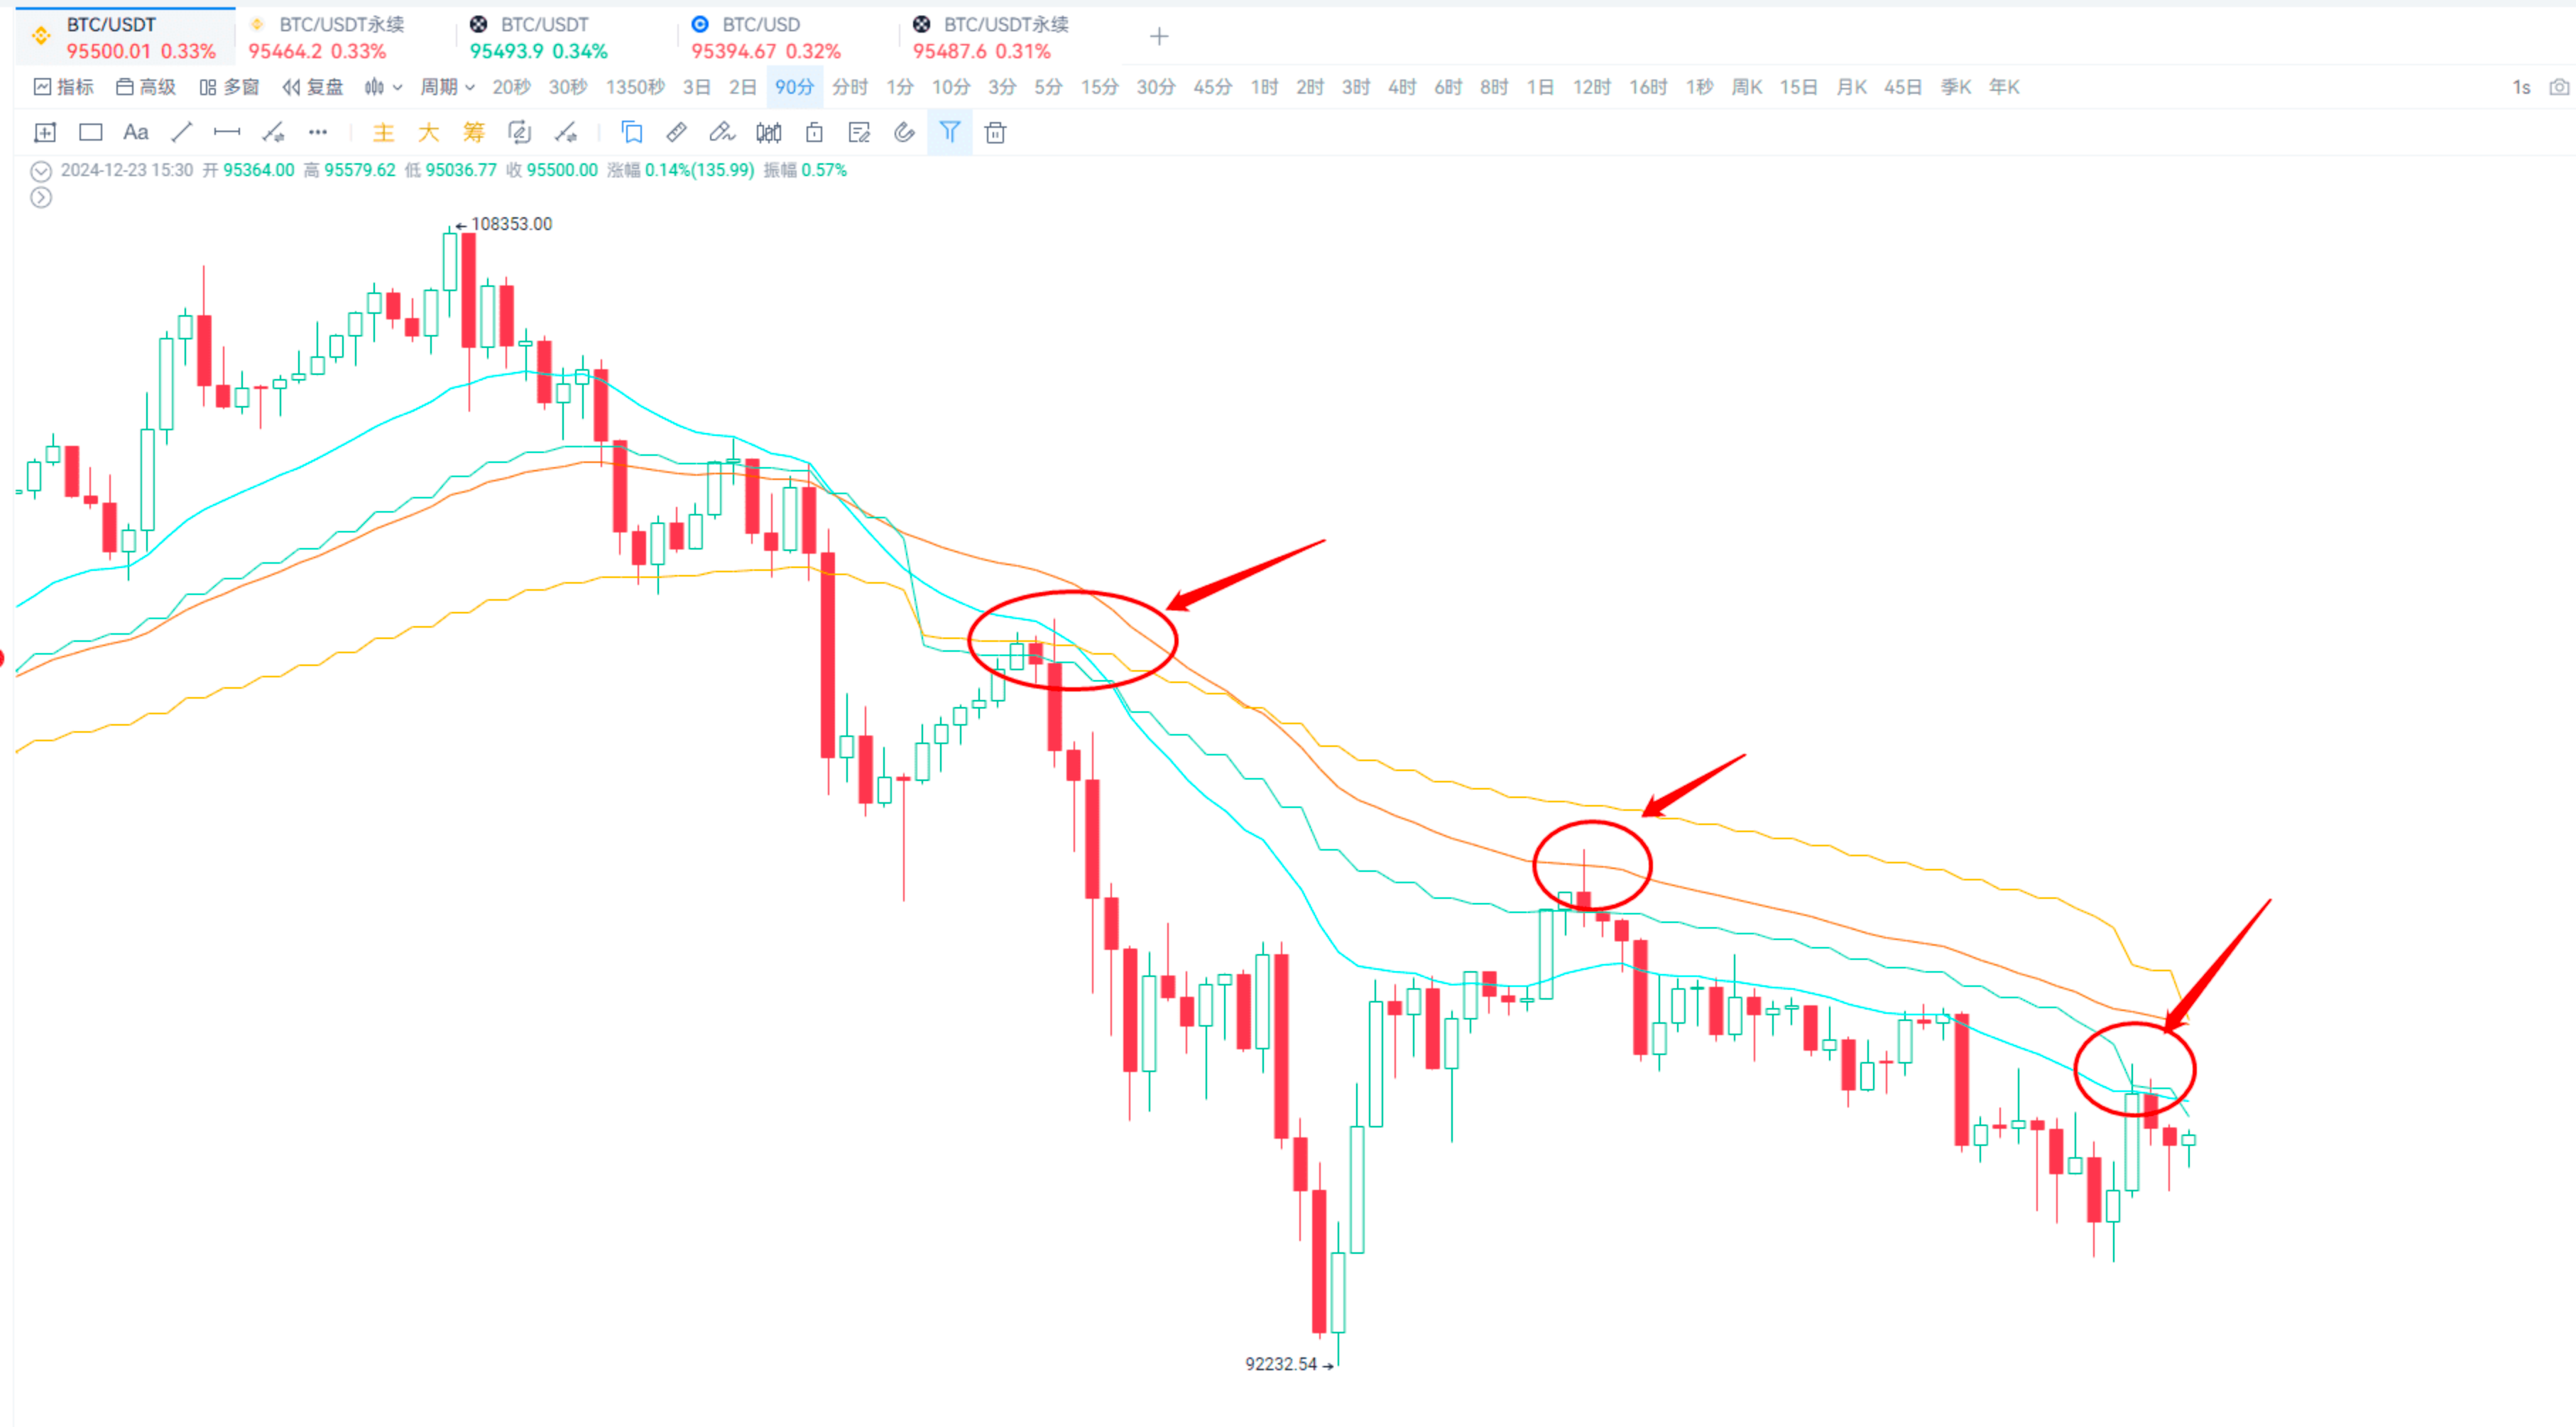
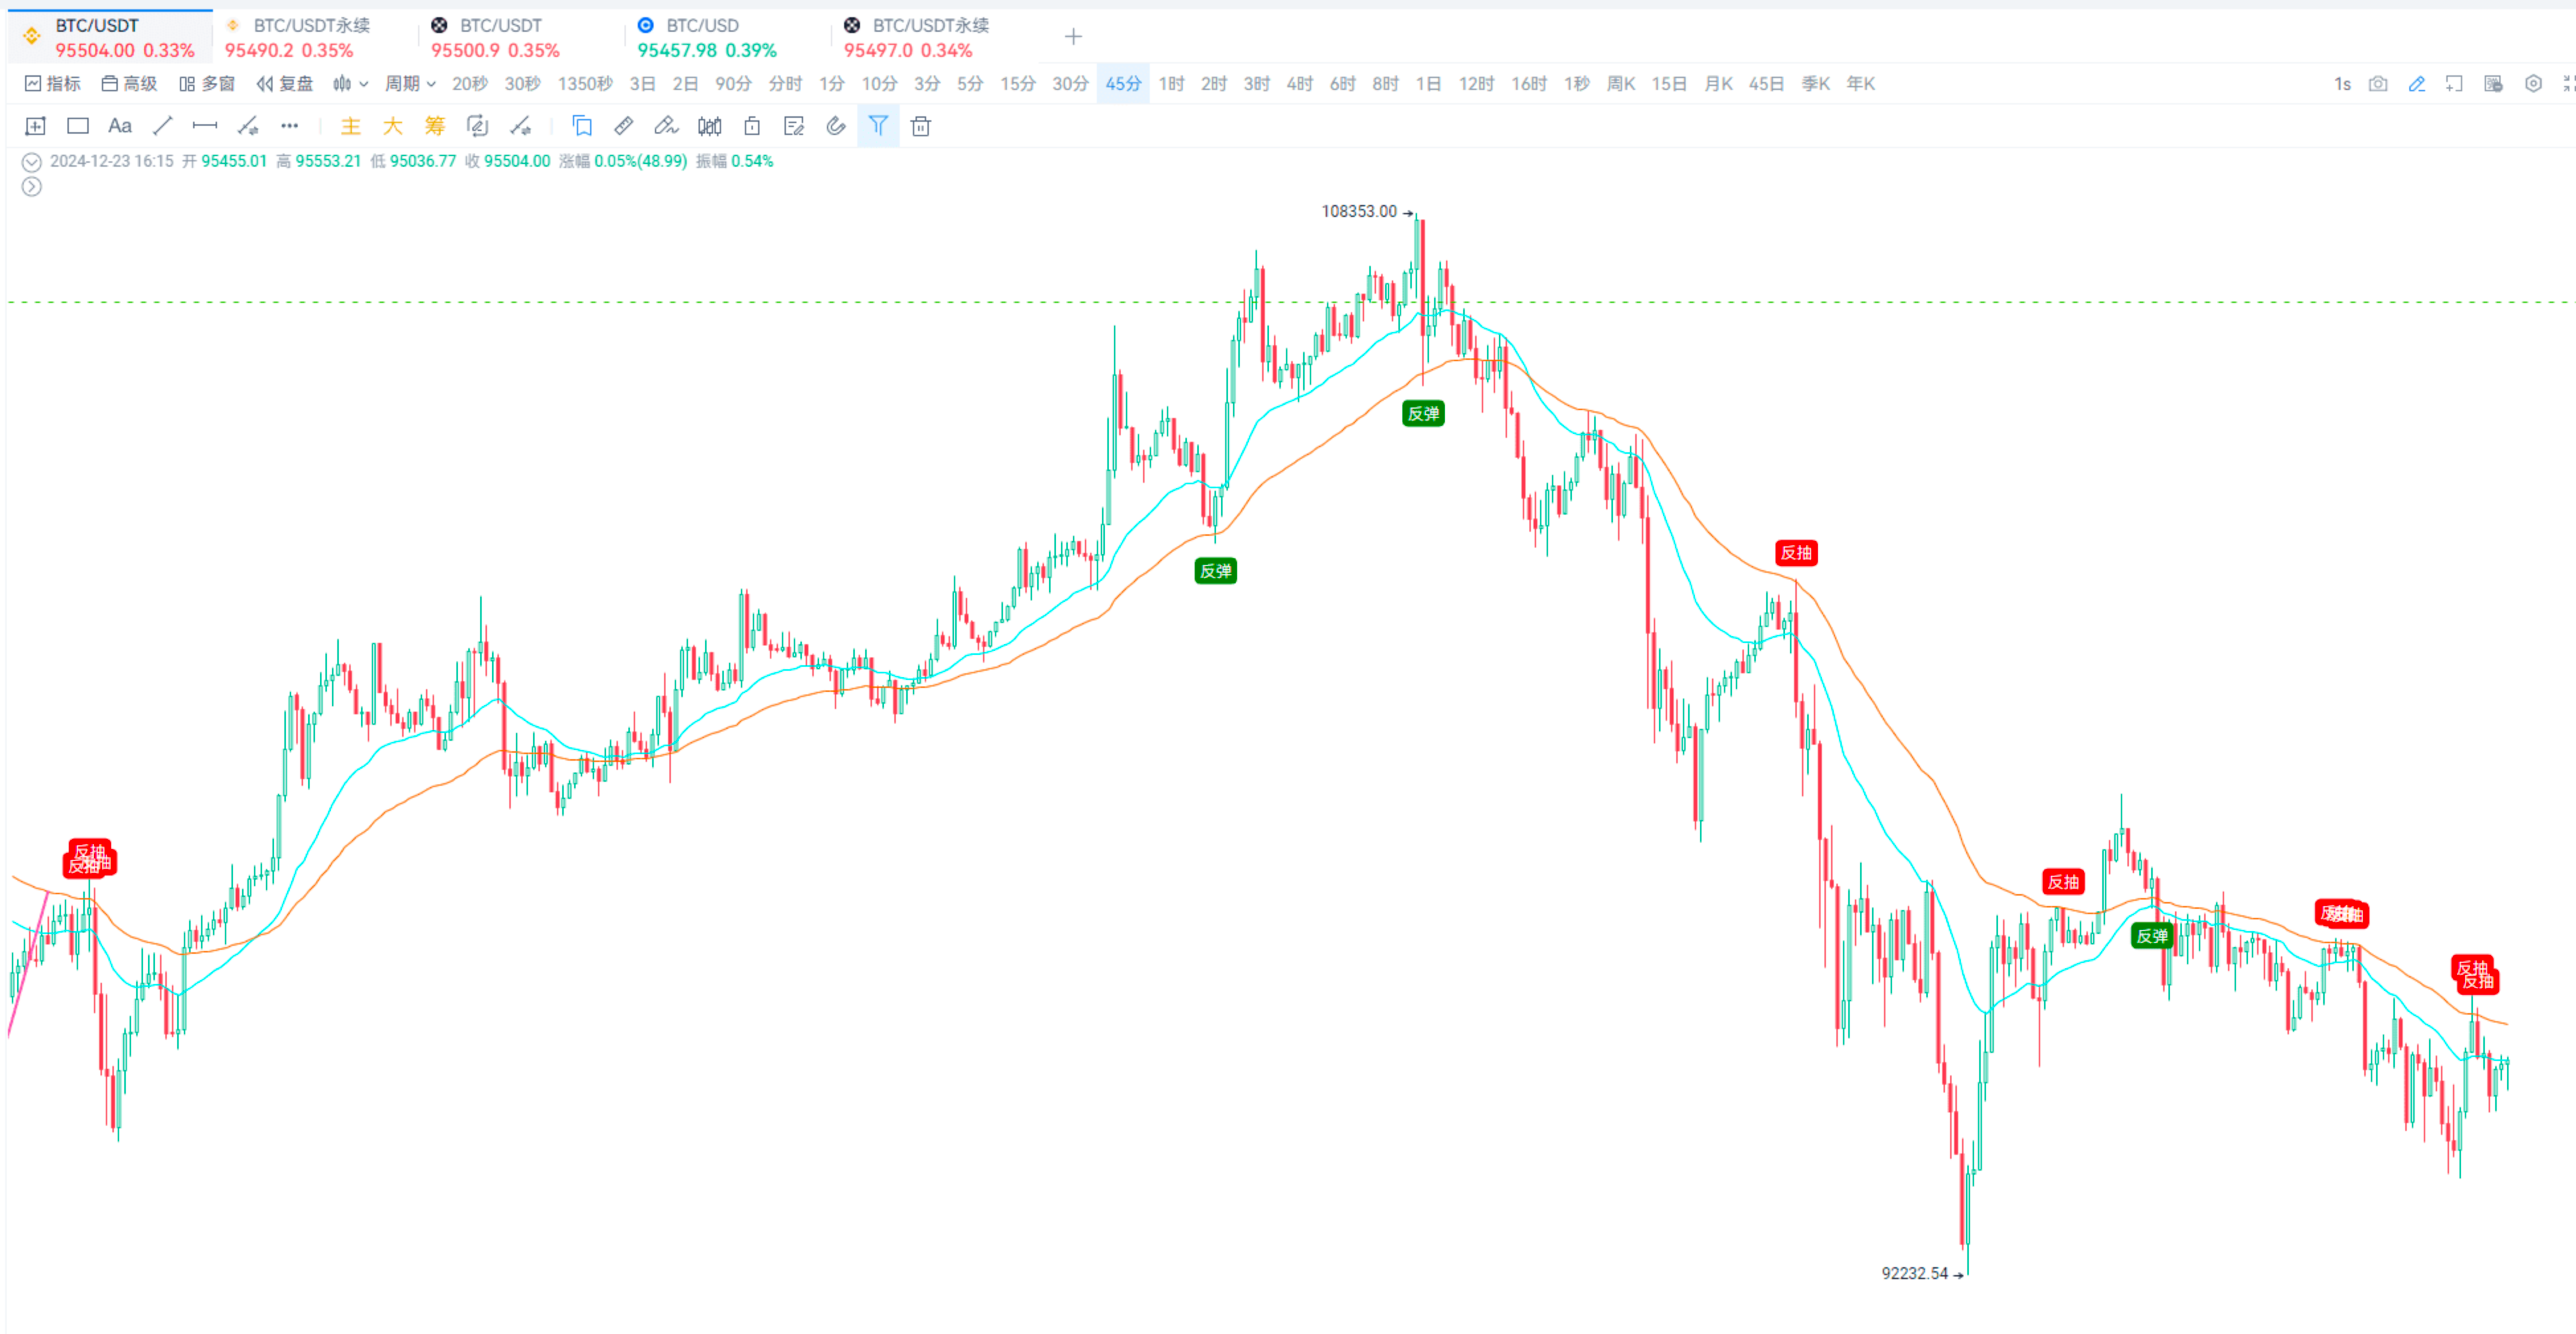
This is essentially what I shared with everyone before: if the price retraces without breaking the moving average, it indicates a rebound; if it rises without breaking the moving average, it indicates a pullback.
Focus on the closing situation. For example, in the screenshot above, it touches the moving average but closes below it, indicating resistance to the upward movement.
If implemented with custom indicators, it would look something like this, but the image isn’t perfect yet. Once it’s refined, I’ll share it in the community indicators for everyone to subscribe to.
Additionally, I want to add that these extremely large orders can be monitored with alerts.
The previous MACD line divergence can also be monitored with custom indicators. Interested friends can contact our customer service for customization.
Finally, I want to recommend another tool: DCA.
I’ve actually talked about this in many previous sessions, mainly to briefly explain its usage.
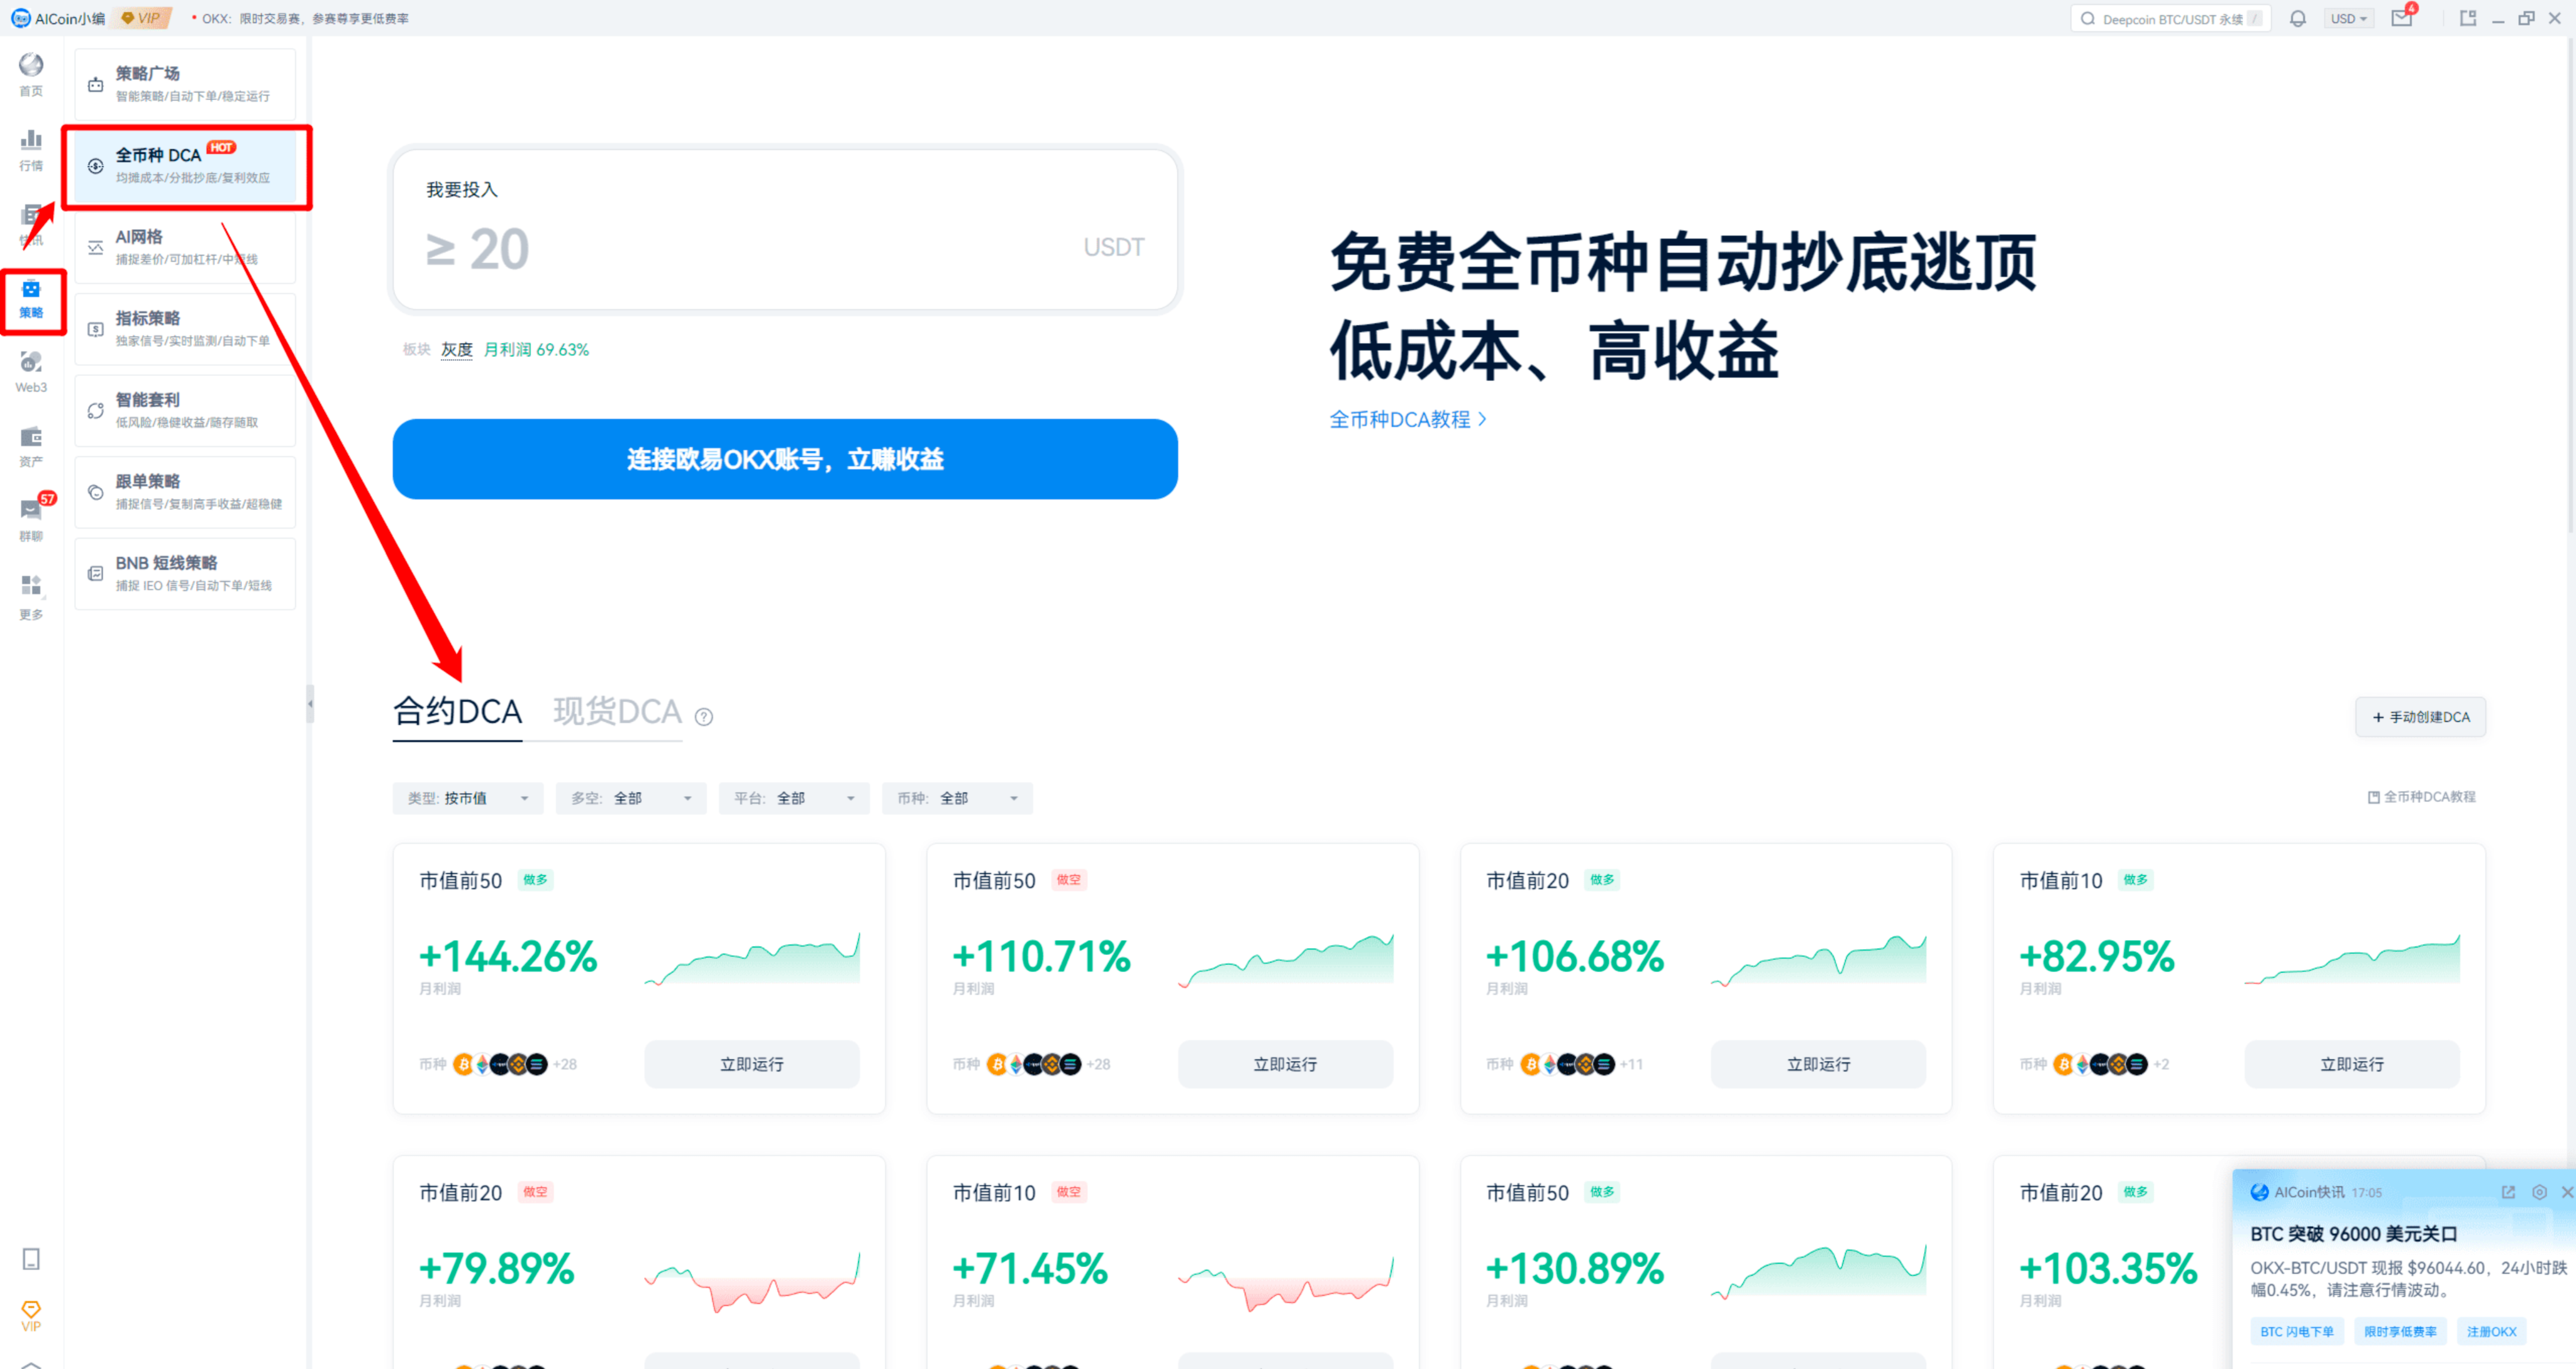
DCA, or Dollar-Cost Averaging, is a strategy for buying in batches. Essentially, the strategy is to buy more as prices drop, averaging the cost, and then sell all at once for profit when prices recover and reach the target.
Currently, Bitcoin is at a relatively low level. If it enters a range adjustment (consolidation), you can consider using contracts or spot DCA, opening long positions or buying at range points.
Now that we are in a rebound, you can also do spot DCA, buying on pullbacks.
But you must be cautious; if there is a one-sided downward trend, it is not recommended to engage in DCA, as you may get stuck at high points. I’m sharing this mainly because the market has already undergone a period of correction and is testing the moving average resistance zone.
However, it is advisable to wait for the news from MicroStrategy tonight before judging whether the downward trend has ended.
This is mainly a simple sharing of techniques. If anyone is interested in the features, I will arrange a separate explanation later.
Emphasizing: Always conduct risk management, set stop-loss points, control the amount of capital per trade, and diversify trades to reduce risk.
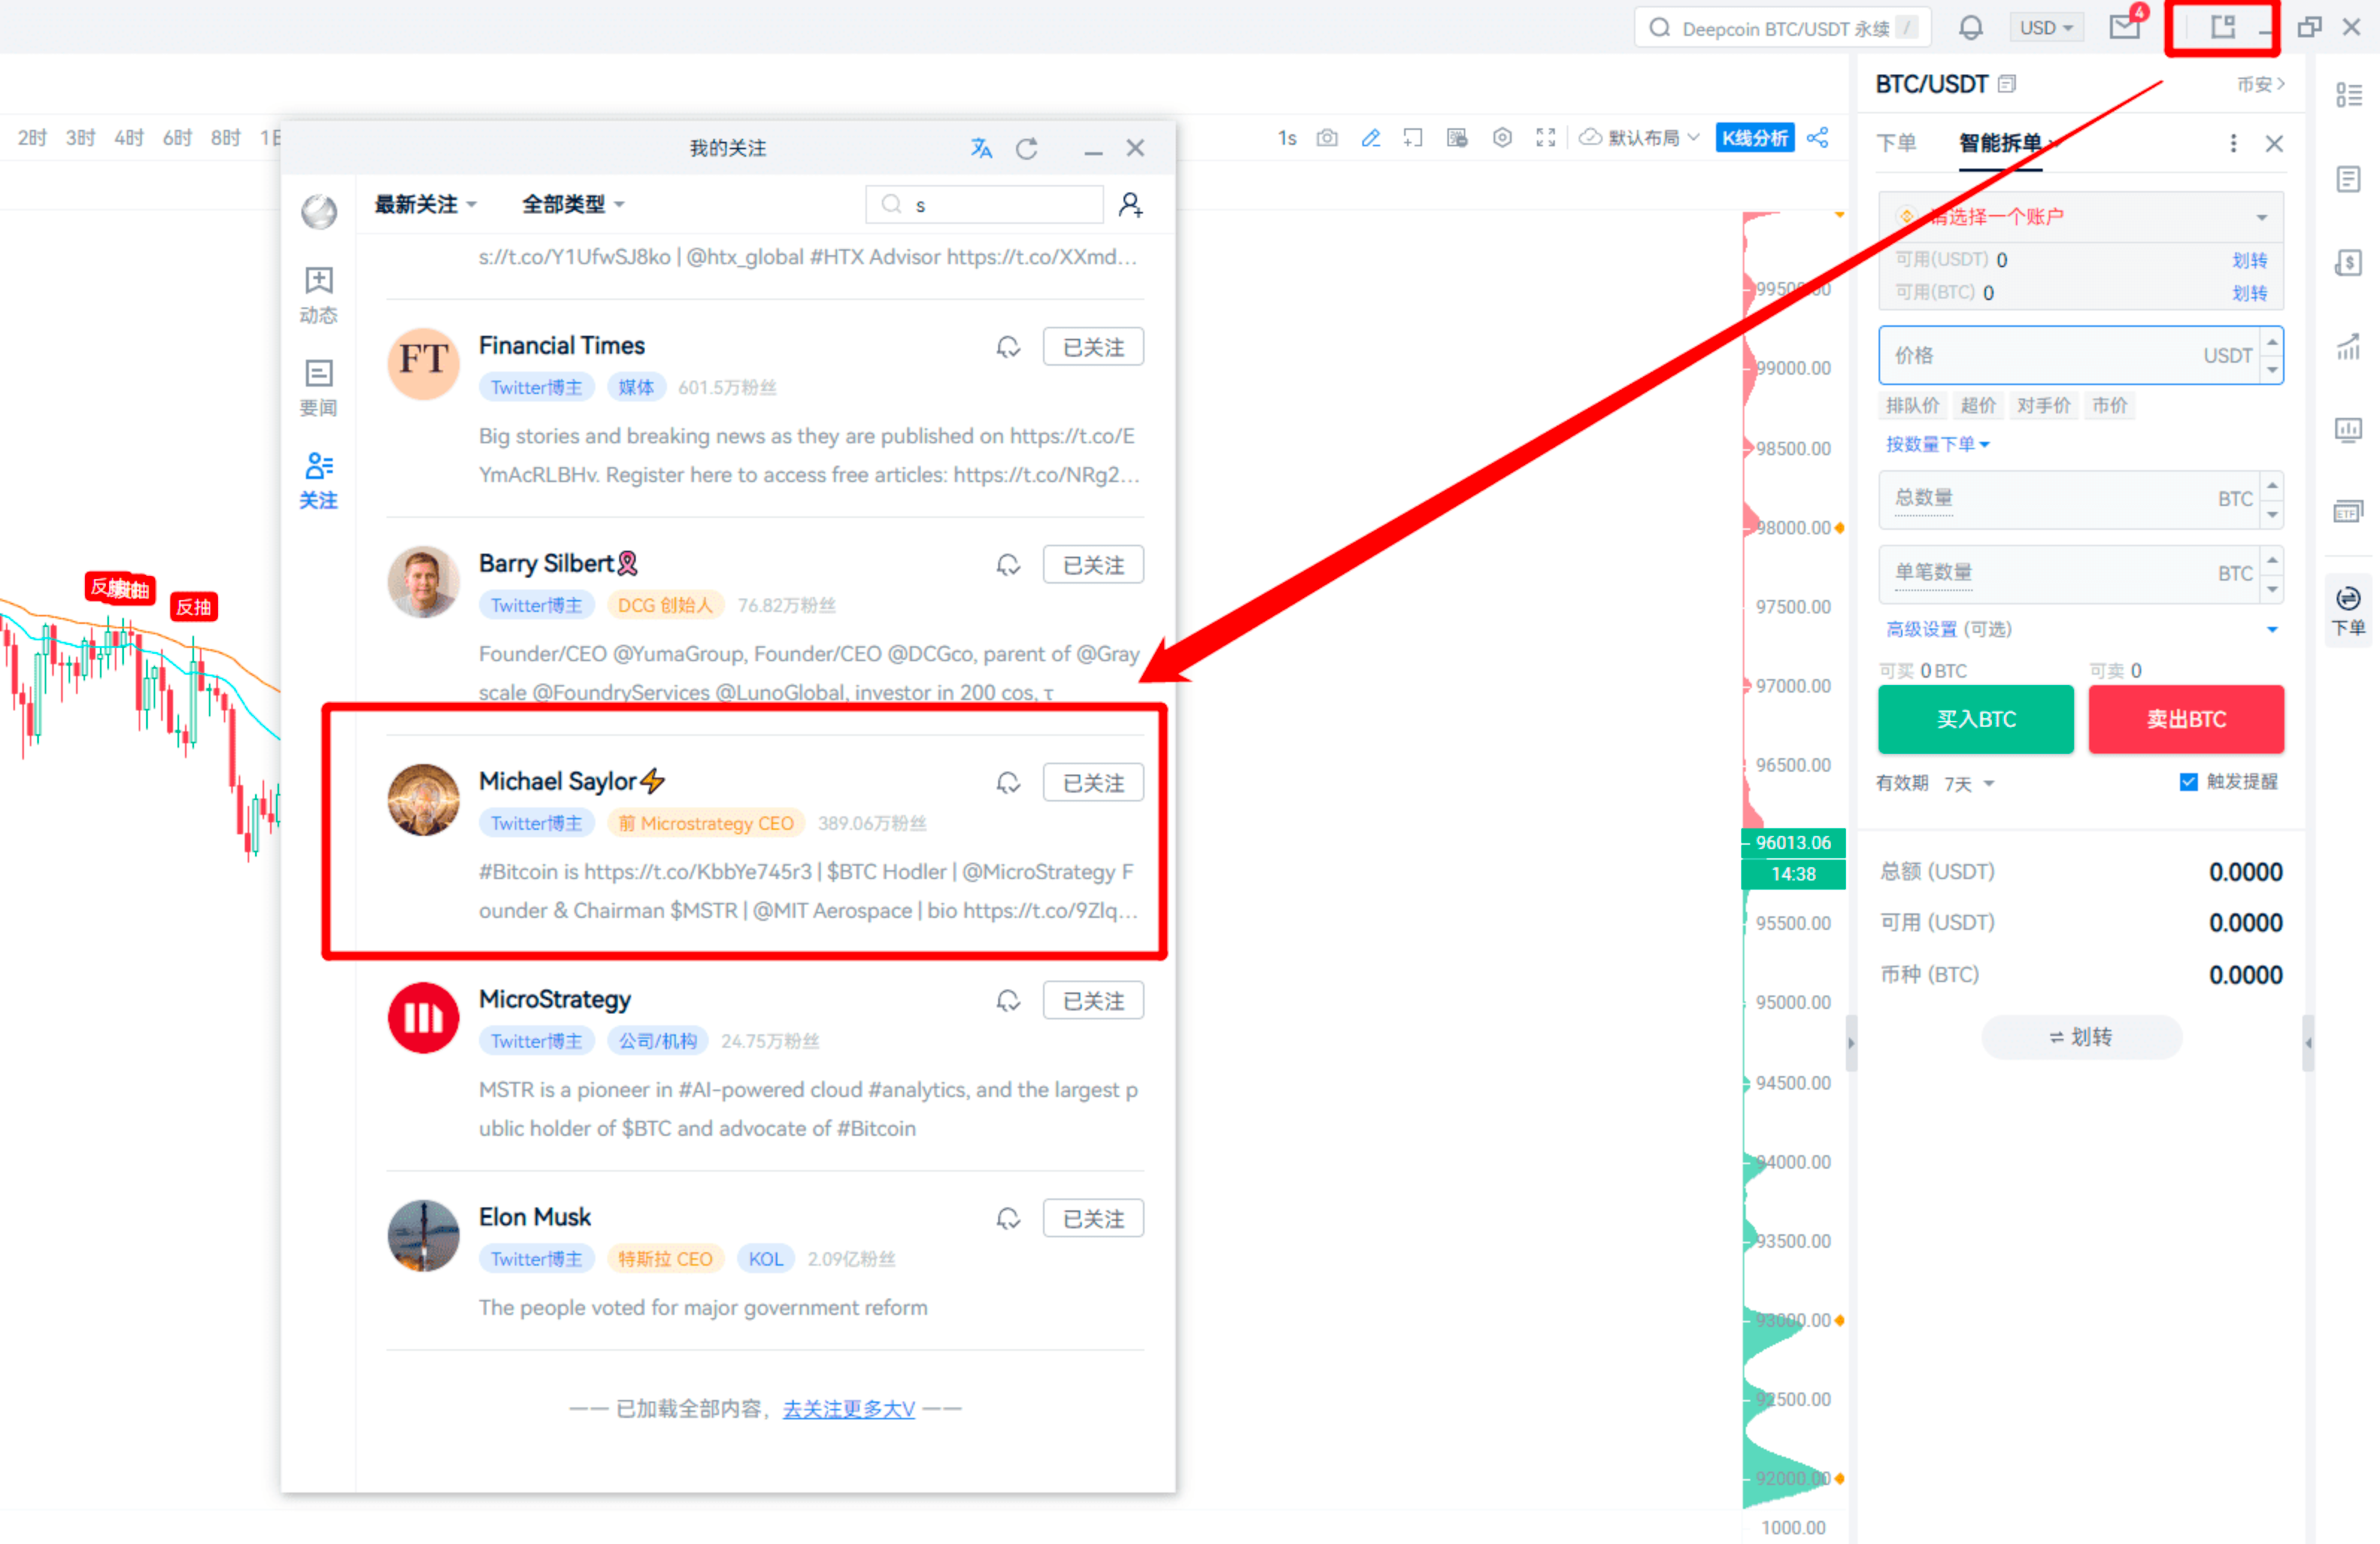
Based on the recent announcement times, it’s around 21:00.
Follow the Twitter of the founder of MicroStrategy.
That’s all for this sharing session. If any members are interested in this neutral strategy, you can contact me in the PRO group. Consuming rights can get you the source code.
That concludes all the content from the live broadcast.
Thank you all for your attention, and stay tuned to our live room.
In a bull market, let’s explore the trends together and find trading opportunities! Use AICoin to earn a life of freedom.
Recommended Reading
For more live broadcast insights, please follow the AICoin “AICoin - Leading Data Market, Intelligent Tool Platform” section, and feel free to download AICoin - Leading Data Market, Intelligent Tool Platform.
免责声明:本文章仅代表作者个人观点,不代表本平台的立场和观点。本文章仅供信息分享,不构成对任何人的任何投资建议。用户与作者之间的任何争议,与本平台无关。如网页中刊载的文章或图片涉及侵权,请提供相关的权利证明和身份证明发送邮件到support@aicoin.com,本平台相关工作人员将会进行核查。


