Waves in the Currency Sea: May 24 Bitcoin (BTC) Market Analysis Reference:
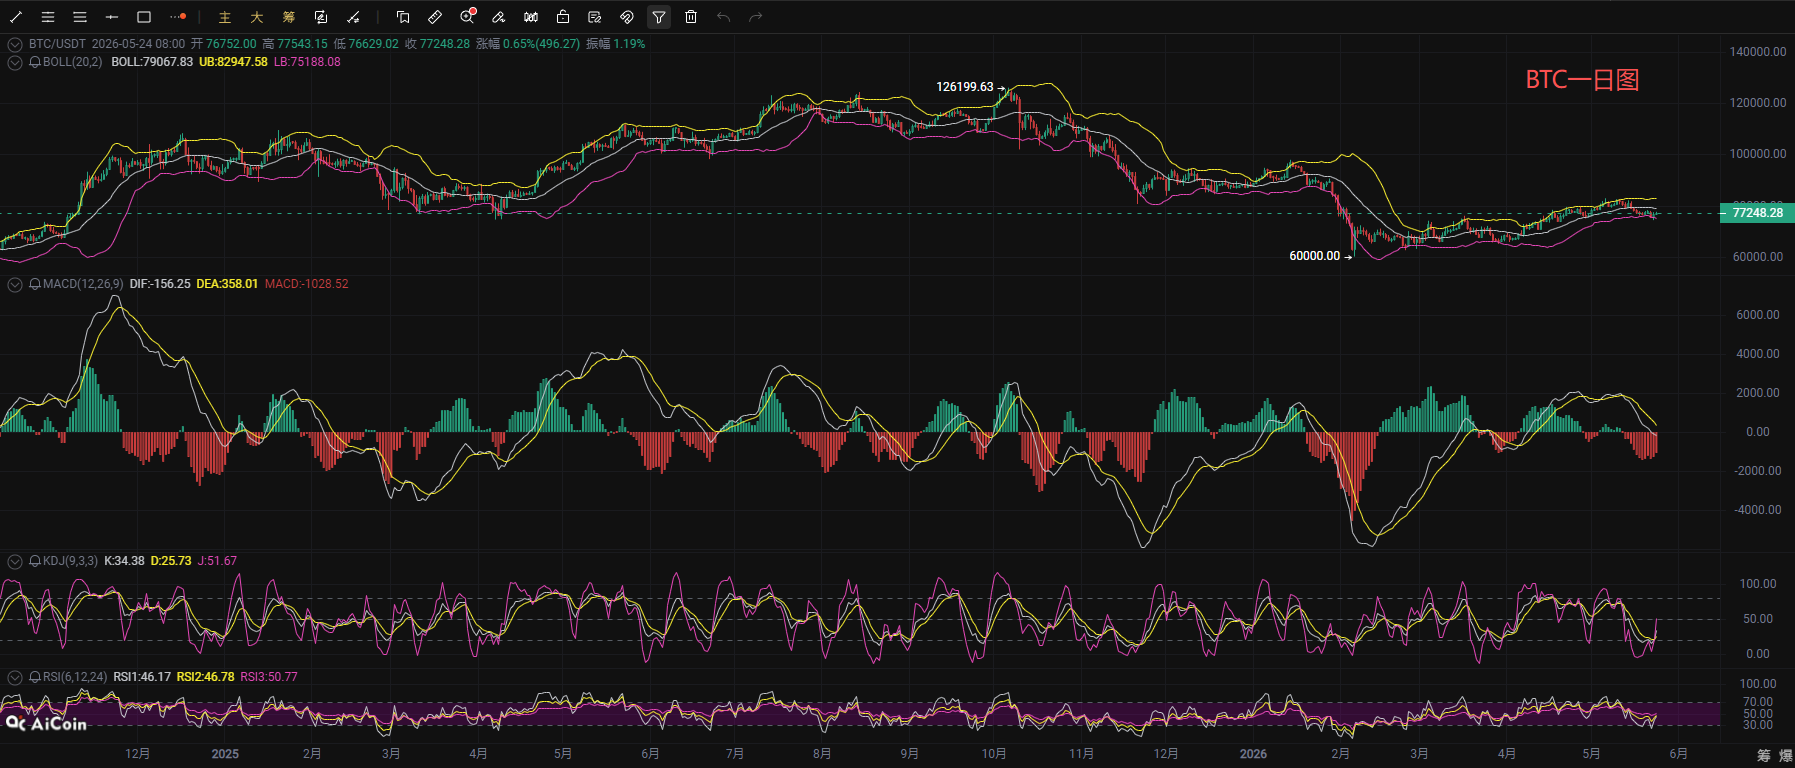
Bitcoin exhibited a typical long and short sweeping market over the weekend, currently oscillating above 77000. On the daily chart, the consolidation trend remains relatively weak, with the Bollinger Bands opening and the price under pressure from the middle track. The MACD bar is decreasing, the DIF line is operating below the DEA line and has not turned, while the short selling momentum has weakened but has not completely dissipated; the KDJ indicator has formed an effective golden cross at a low position; however, all three RSI lines are in the neutral bearish range below 50, indicating a lack of buying strength, and there is strong pressure from the EMA moving average at the 80000 level above. If there is no volume breakout in the short term, it is likely to maintain a weak oscillation, and the bearish trend has not yet reversed.
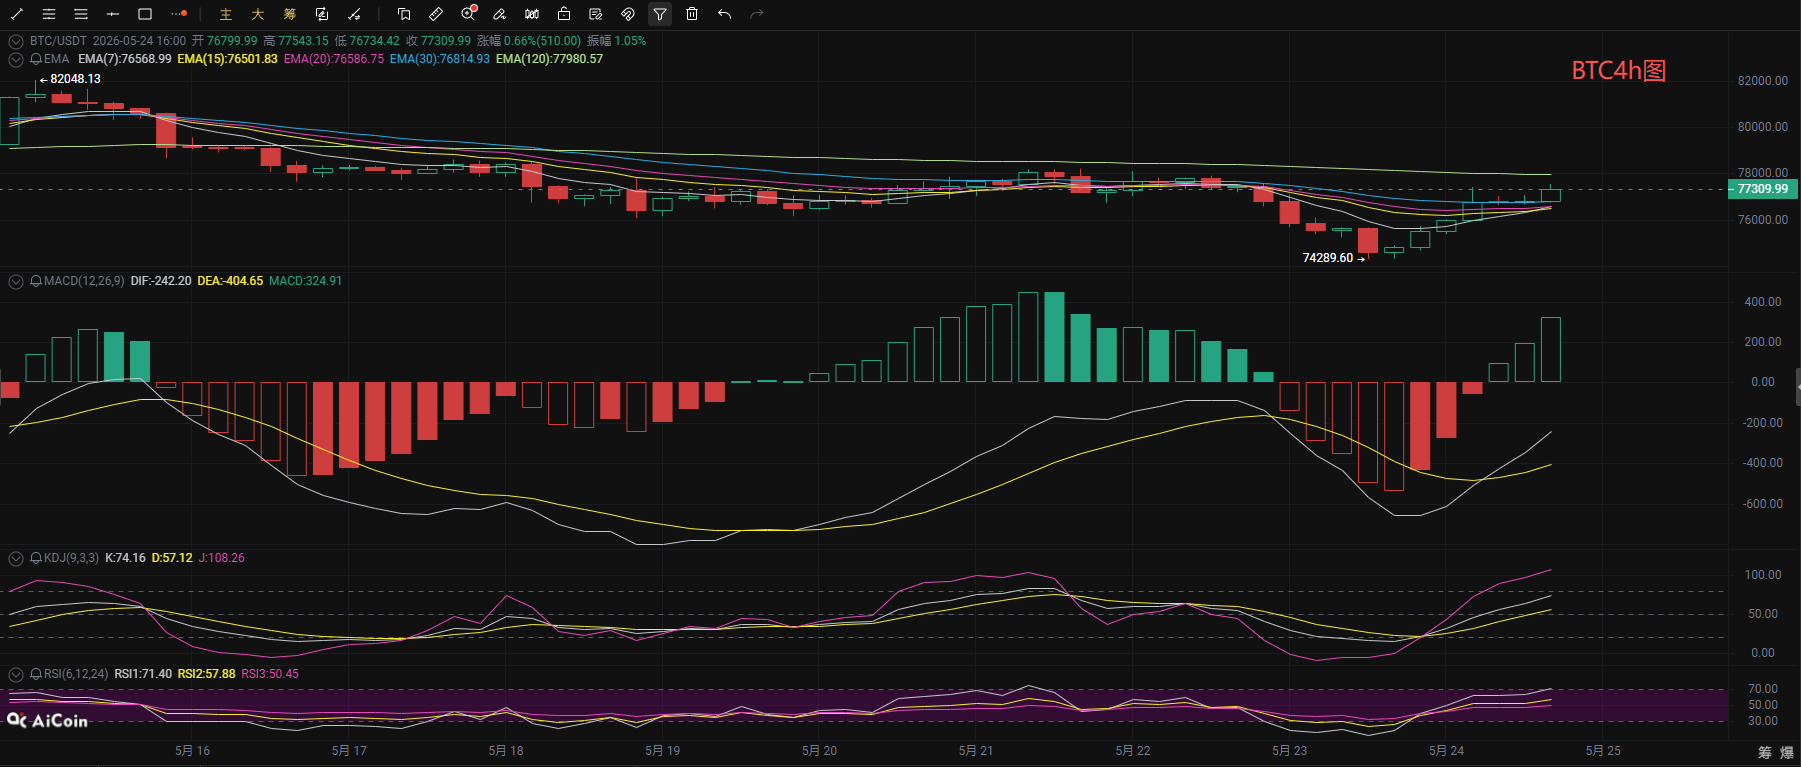
On the shorter 4-hour chart, BTC has staged a rebound and corrective movement, with the current price standing above the middle track and approaching the upper Bollinger Band. The MACD continues to increase, with the DIF line crossing above the DEA line to form a golden cross, indicating bullish momentum is being released; the three KDJ lines are diverging above 50, with K and D values continuously rising, positioned in a strong area; the three RSI lines have returned above 50, suggesting that bullish strength dominates in the short term. The price steadily rises along the short-term EMA moving average, with 76000 as short-term support; if this position can hold and rebound with volume, it is expected to continue; it is recommended to buy on dips in the low point.
Waves in the Currency Sea: May 24 Bitcoin Short-term Reference:
Long Position: Buy in the 75500-76500 range, stop loss at 500 points, target at 77000-78000,
Short Position: Sell in the 79000-78000 range, stop loss at 500 points, target at 77500-76500,
【The above analysis and strategies are for reference only. Please bear your own risks. The article's review and publication may be delayed, and the strategies may not be timely. Do not operate blindly】

This content is originally shared by 【Waves in the Currency Sea】 and only represents personal opinions. The article may have delays in transmission and is for reference only; do not operate blindly! Want to get more daily real-time trades? Then follow my public account! Here, you can engage in online technical learning of the market and learn about knowledge related to exiting positions. I have years of research experience in the market, focusing on the macro trends in the currency circle. I am mainly responsible for analyzing and guiding investments in BTC, ETH, SOL, BCH, and other currencies. Welcome to study and research together.
免责声明:本文章仅代表作者个人观点,不代表本平台的立场和观点。本文章仅供信息分享,不构成对任何人的任何投资建议。用户与作者之间的任何争议,与本平台无关。如网页中刊载的文章或图片涉及侵权,请提供相关的权利证明和身份证明发送邮件到support@aicoin.com,本平台相关工作人员将会进行核查。