Cryptocurrency Expert: On June 10, Ethereum's daily line presses downwards, and the 4-hour bounce hides traps! Latest market analysis and trading suggestions
Ethereum's current price is 1650, and it seems about to break below 1600. However, there was a wave of correction, indicating that the market will never move according to everyone's expectations. Each wave of correction provides another opportunity for high point adjustment and position recovery. At this moment, the risk far outweighs the opportunity; reduce holding pressure. For those out of the market, keep your hands off, wait for pressure levels to find short opportunities, or consider long positions only when support is clear and stable. The cryptocurrency world is not about how much profit can be made in a single instance, but rather about long-term stable risk control. Only by properly managing stop losses and position sizes can one survive in both rising and falling markets over time.
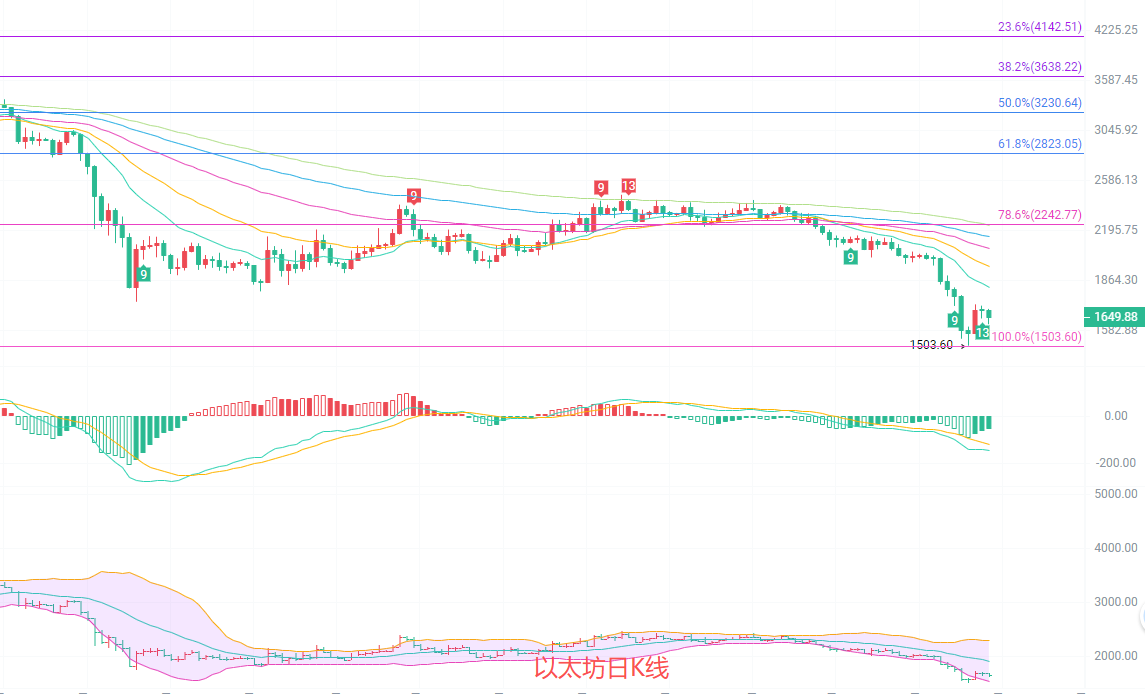
Yesterday's daily candlestick showed a bearish line retreat, with all EMA moving averages pointing downwards, and the price firmly below all moving averages, showing no signs of a rebound. The MACD dual lines are in the deep negative territory, and the length of the downward green bars continues to increase, with no signs of declining downward momentum. The Bollinger Bands are opening wider downwards, with the price running along the lower line at 1539, while the middle line at 1914 is a strong mid-term pressure level. The Fibonacci level of 0.786 at 2148 is far away, and there are no technical signals on the daily level indicating any bottoming out or trend reversal. The overall market maintains a weak downward tone.
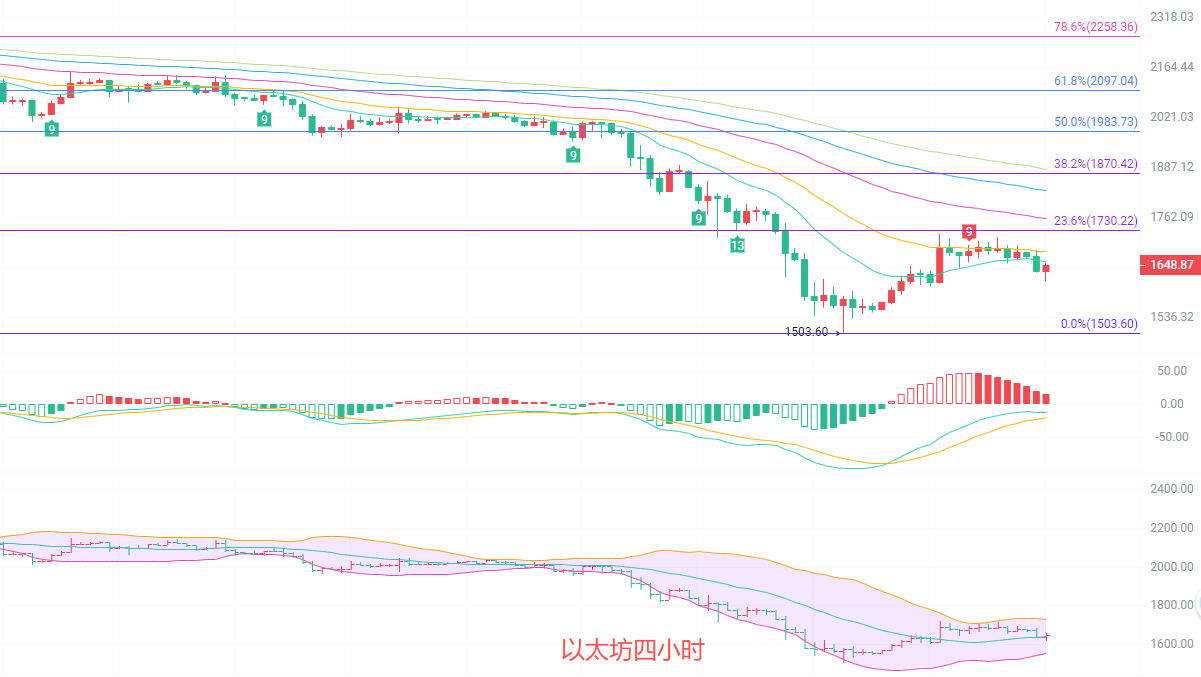
The four-hour candlestick shows a slight bullish line attempting to repair the oversold market, but the rebound strength is weak and powerless. In the short term, the 15 and 30 EMA moving averages are pressing down on prices, while the 60 and longer-term moving averages continue to decline, maintaining the integrity of the larger downward structure. The MACD has formed a micro golden cross in the negative zone, with a slight increase in the red bars, serving merely as a technical correction rebound after a significant drop, which doesn't alter the major downward trend. The Bollinger Bands channel is widening downwards, with the lower line at 1553 being the core support in the short term, and the upper line at 1731 being the first resistance to the rebound. The Fibonacci 0.236 retracement level is right at 1730, and the current price is still some distance from this resistance. The space for a 4-hour rebound is limited, and after encountering resistance at a high, it is highly probable to retreat again.
Short-term reference:
From the upper level of 1720 to 1750 to move downwards, with a stop loss at 1800, targeting 1650 to 1550.
From the lower level of 1600 to 1550 to move upwards, with a stop loss at 1500, targeting 1650 to 1720.
Specific operations should be based on real-time market data. For more detailed information, you can consult the author. Note that the publication of this article may be delayed, and it is suggested for reference only at your own risk.

Warm reminder: The above content is created by the author on the public account. The advertisements at the end of the article and in the comments are unrelated to the author. Please discern carefully. Thank you for reading.
免责声明:本文章仅代表作者个人观点,不代表本平台的立场和观点。本文章仅供信息分享,不构成对任何人的任何投资建议。用户与作者之间的任何争议,与本平台无关。如网页中刊载的文章或图片涉及侵权,请提供相关的权利证明和身份证明发送邮件到support@aicoin.com,本平台相关工作人员将会进行核查。