Crypto Circle Expert: On June 10, the Bitcoin daily line's Bollinger lower track supports the bottom, while the 4-hour moving average suppresses the rebound height! Latest market analysis and operational advice
The current price of Bitcoin is 61700. Let me first say that the downward pattern of the big coin is not to heavily bottom fish, all positions should have a tight stop loss, avoiding the risk of holding on to losing positions. What the market fears most now is fantasizing about a big reversal. After such a significant drop, it cannot be reversed by just one bullish candle. Although the short-term rebound looks promising, it is actually just an opportunity for those who are trapped to reduce their positions. Bottom fishing requires patience to wait for clear stabilization signals. Many people lose a large amount of money because they frequently buy heavily during the decline, averaging down until they can no longer bear it and cut losses at the lowest point. It's alright to operate slowly; let's slowly layout together
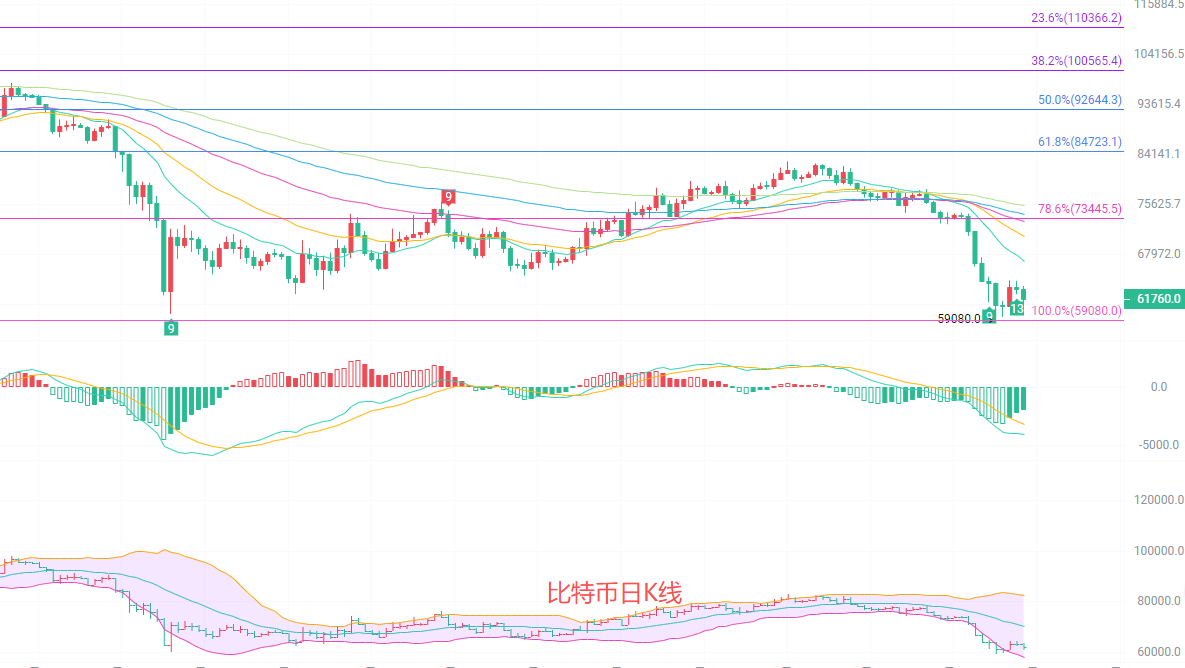
The daily K-line is overall in a weak repair phase after a deep decline. The previous high of 82828 has fallen to a low of 59080, completing a full Fibonacci 100% retracement of the large drop. The moving average system is entirely in a downward arrangement, with EMA15, 30, 60, and 120 pressing down in layers from top to bottom, and the price is far below all medium and long-term moving averages. The upper level of 73445 (at the 0.786 Fibonacci level) is the first major resistance. The daily MACD maintains a death cross, with the DIF far below the DEA. The green histogram shows increasing downward momentum; the Bollinger Bands are opening downwards, with the price operating close to the lower track at 57987. There are currently no signs of bottom reversal on the daily level, and the rebound is only defined as a repair in the downward continuation.
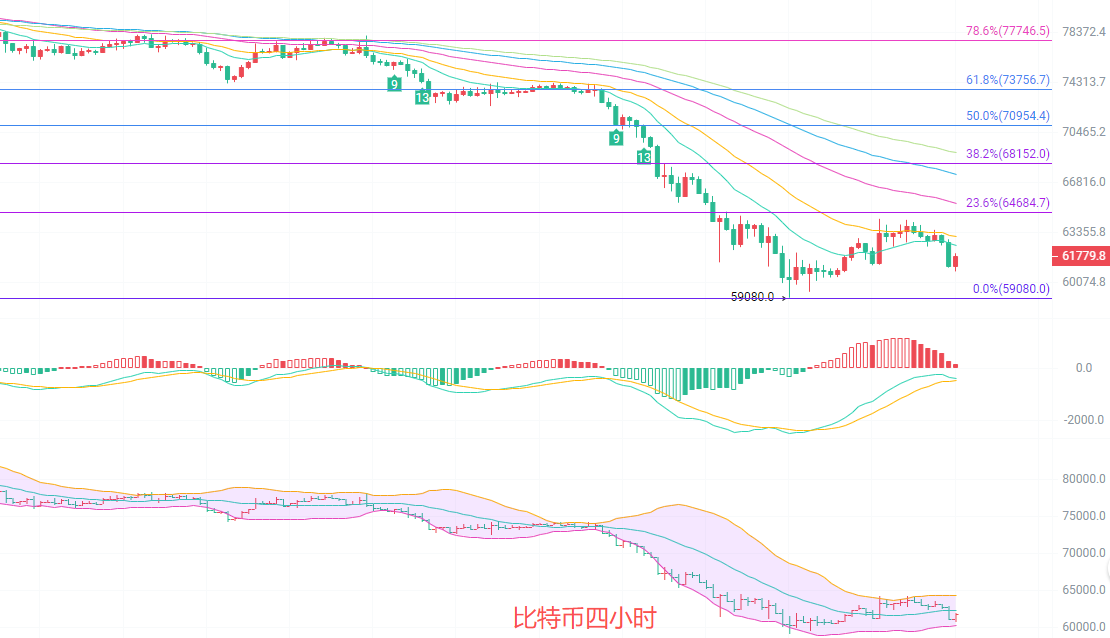
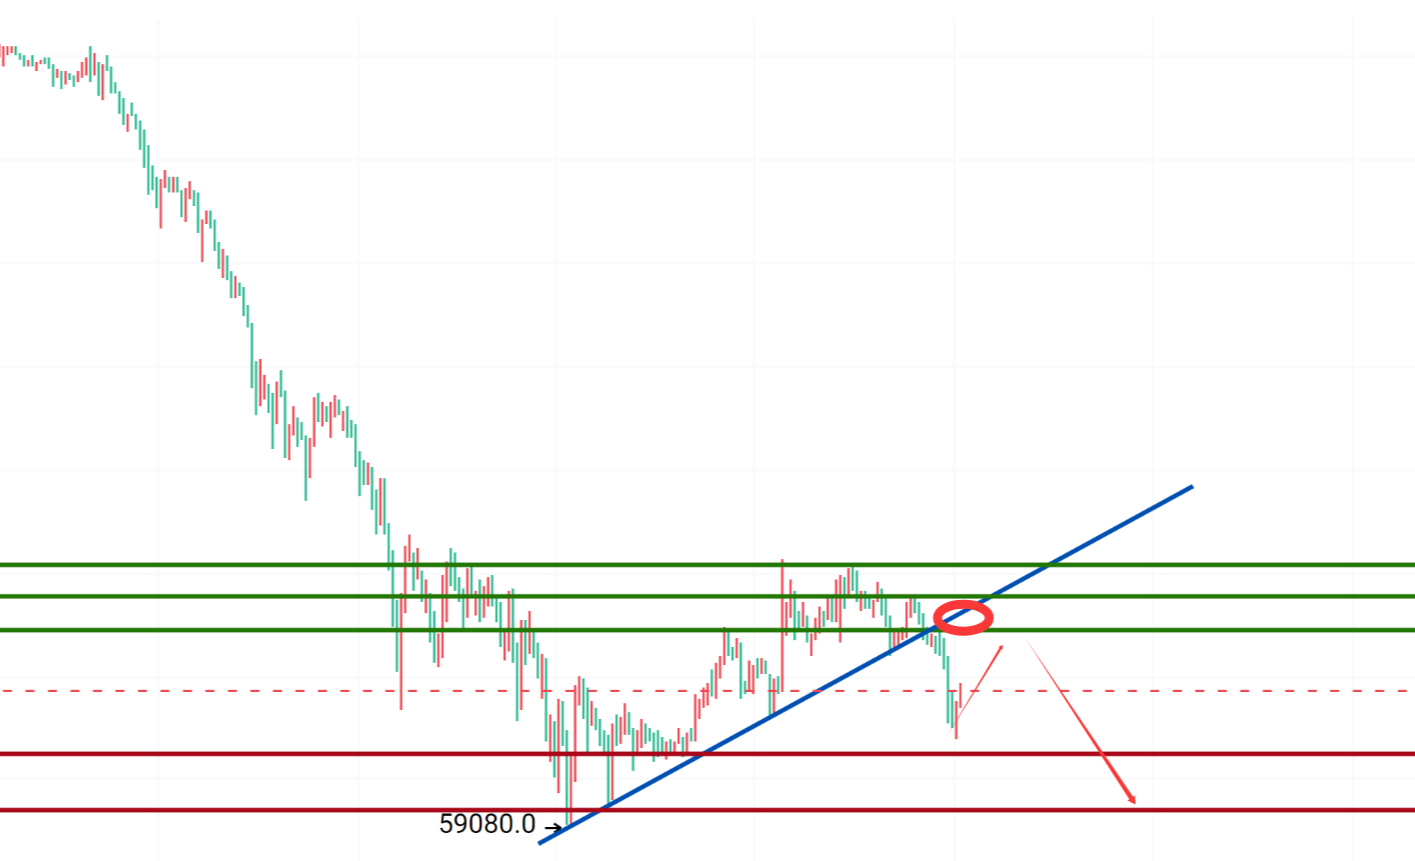
The 4-hour K-line has made a slight rebound, but is again pressured to drop. The Fibonacci supports from the wave high of 82828 to the low of 59080, with the 0% level at 59080 being the current bottom support. The 0.236 rebound level at 64684 and the 0.382 position at 68152 form two short-term pressures. The short-term EMA15 and EMA30 firmly suppress the price, and the K-line cannot stand above the short-term moving averages. Although the 4-hour MACD shows signs of a contracting red histogram, the upward rebound momentum is quickly fading; the middle track of the Bollinger Bands at 63436 forms strong pressure, while the lower track at 60365 provides bottom support. The 4-hour fluctuation range is locked at 60300-64600, operating weakly within the range, with strengthless rebounds needing to test the bottom support again
Short-term thought reference: Follow the trend of the larger cycle, small stop losses, quick entries and exits
Buying up from 60000 to 59500, stop loss at 59000, target looking at 61000 to 62000
Selling down from 63000 to 63500, stop loss at 64000, target looking at 62000 to 61000
Specific operations should be based on real-time market data. For more information details, you can consult the author. There may be a delay in article publication, so it is recommended for reference only, and risks are to be borne by oneself

Friendly Reminder: The above content is only created by the author on Weibo. The advertisements at the end of the article and in the comments section are not related to the author. Please discern carefully, and thank you for reading
免责声明:本文章仅代表作者个人观点,不代表本平台的立场和观点。本文章仅供信息分享,不构成对任何人的任何投资建议。用户与作者之间的任何争议,与本平台无关。如网页中刊载的文章或图片涉及侵权,请提供相关的权利证明和身份证明发送邮件到support@aicoin.com,本平台相关工作人员将会进行核查。