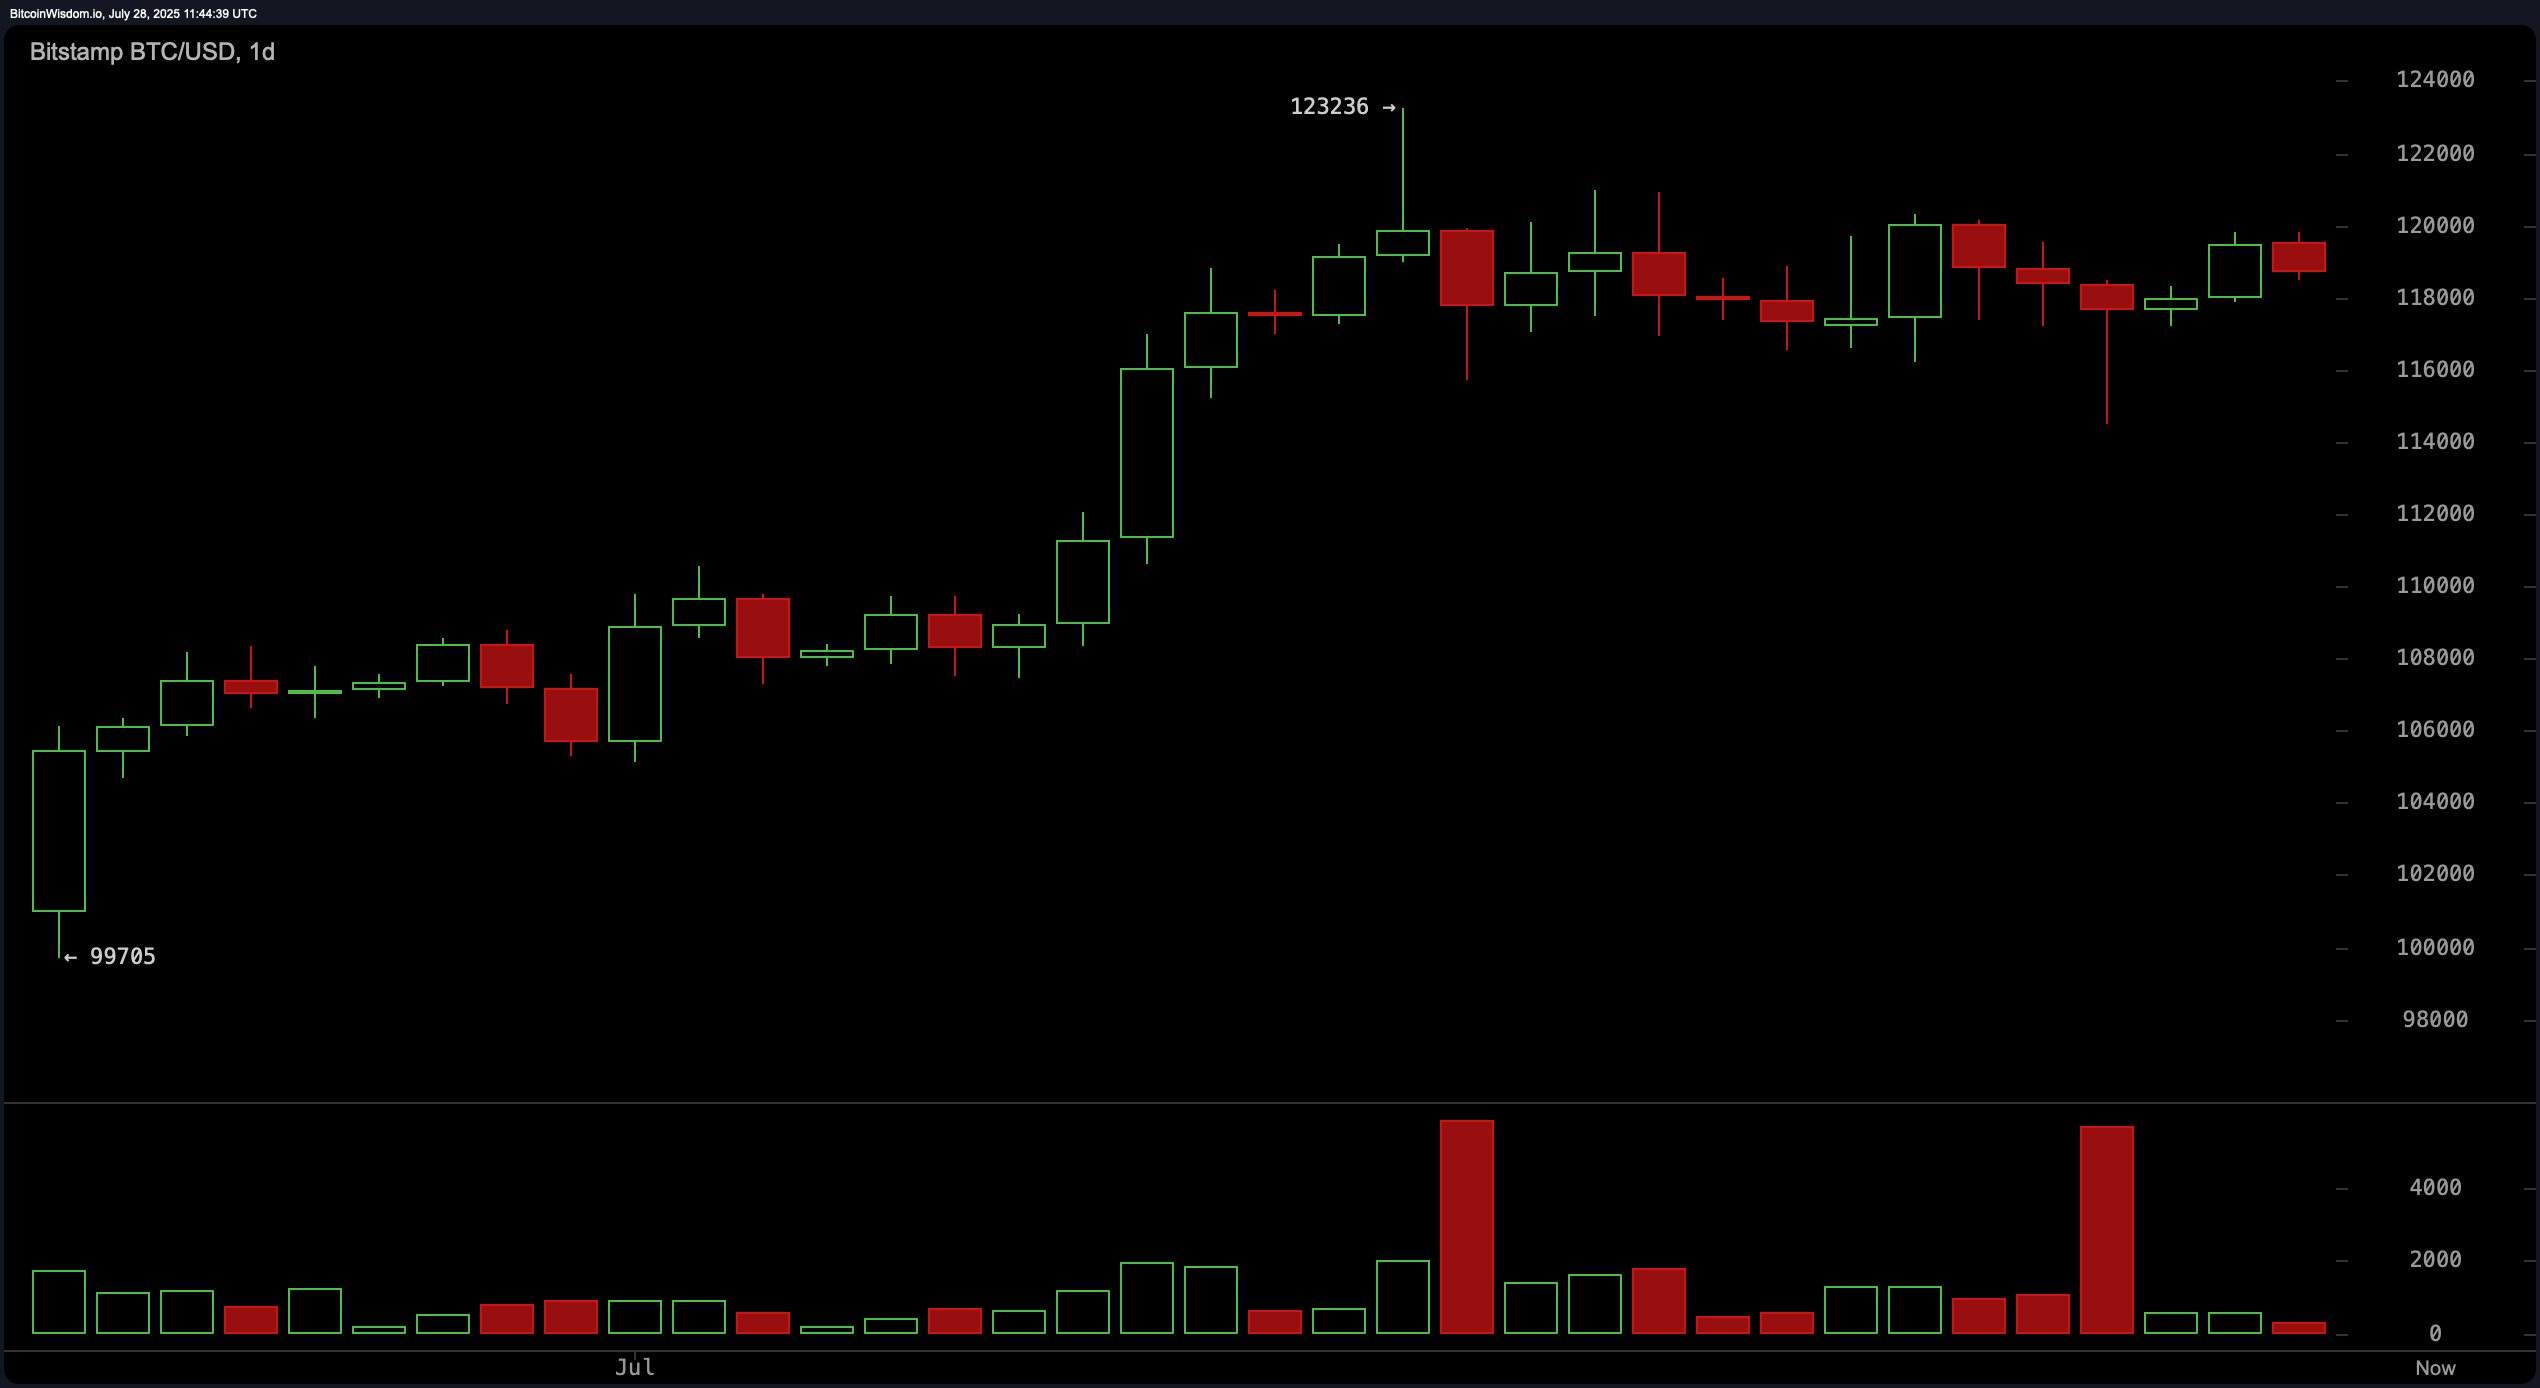
On the daily chart, bitcoin remains in an uptrend from its base around $99,700, though recent candles indicate plateauing around the $119,000 to $120,000 zone. A volume spike leading up to a peak at $123,236, followed by declining volume, suggests buyer exhaustion. Long upper wicks on recent candles also imply rejection at higher levels, reinforcing the possibility of a distribution phase. Traders are advised to watch for a pullback to the $114,000–$116,000 support area, with entry signals hinging on bullish reversal patterns.

BTC/USD 1-day chart via Bitstamp on July 28, 2025.
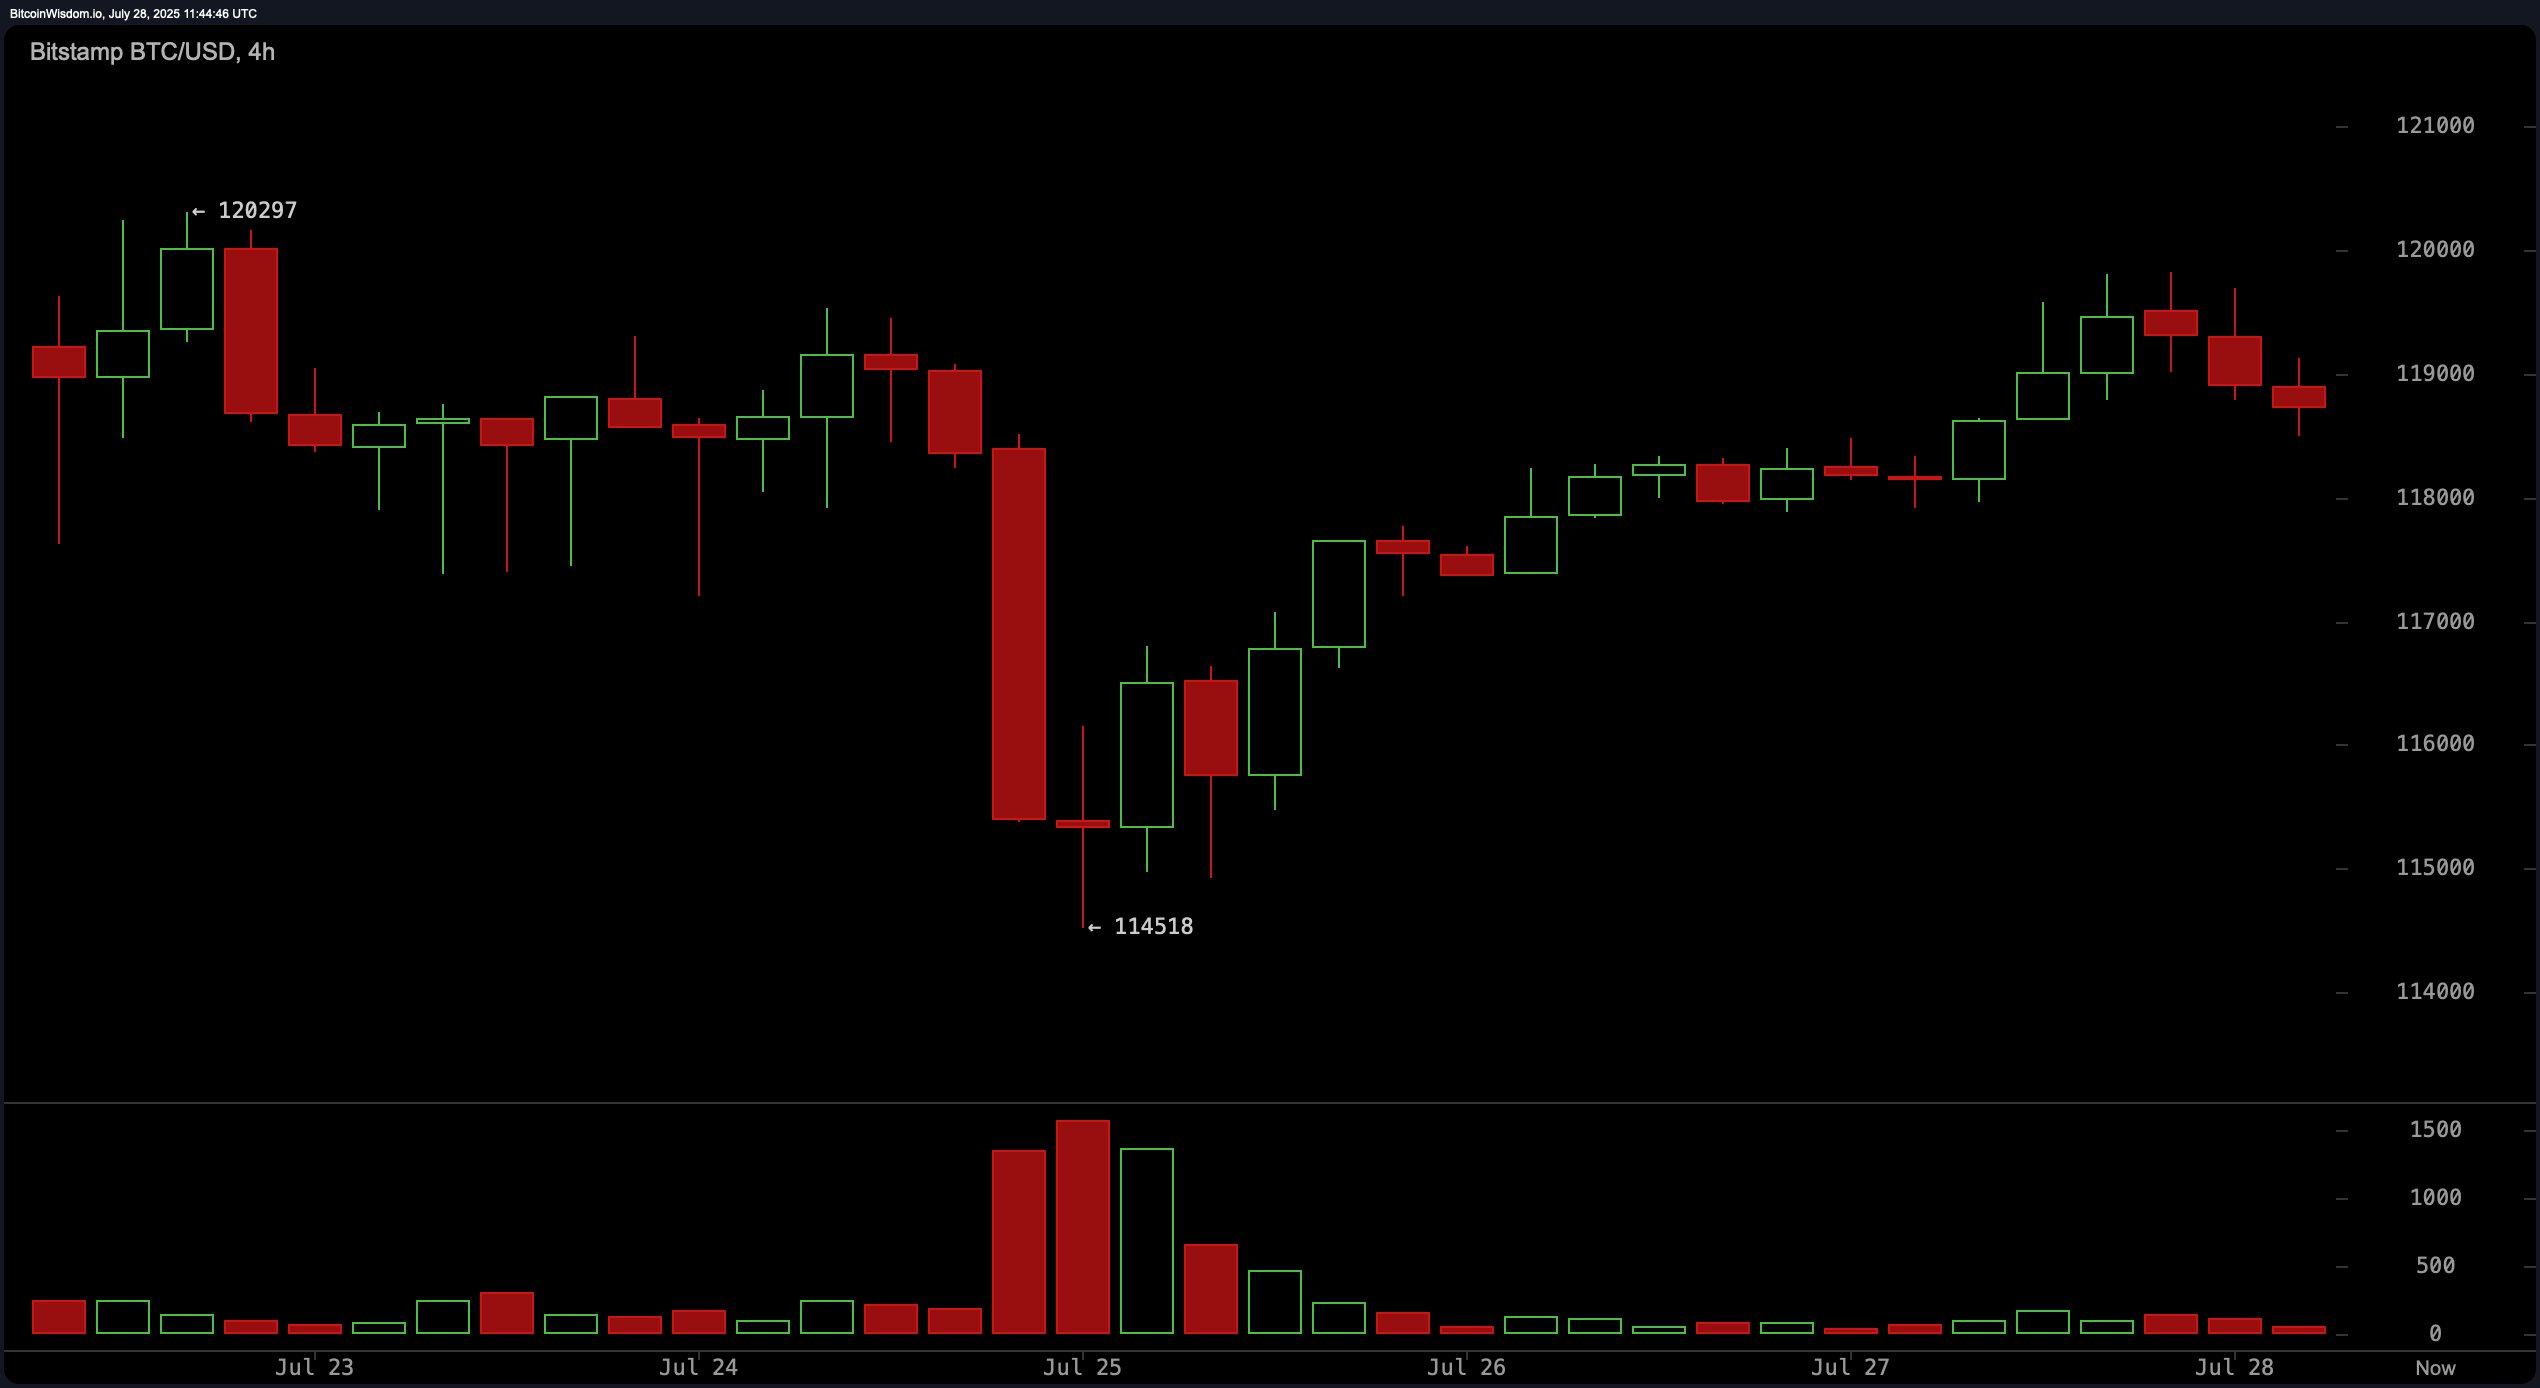
On the 4-hour chart, bitcoin experienced a sharp sell-off from $120,297 to $114,518, followed by a swift V-shaped recovery. However, the rally stalled around $119,500–$120,000, and subsequent candles show a series of lower highs, indicating weakening upward momentum. A potential entry exists if the price rebounds from the $116,500–$117,000 zone with volume confirmation. Aggressive traders may consider entering above $119,800 if strong buying volume returns. If the price breaks below $114,000, this would invalidate bullish setups, prompting exits.

BTC/USD 4-hour chart via Bitstamp on July 28, 2025.
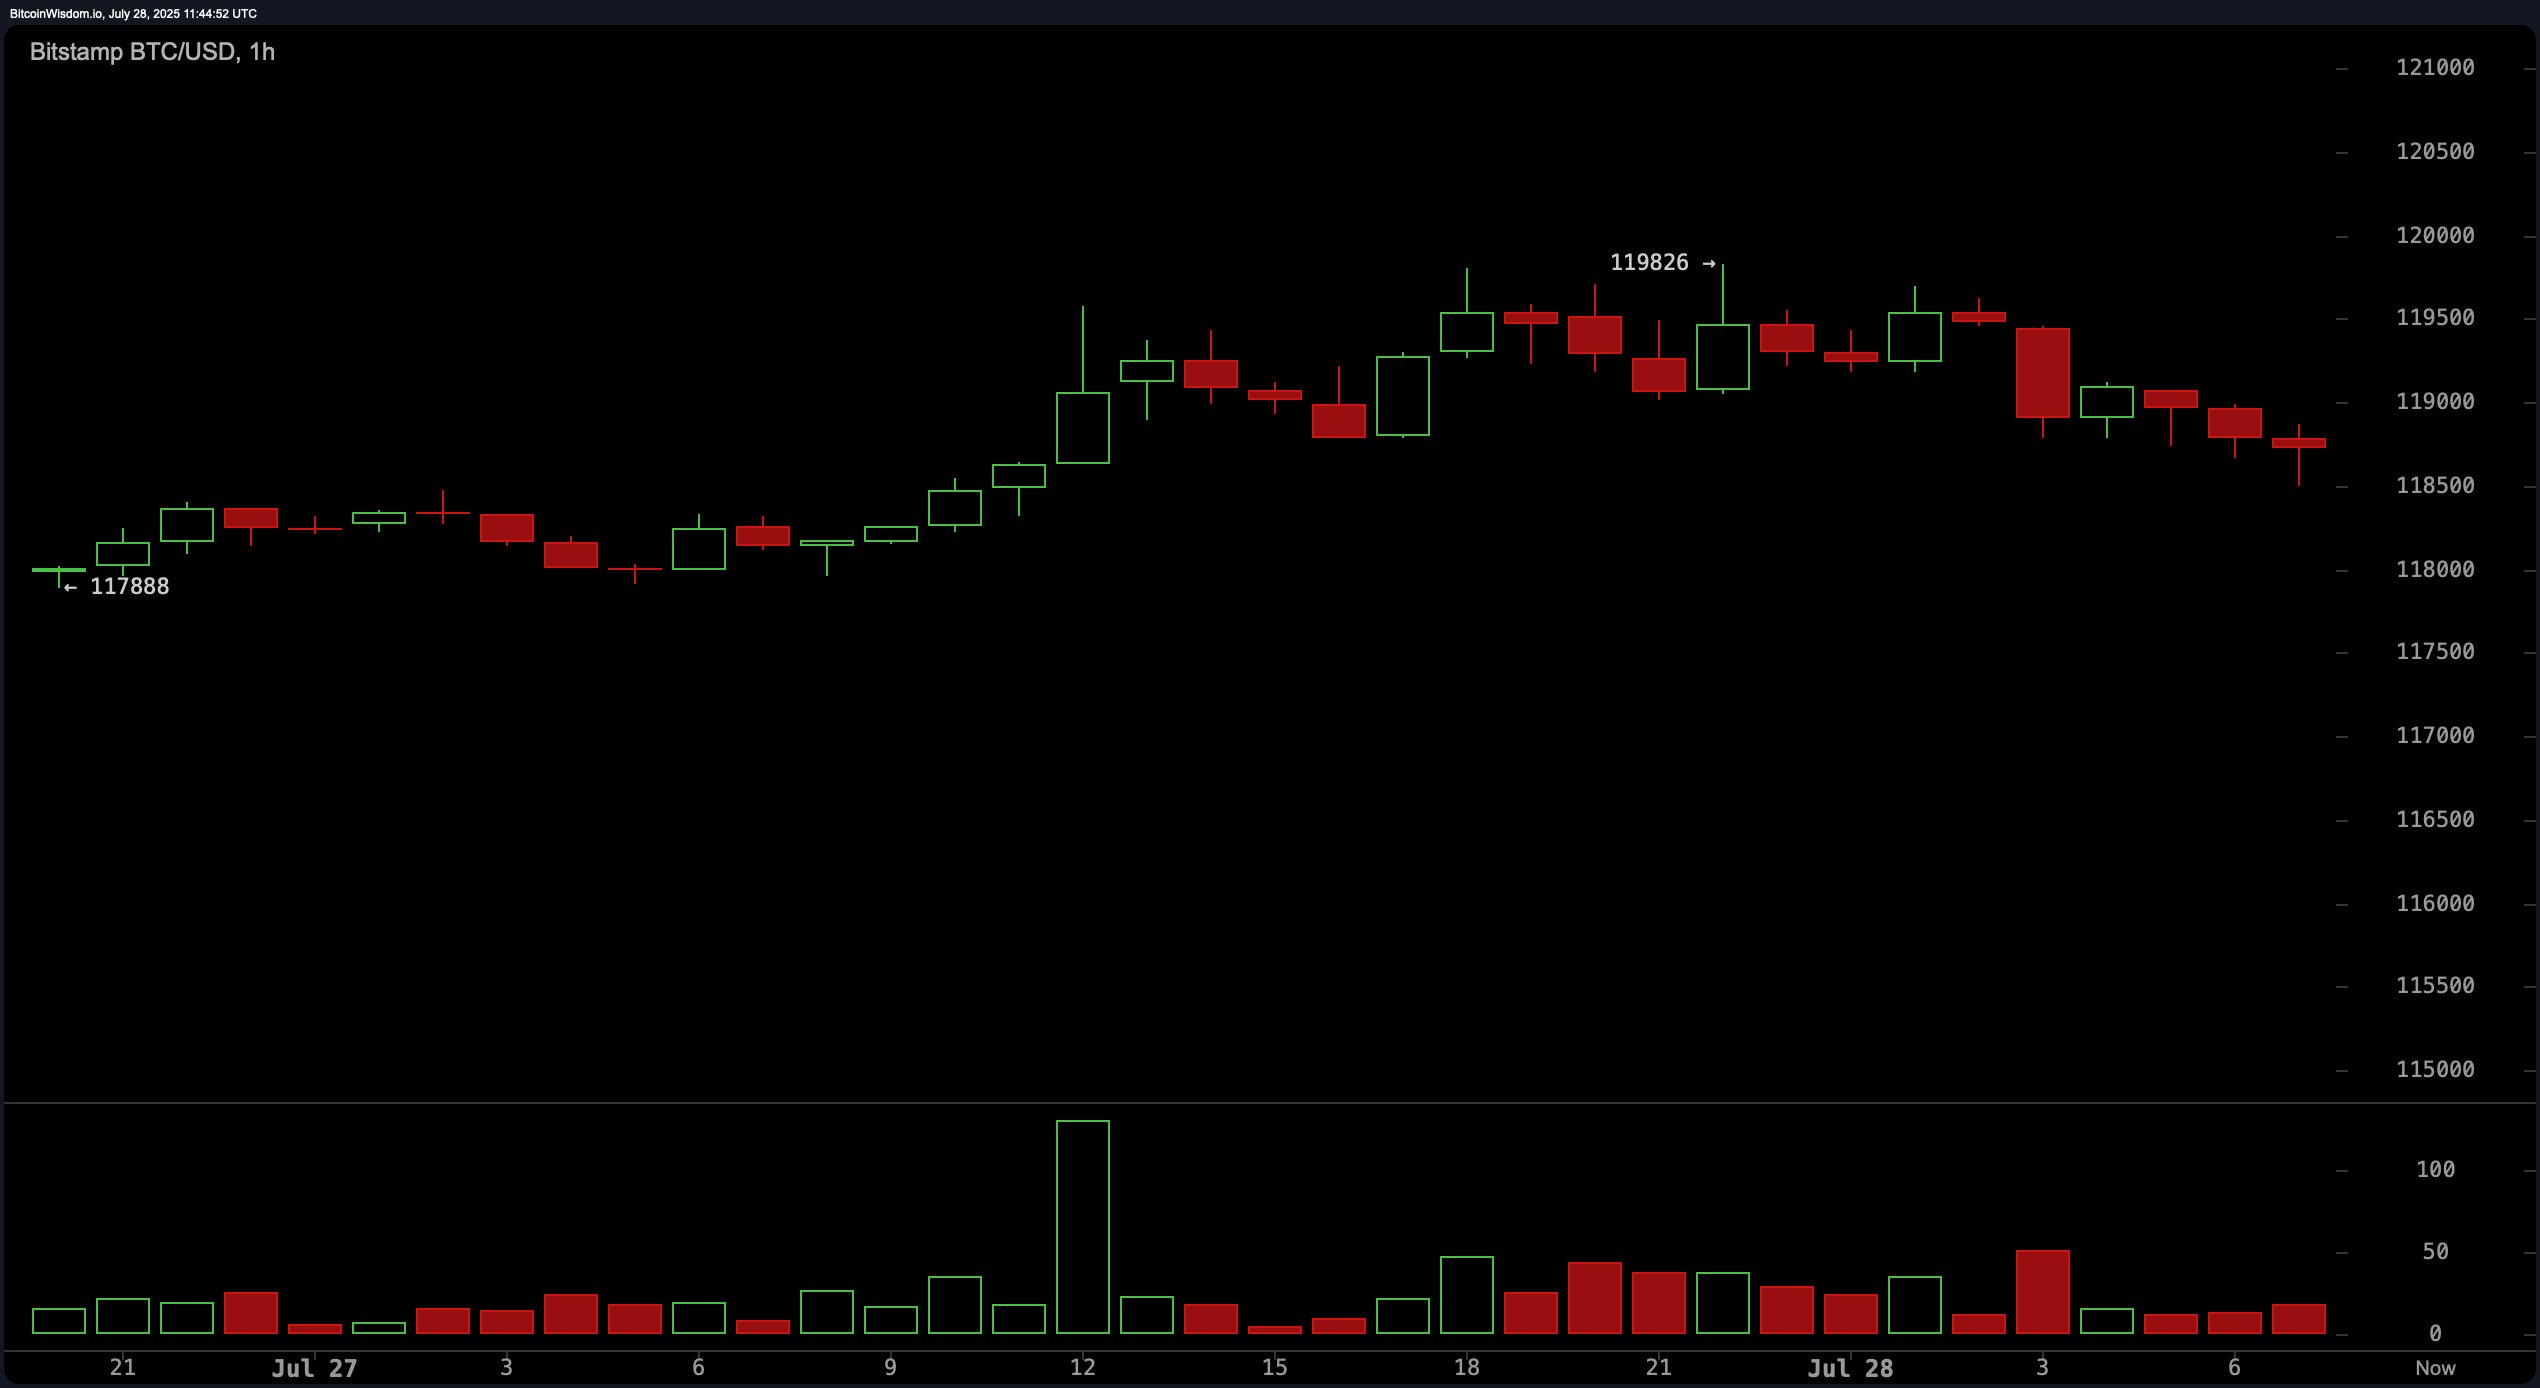
The 1-hour bitcoin chart reveals a range-bound structure between $117,900 and $119,800, with increasing bearish pressure and a sequence of lower highs. Traders should seek long positions only if the price holds above $118,000, supported by green candle volume. Short-term scalping may be viable between $117,800 and $118,000. Target exits are set around $119,800, with a stop-loss below $117,500 to guard against trend reversals.

BTC/USD 1-hour chart via Bitstamp on July 28, 2025.
Oscillator readings largely remain neutral, indicating indecision in the market. The relative strength index (RSI) stands at 61, while the Stochastic oscillator and the commodity channel index (CCI) read 54 and 67, respectively—each signaling neutrality. The average directional index (ADX) at 26 confirms a weak trend, and the Awesome oscillator shows a value of 4,468, also neutral. The momentum indicator is the sole bullish signal with a reading of 747, while the moving average convergence divergence (MACD) level at 2,230 signals bearish sentiment.
Moving averages (MAs) paint a broadly bullish picture across all major periods. The exponential moving averages (EMAs) and simple moving averages (SMAs) from 10 to 200 periods all indicate a bullish direction, pointing to the prevailing uptrend despite recent consolidation. Notably, the 10-period EMA and SMA hover around $118,304 and $118,372, respectively, aligning closely with current price levels and potentially providing short-term support.
Bull Verdict:
Bitcoin continues to demonstrate underlying strength with all major moving averages signaling a buy, suggesting that the broader uptrend remains intact. If volume returns and price breaks convincingly above $120,000, bulls may regain control, pushing bitcoin toward a retest of the $123,000–$124,000 resistance zone.
Bear Verdict:
Despite the prevailing uptrend, declining momentum and multiple rejections near $120,000 point to potential exhaustion. If bitcoin fails to hold above key support at $117,500 and breaks below $114,000, bearish pressure could intensify, triggering a deeper retracement toward lower support zones.
免责声明:本文章仅代表作者个人观点,不代表本平台的立场和观点。本文章仅供信息分享,不构成对任何人的任何投资建议。用户与作者之间的任何争议,与本平台无关。如网页中刊载的文章或图片涉及侵权,请提供相关的权利证明和身份证明发送邮件到support@aicoin.com,本平台相关工作人员将会进行核查。


