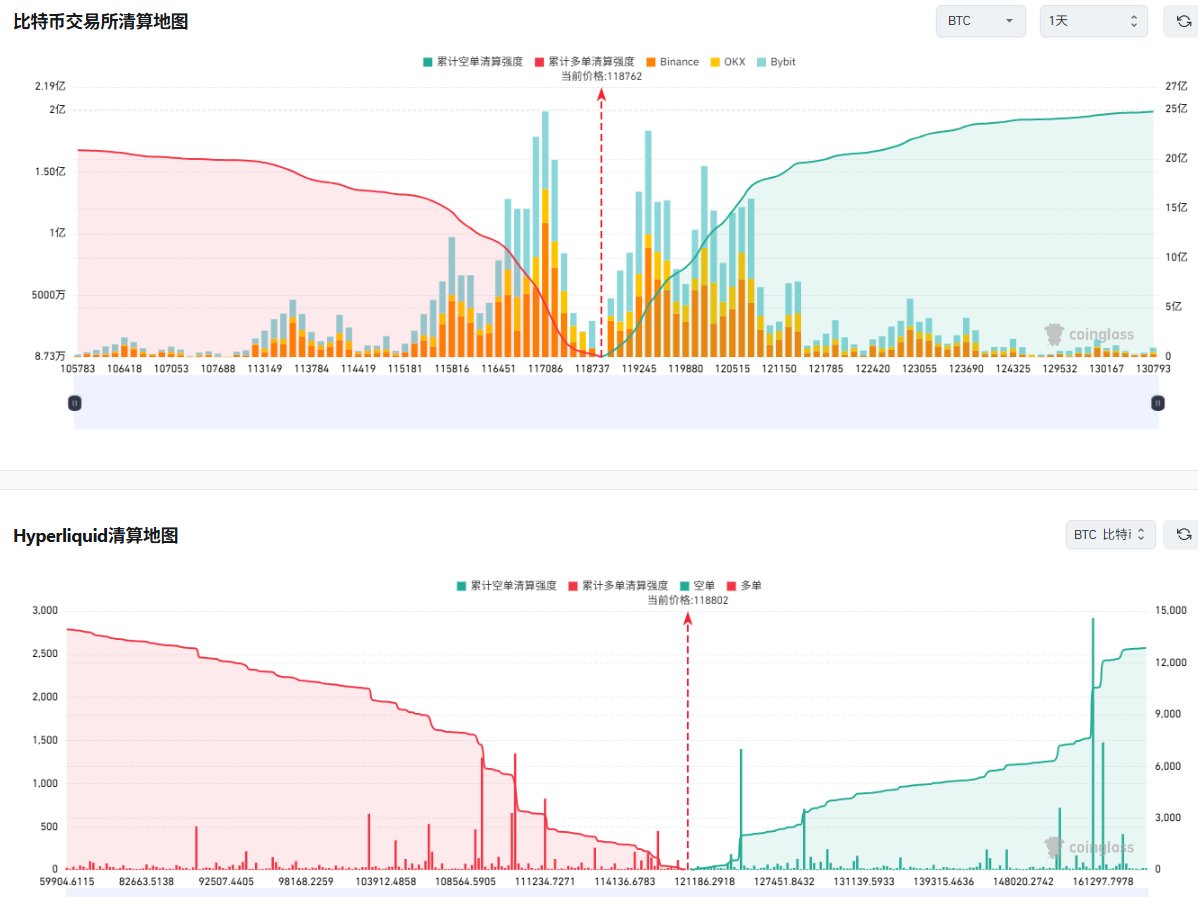
📊 Looking at this liquidation distribution chart, the divergence between long and short positions is clearly visible—
At the current price of $BTC around $118,700, the dense liquidation zones on both sides have formed a typical sandwich zone:
👈 Looking down, the long liquidation zone is concentrated in the range of $116,000–$117,000.
👉 Looking up, the short liquidation zone hangs in the range of $119,000–$121,000, with a liquidation intensity exceeding $2.5 billion. As long as the price breaks through, it could ignite a forced buying rally.
Don't be afraid—where there is divergence, there is price; where there is emotion, there is opportunity.
The more hesitant the market, the more it indicates that both sides are betting;
The more entangled the chips, the more it suggests that the upcoming breakout is worth looking forward to!
免责声明:本文章仅代表作者个人观点,不代表本平台的立场和观点。本文章仅供信息分享,不构成对任何人的任何投资建议。用户与作者之间的任何争议,与本平台无关。如网页中刊载的文章或图片涉及侵权,请提供相关的权利证明和身份证明发送邮件到support@aicoin.com,本平台相关工作人员将会进行核查。


