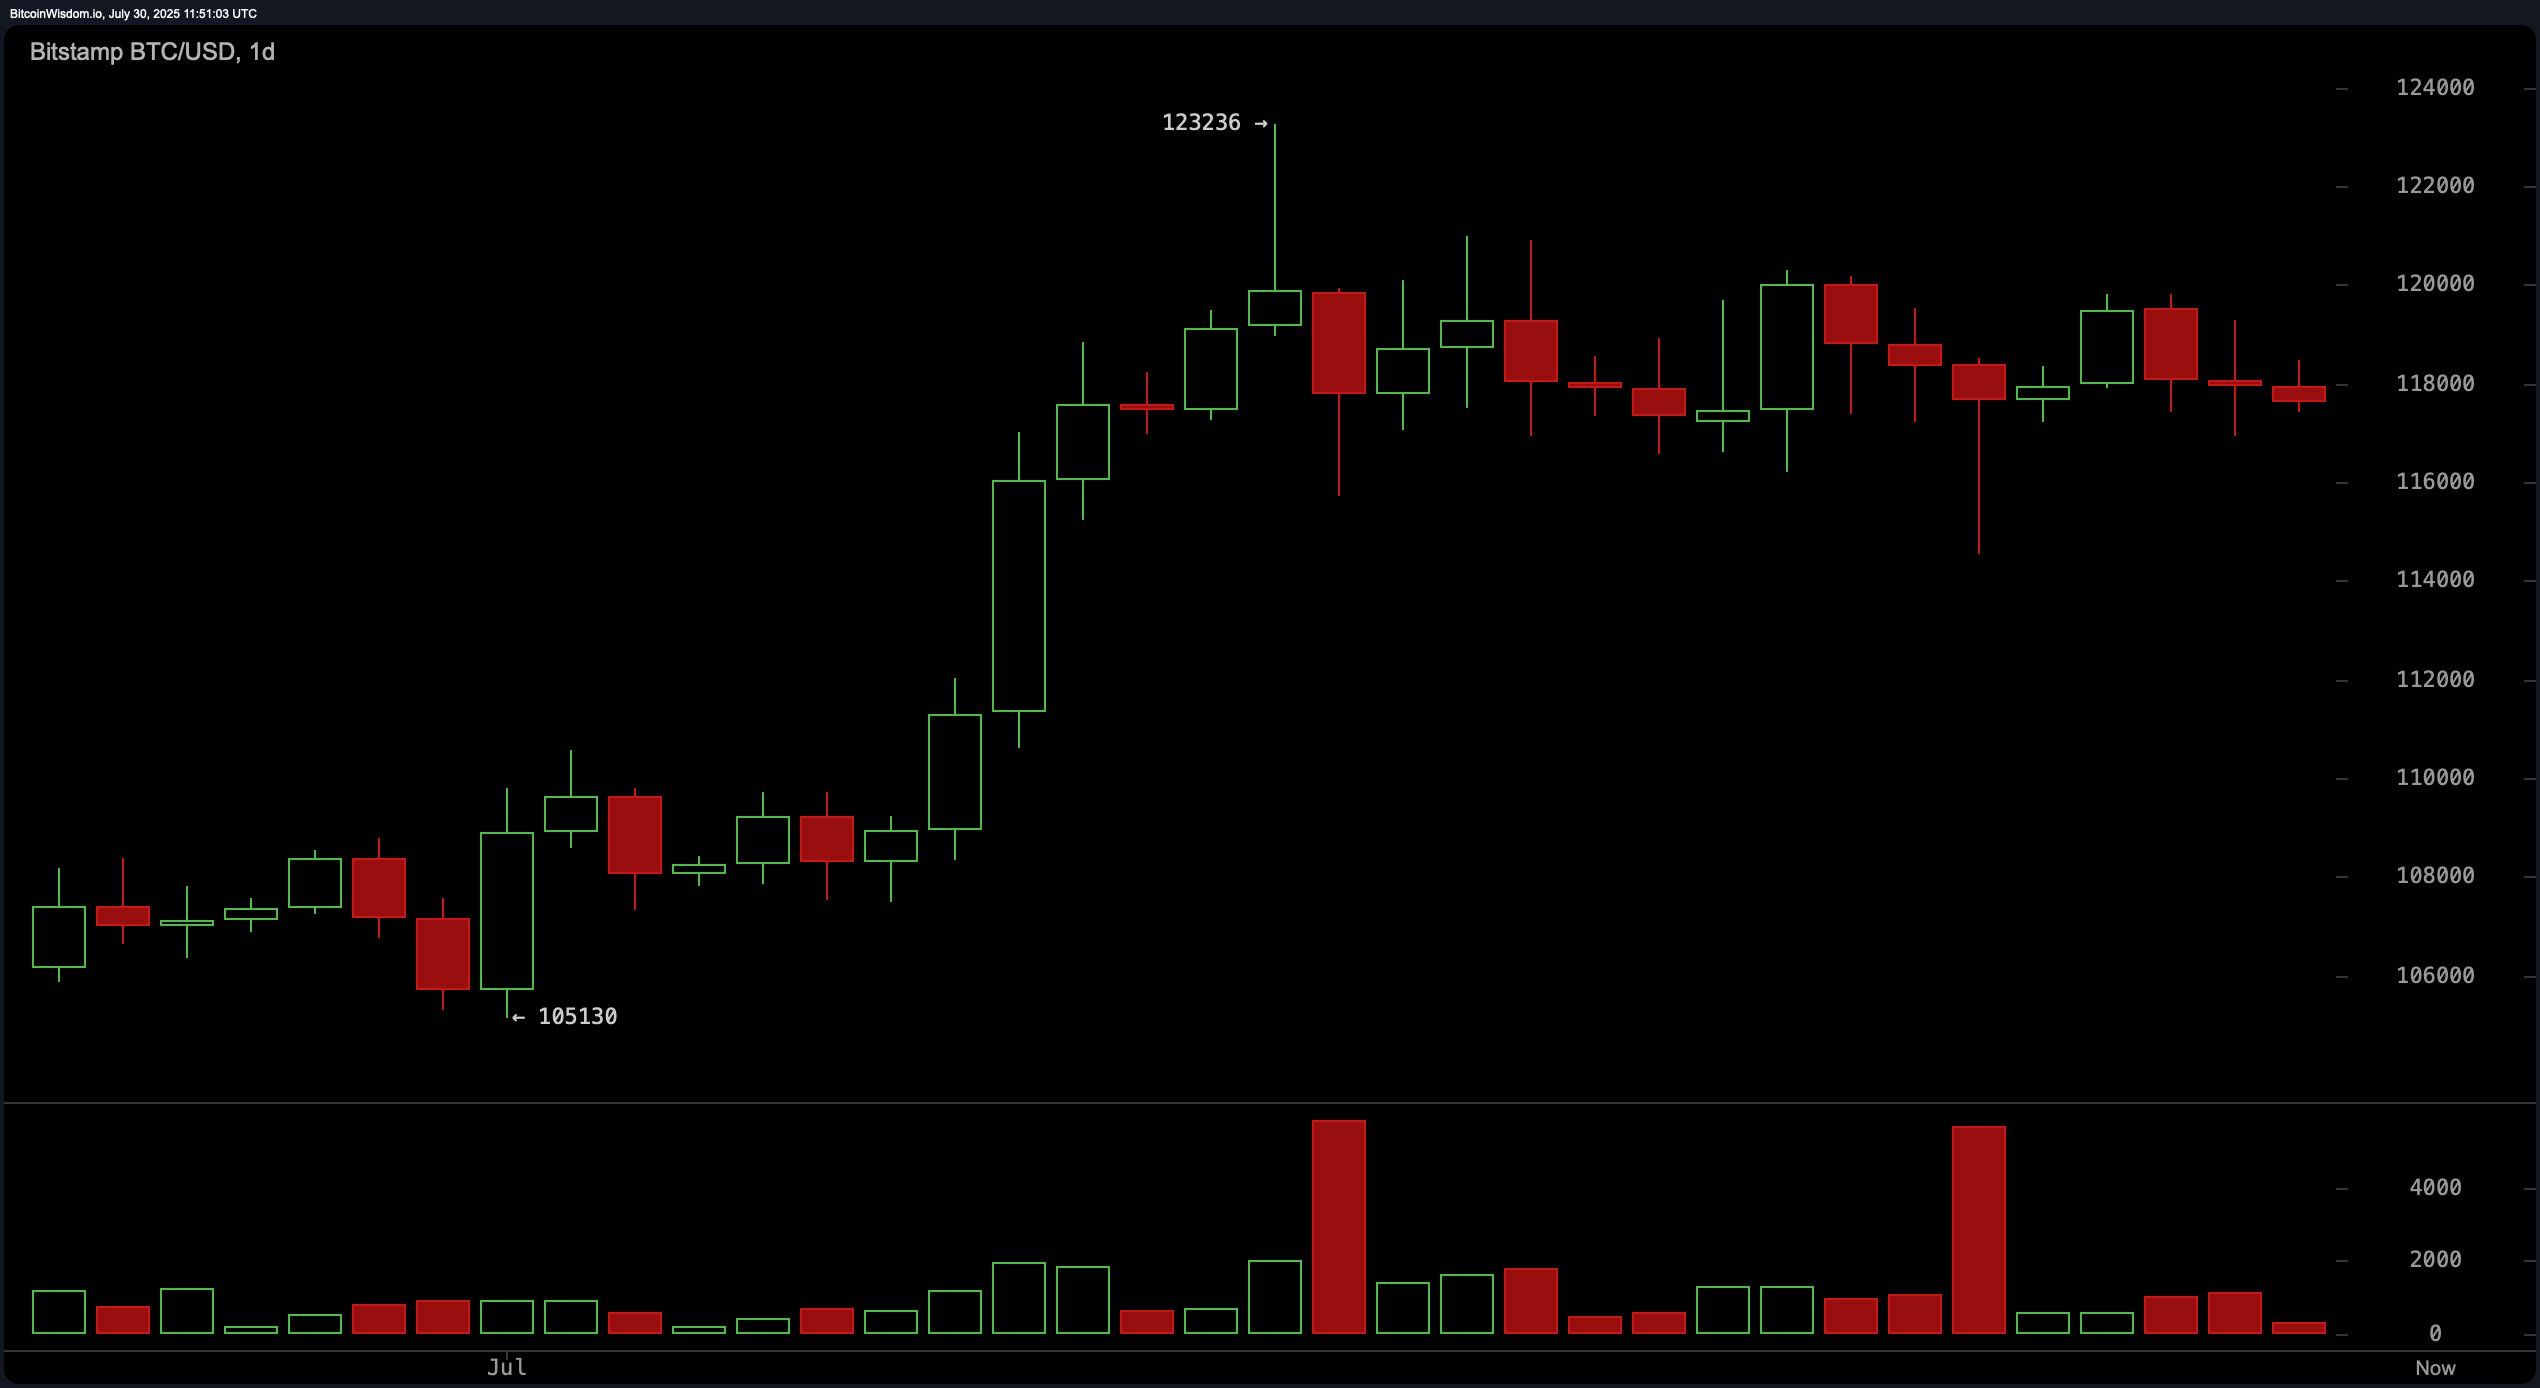
On the daily chart, bitcoin continues to hold its longer-term uptrend, advancing from approximately $105,130 to a peak of $123,236. However, it is currently encountering resistance between $118,000 and $120,000, evidenced by price rejection wicks and tapering volume. While the momentum is weakening, support appears to be forming in the $116,000 to $117,000 zone. This suggests that unless a breakout is supported by rising volume, bitcoin may continue its consolidation pattern near these levels.

BTC/USD 1-day chart via Bitstamp on July 30, 2025.
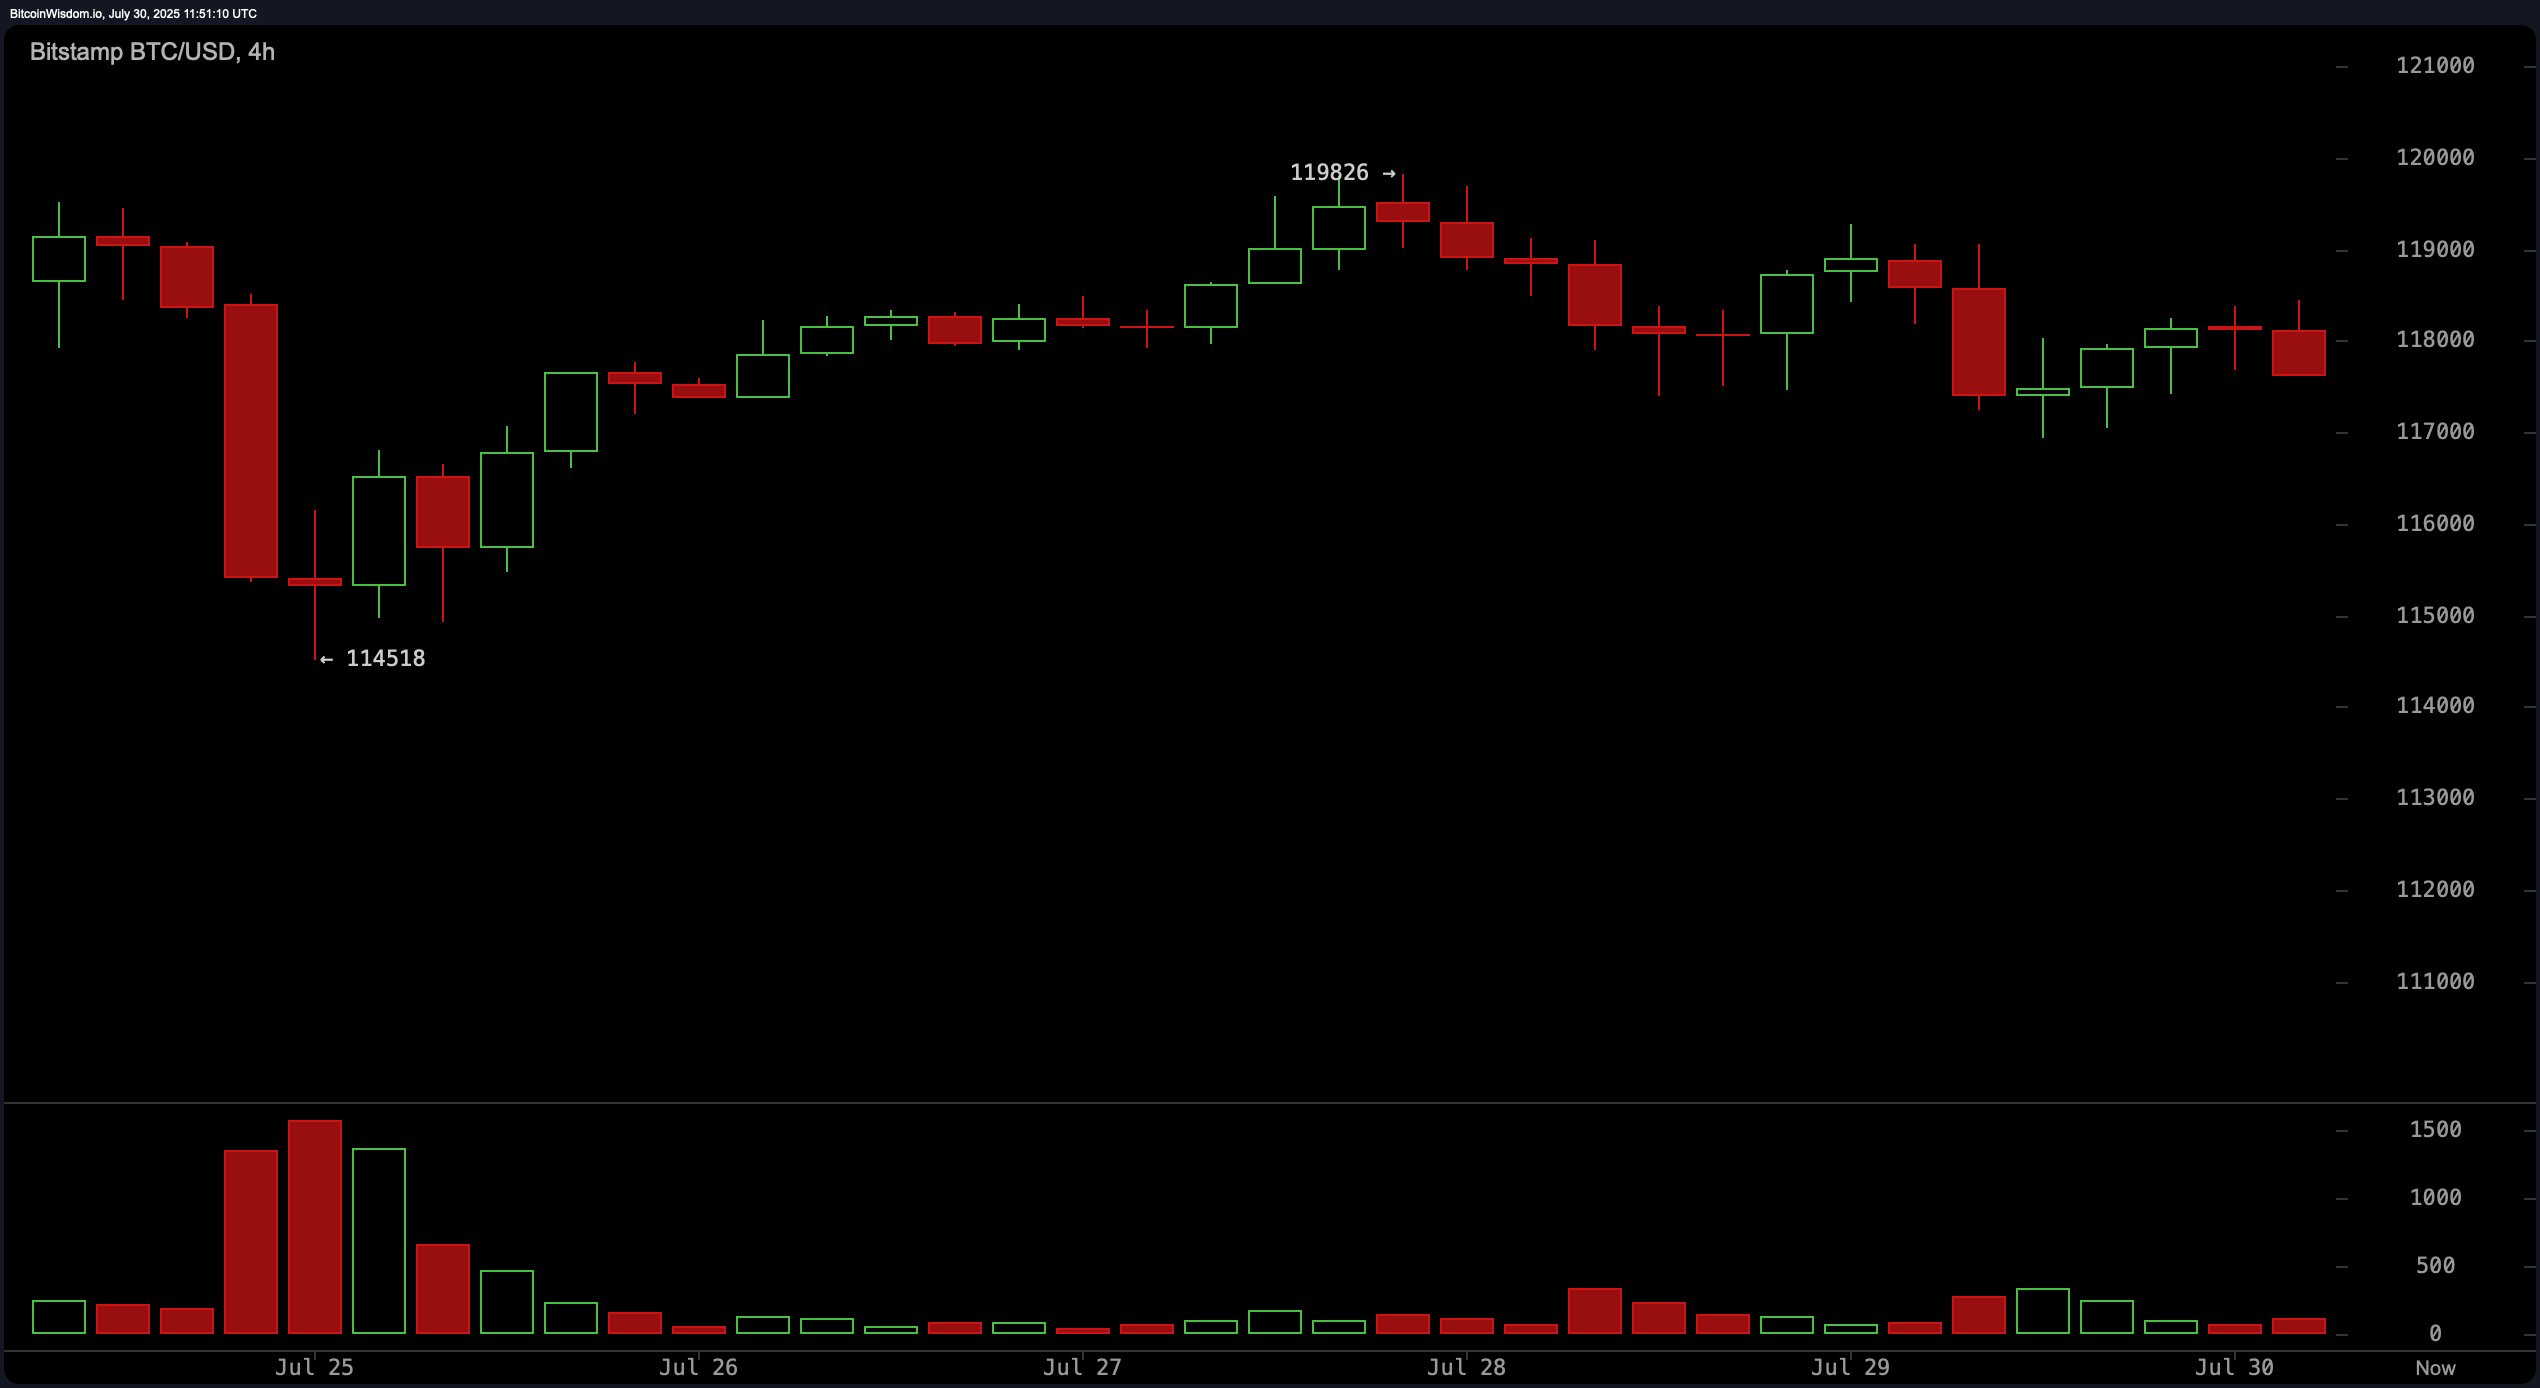
The 4-hour bitcoin chart reflects a more bearish tone, particularly following a decline to $114,518 and a subsequent recovery to $119,826. Recent bearish candles, accompanied by declining volume, support the notion of a bearish retest. The technical setup indicates that a confirmed drop below $117,000 on strong volume could validate bearish continuation, targeting $114,500. Conversely, a bullish breakout above $120,000, followed by a successful retest, may shift momentum back to the upside with targets extending to $122,000.

BTC/USD 4-hour chart via Bitstamp on July 30, 2025.
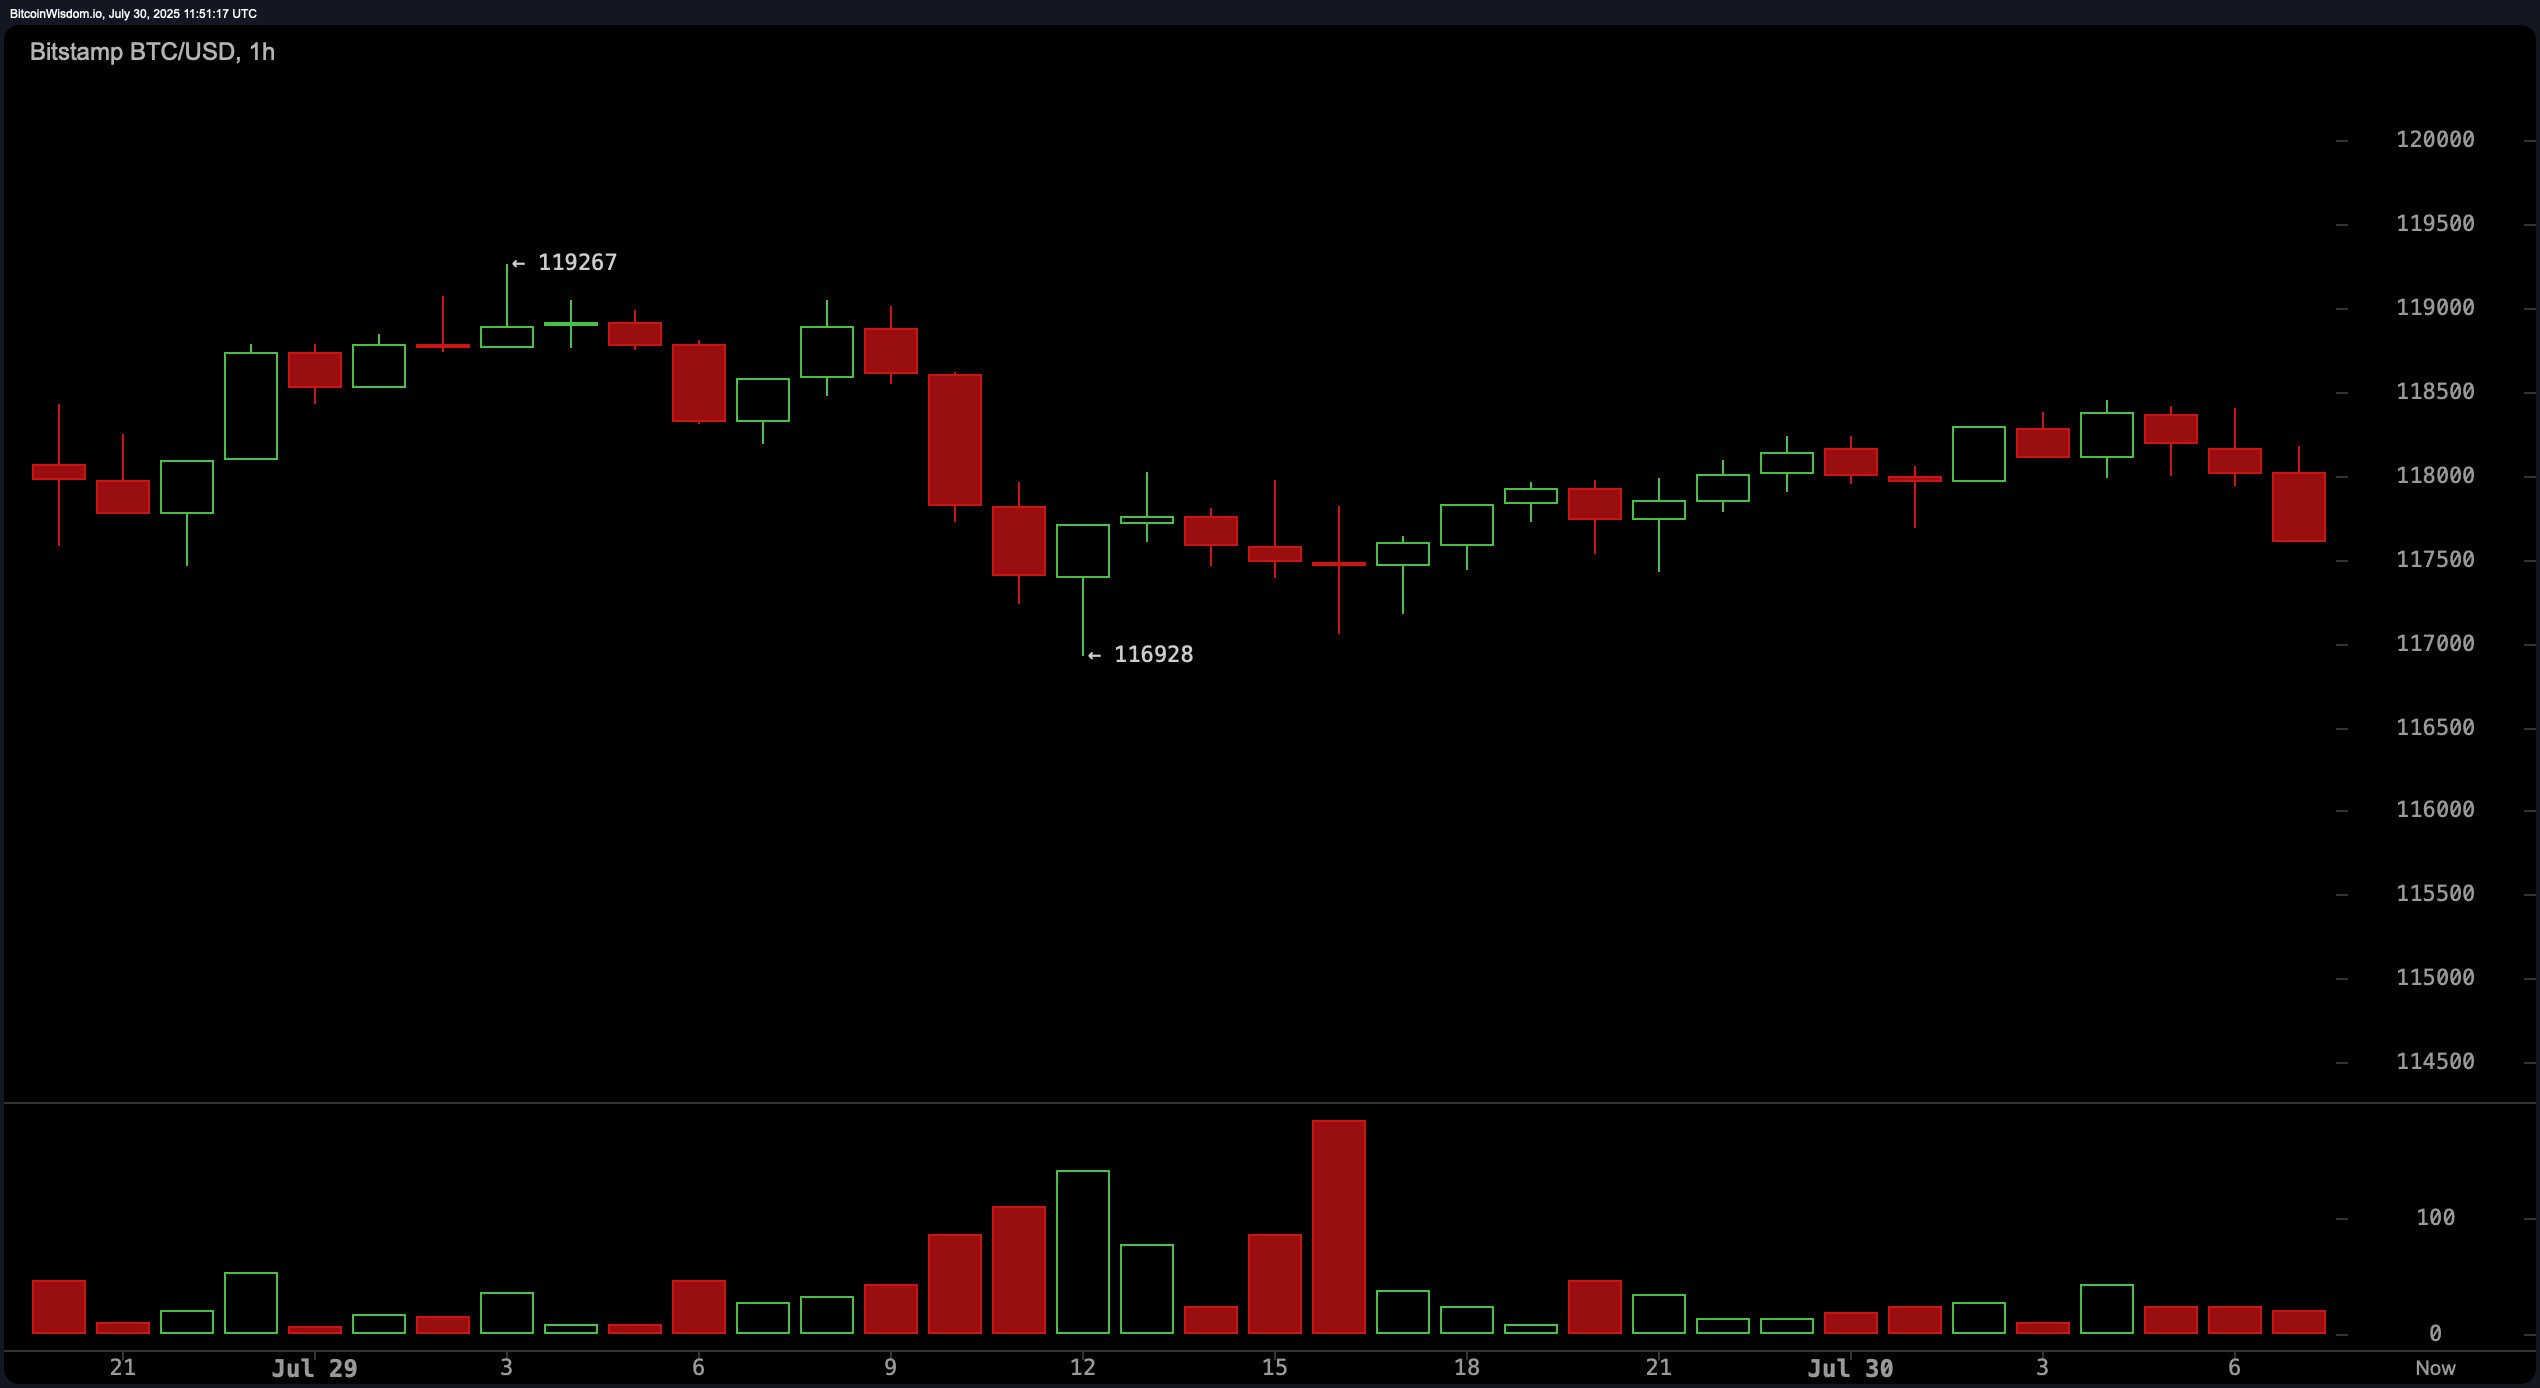
On the 1-hour chart, bitcoin shows signs of range-bound behavior. After reaching a lower high at $119,267 and dipping to $116,928, price action has turned sideways with limited volume. This indicates a consolidation phase, where traders may anticipate heightened volatility. Scalping strategies favor entry points above $118,500 or below $116,500, contingent on volume confirmation. Profit margins should be tight, with stops positioned just outside recent highs or lows.

BTC/USD 1-hour chart via Bitstamp on July 30, 2025.
Among oscillators, the relative strength index (RSI), stochastic oscillator, commodity channel index (CCI), average directional index (ADX), and awesome oscillator all present neutral readings. Momentum remains the only oscillator signaling positivity, while the moving average convergence divergence (MACD) leans more bearish. Moving averages show a mix of short-term weakness and longer-term strength. Specifically, the 10-period and 20-period exponential and simple moving averages suggest a near-term bearish signal, while the 30-period to 200-period moving averages consistently indicate a bullish signal, highlighting strong support on broader timeframes.
Overall, bitcoin’s current technical posture reflects uncertainty at key resistance levels, with conflicting signals across timeframes. Traders should monitor volume behavior closely around the $116,000 to $120,000 range for clearer directional bias. While long-term momentum remains intact, short-term price action suggests potential downside risks if support at $117,000 fails to hold.
Bull Verdict:
If bitcoin sustains support above $116,000 and breaks decisively above the $120,000 resistance level with strong volume, the bullish trend is likely to resume. In that case, momentum could carry prices toward retesting the $123,000 high, supported by long-term moving averages and a favorable momentum oscillator reading.
Bear Verdict:
Should bitcoin fail to hold above the $117,000 support and breach $116,500 with conviction, the bearish setup on lower timeframes could lead to a deeper retracement. In this scenario, the price may revisit $114,500 or lower, aligning with the weakening volume, bearish MACD crossover, and negative short-term moving average signals.
免责声明:本文章仅代表作者个人观点,不代表本平台的立场和观点。本文章仅供信息分享,不构成对任何人的任何投资建议。用户与作者之间的任何争议,与本平台无关。如网页中刊载的文章或图片涉及侵权,请提供相关的权利证明和身份证明发送邮件到support@aicoin.com,本平台相关工作人员将会进行核查。


