So much for crypto volatility, eh? The market is more or less trading sideways at the moment, with nearly 90% of all digital assets moving less than 4% in either direction over the past 24 hours. Bitcoin is sitting tight, hugging the $117,000 to $118,000 price zone, as it has been for days now.
But there’s at least one token bucking the trend—and defying expectations. Not too long ago, things were looking grim for Pump.fun’s PUMP token on the Solana network. Just last week, in fact, it was the worst-performing crypto asset by a long shot. Today, though, PUMP is living up to its name, up a whopping 18%.
Why? Well, let’s zoom out first.
Total crypto market capitalization sits at $3.87 trillion, inching up just 0.31% from yesterday, according to Coinmarketcap, as traders digest the Federal Reserve's decision to maintain interest rates at 4.25-4.5% for the fifth consecutive meeting.
Just for reference, the average dip in the top 100 coins by market cap was around 1% in the 24 hours by the time of writing this analysis.
Traditional markets also showed strength—the S&P 500 climbed 0.92% to 6,421 points and gold rose 0.64% to $3,295.62 per troy ounce, as investors wait and see how tariffs will impact markets and how regulatory developments affect the financial landscape.
The broader context includes oil prices holding at $76.34 per barrel amid Middle East tensions and the recent signing of the GENIUS Act, which officially legalizes stablecoins in the United States.
Bitcoin price: The consolidation will continue until…
Bitcoin trading flat today might seem unremarkable, but the technical picture shows a market at a critical juncture. The flagship cryptocurrency's price action reflects a tug-of-war between whale accumulation and profit-taking pressures.
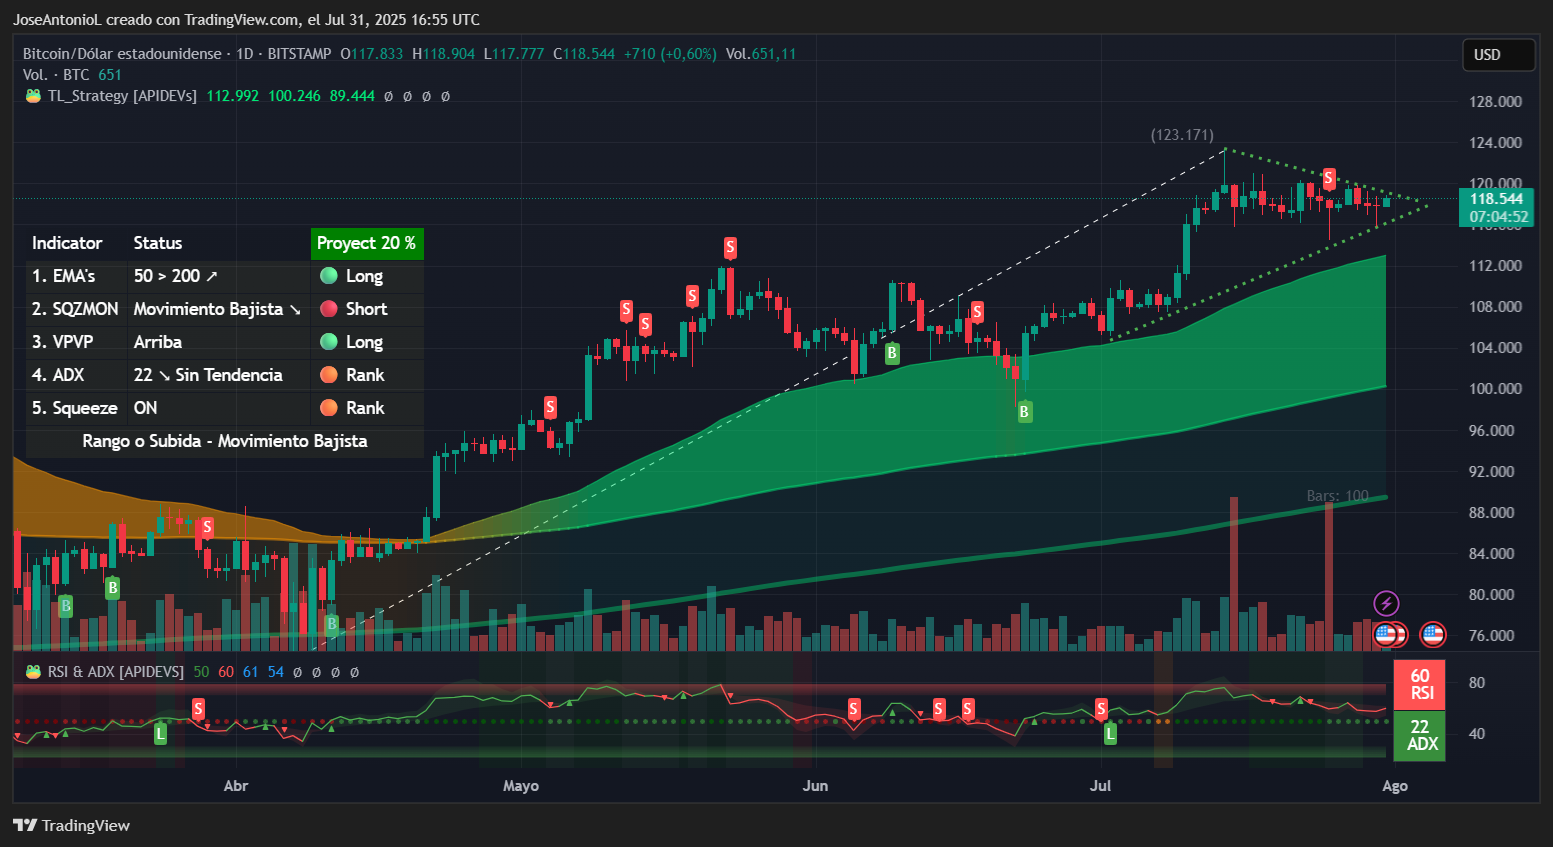
Bitcoin price data. Image: TradingView
The Relative Strength Index, or RSI, for Bitcoin sits at exactly 60, and has been slowing down, showing that markets may be cooling after a pretty steady spike towards a new all-time high not long ago. RSI is like a temperature gauge for markets, measuring how hot an asset might be on a scale from 0 to 100.
An RSI reading of 60 for BTC suggests traders are waiting for a clear directional signal before committing to larger positions. When RSI hovers at this midpoint, it often precedes significant moves in either direction. This can be confirmed after looking at the price pattern, which has been trading sideways for the last two weeks and puts BTC inside a symmetric triangle that is about to be broken.
The Average Directional Index, or ADX, for Bitcoin is at 22. ADX measures trend strength regardless of direction, and a score of 22 confirms the weakening of the bull hype. An ADX below 25 indicates no clear trend is established, suggesting Bitcoin is coiling for a potential breakout. Traders typically view this as a period of accumulation before the next major move.
Exponential Moving Averages, or EMAs, are also handy indicators for traders. EMAs take the average price of an asset over a given period. Bitcoin’s 50-day EMA suggests dynamic support around current levels, while the 200-day EMA sits lower, creating what traders would interpret as a bullish market structure. The Squeeze Momentum Indicator shows the market is “on," indicating volatility compression that often precedes explosive moves—an event that could trigger the breakout outside of the triangle pattern.
Key Levels:
- Immediate support: $115,000 (accumulation zone)
- Strong support: $112,000 (psychological level—the supports are very close because the coin is pretty much flat)
- Immediate resistance: $120,000 (round number resistance)
- Strong resistance: $123,171 (all-time high—same logic behind the close supports)
Pump’s PUMP pumps as buybacks fuel rally
Now onto today’s big winner: Pump.fun’s PUMP is pumping. The Solana token spiked 18% today, making it the market’s standout performer. Why? Ever heard of stock buybacks? Well, it’s like that, but for crypto.
Pump.fun’s aggressive buyback program is turning heads across the meme coin sector. The project announced it would use 100% of daily platform fees—approximately $2.16 million on July 30—to repurchase PUMP tokens from the market.
It’s almost certainly what triggered PUMP’s bullish swing—or at the very least what provided PUMP holders enough confidence to prevent prices from dumping even more. This was also enough to make the token go from the worst-performing cryptocurrency in the top 100 to the best-performing coin in today’s otherwise flat and boring market.
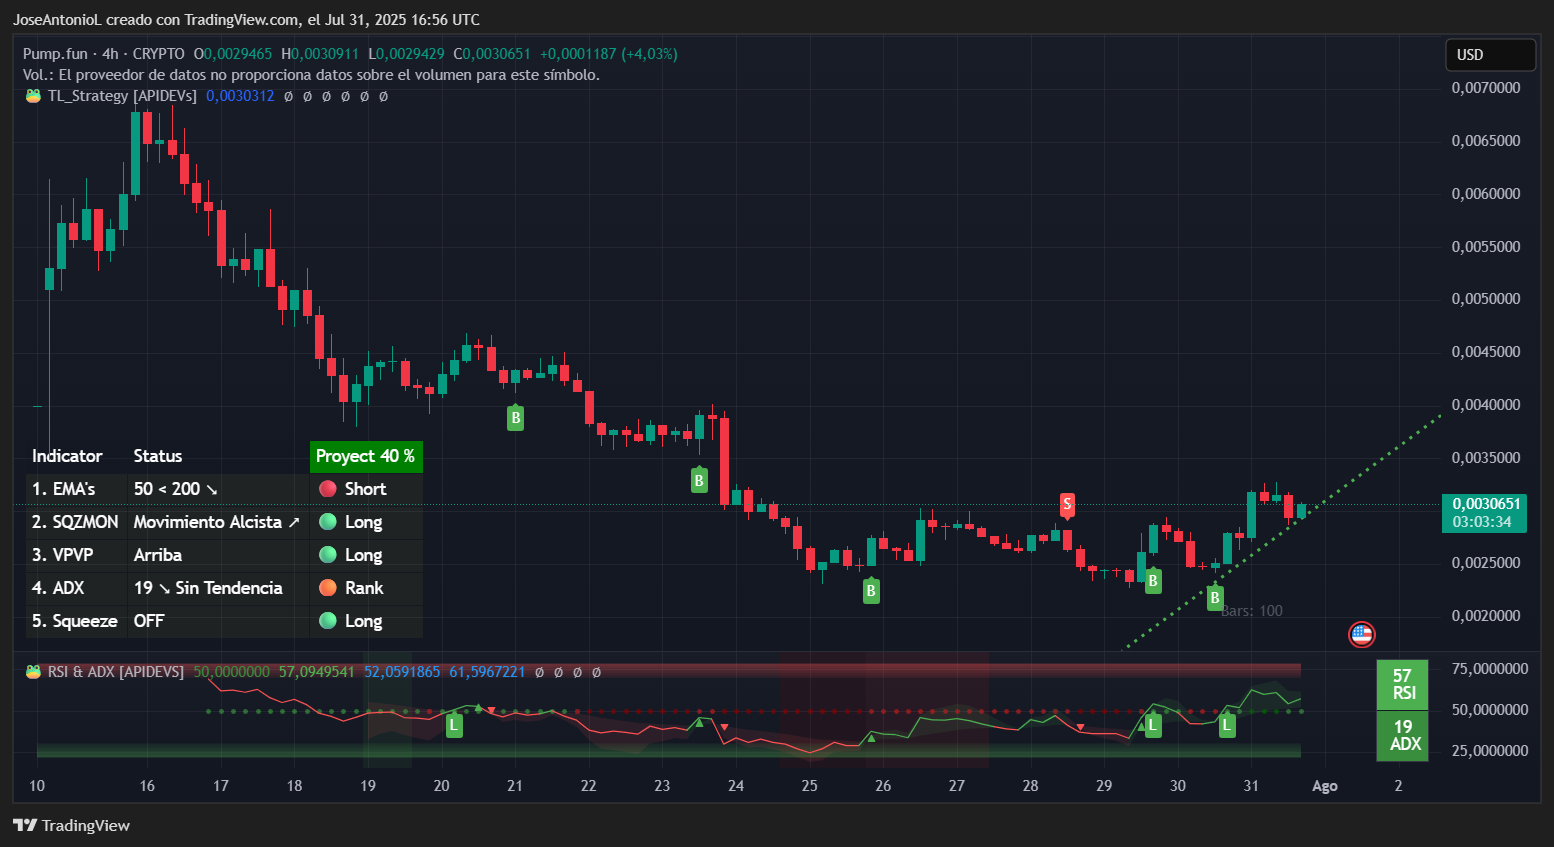
Pump price data. Image: TradingView
Technical indicators can only be studied in short time frames because the coin is too young for other oscillators to work. However, things point towards a relief rally after a major bearish panic.
In terms of the current price trend, there is support forming that traders would say paints a bullish recovery. The support, though, is still weak, but it has been tested successfully in the last three days. Looking at a broader outlook, the resistance at around its current $0.003 price zone marks a possible ascending triangle about to be tested. Generally speaking, ascending triangles (a flat resistance and an ascending support) tend to be considered a bullish formation.
PUMP’s RSI at 57.09 shows healthy buying momentum without approaching overbought territory above 70. This suggests room for further upside before profit-taking typically kicks in. Traders often target RSI readings between 50-70 as the "sweet spot" for trend continuation. The RSI going up during the latest candlesticks is also a good sign for the bulls—not enough to say markets are bullish, but probably interesting enough to set up buy orders.
The ADX at 19 indicates a weak trend, but context is crucial here: PUMP is emerging from a severe downtrend that saw it drop 62% from its peaks. Low ADX readings after extended declines often signal the early stages of reversal, particularly when accompanied by volume spikes like today's 25.68% increase to $683.9 million.
So what does that mean? Basically, bearish dominance is slowing down, but also current bullish behavior doesn’t necessarily suggest number go up in the short term. Only that number has stopped going down—for now.
PUMP did, however, break above a descending resistance line that had capped rallies for two weeks. This technical breakout, combined with the fundamental catalyst of buybacks, typically attracts momentum traders.
Buybacks are bullish, what can we say. So long as the one doing the buying back has deep enough bags to keep it going.
Key Levels:
- Strong support: $0.0025 (previous resistance turned support)
- Strong resistance: $0.0040 (psychological level and bearish trigger from July 24)
免责声明:本文章仅代表作者个人观点,不代表本平台的立场和观点。本文章仅供信息分享,不构成对任何人的任何投资建议。用户与作者之间的任何争议,与本平台无关。如网页中刊载的文章或图片涉及侵权,请提供相关的权利证明和身份证明发送邮件到support@aicoin.com,本平台相关工作人员将会进行核查。


