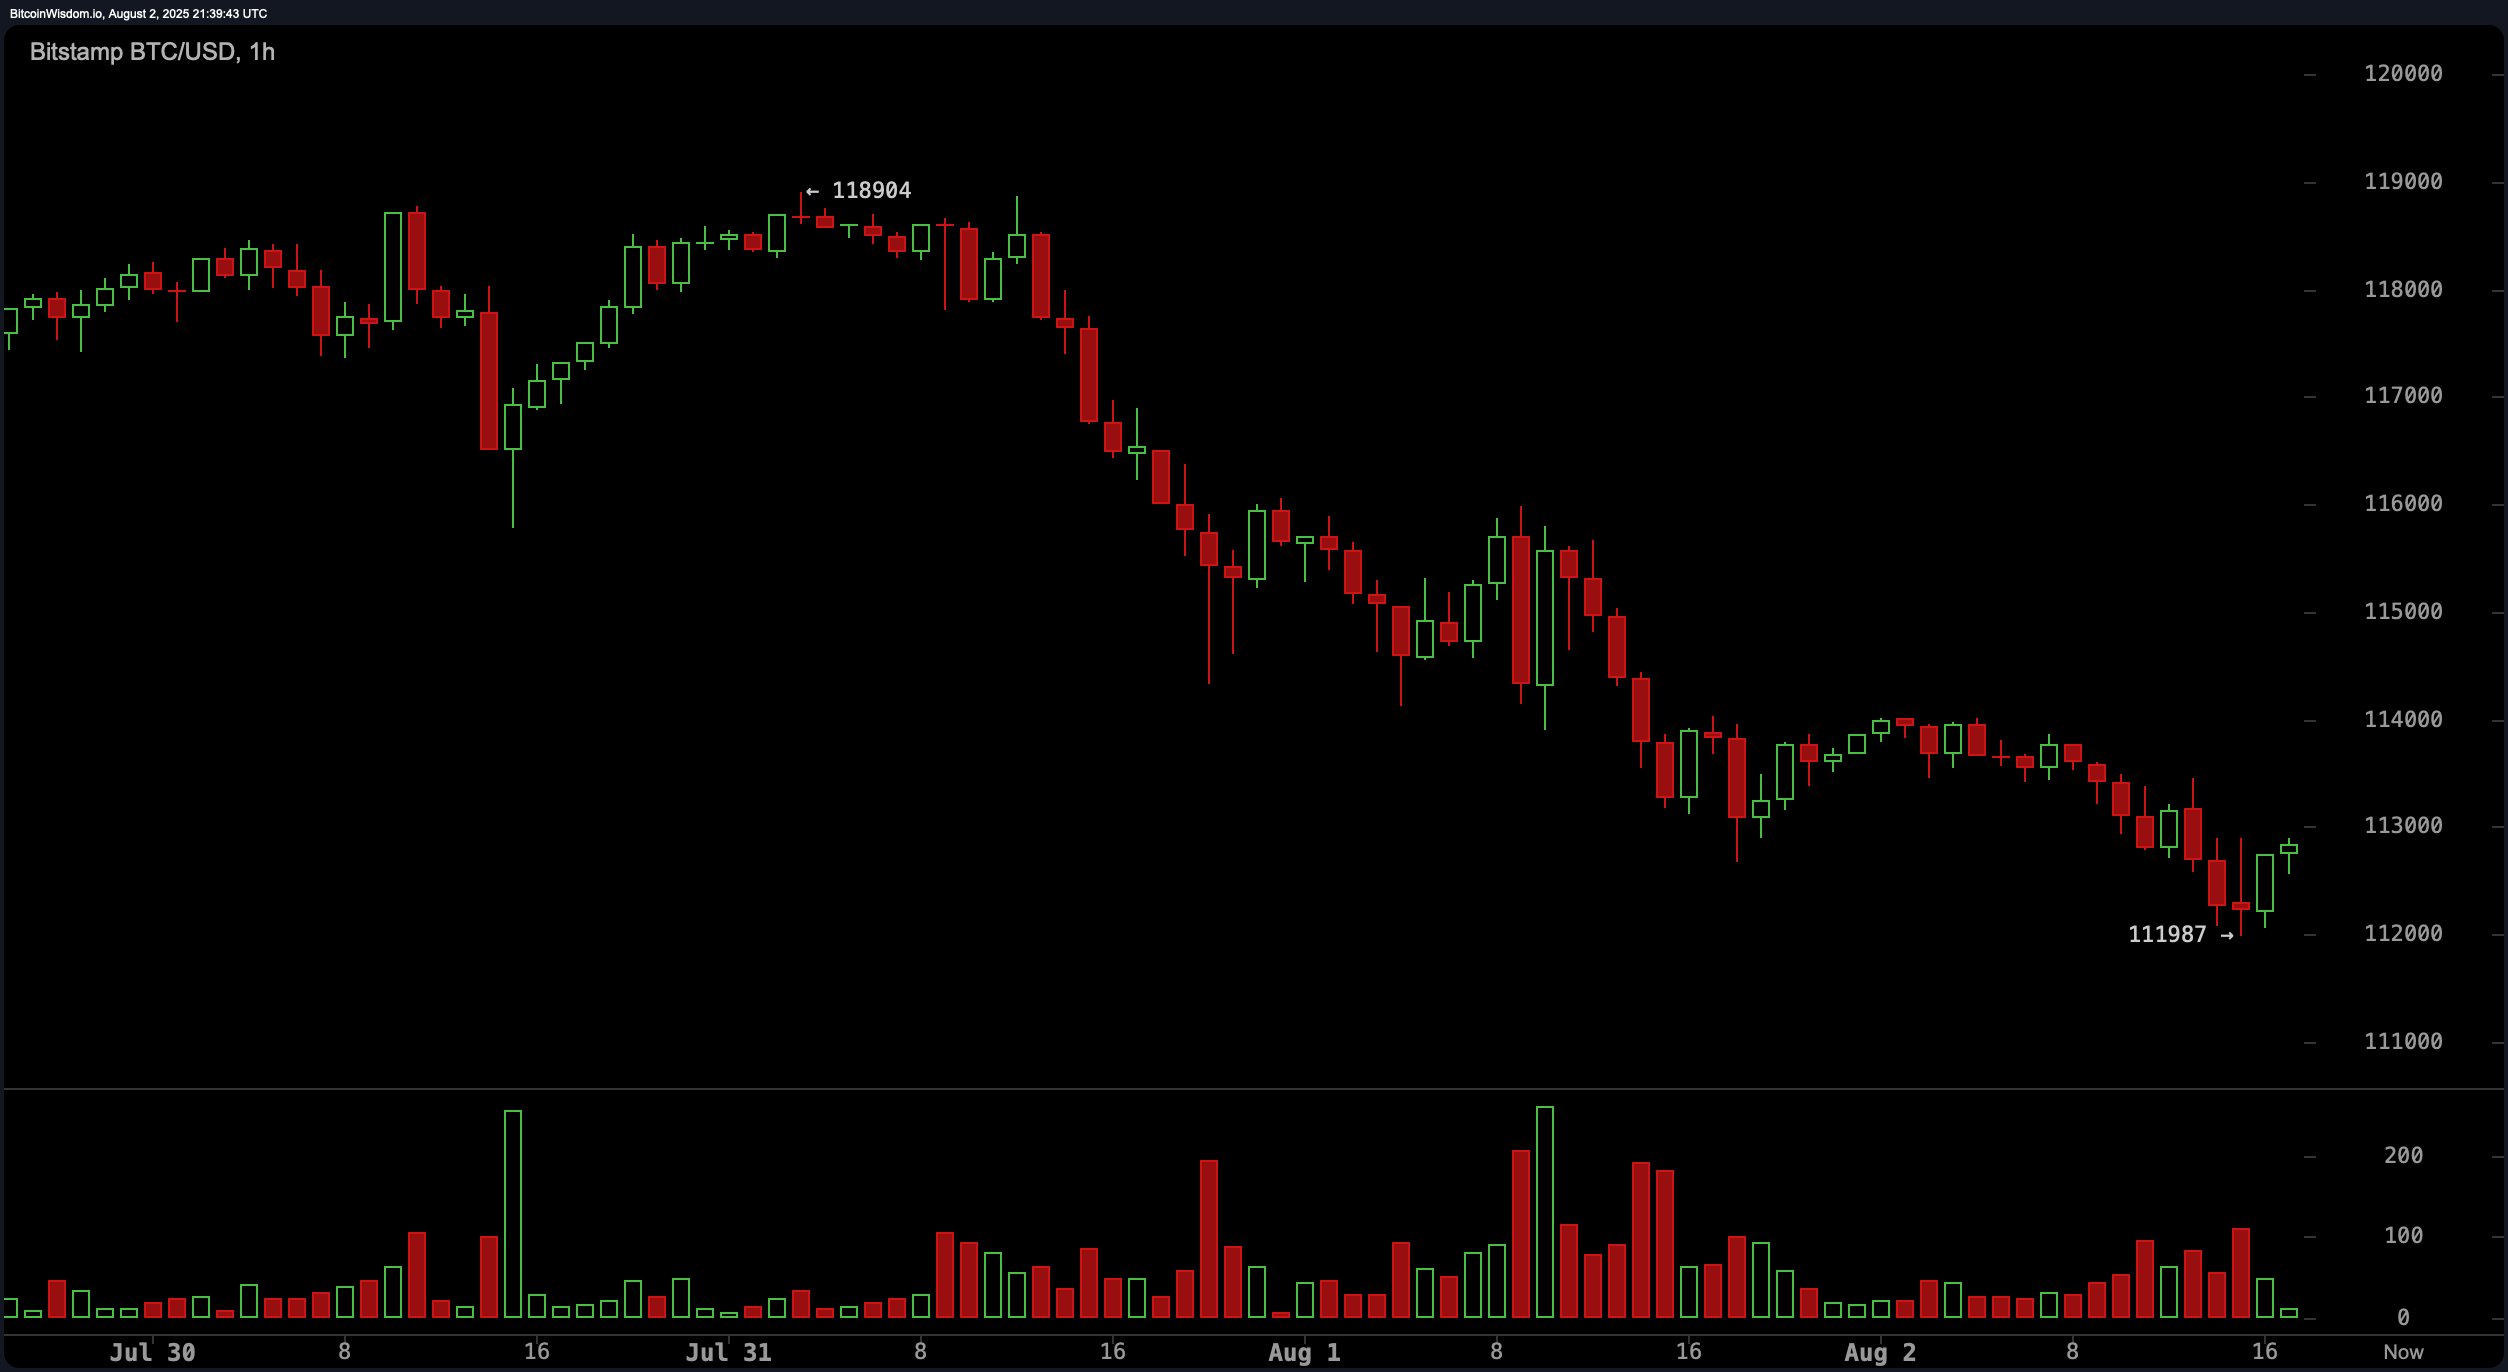
Bitcoin is down 4.6% this week with a market cap of $2.23 trillion and a 24-hour trading volume of $36.35 billion. On the daily chart, BTC has been trending lower since mid-July, with consecutive bearish days pushing it below short-term support.
The hourly chart confirms steady selling pressure, bottoming out at $111,987 during the U.S. morning session. Despite the decline, the daily volume remains moderate compared to the high-volatility stretches seen in late May and early July. At the same time, bitcoin derivatives markets are telling a whole other story from top to bottom.

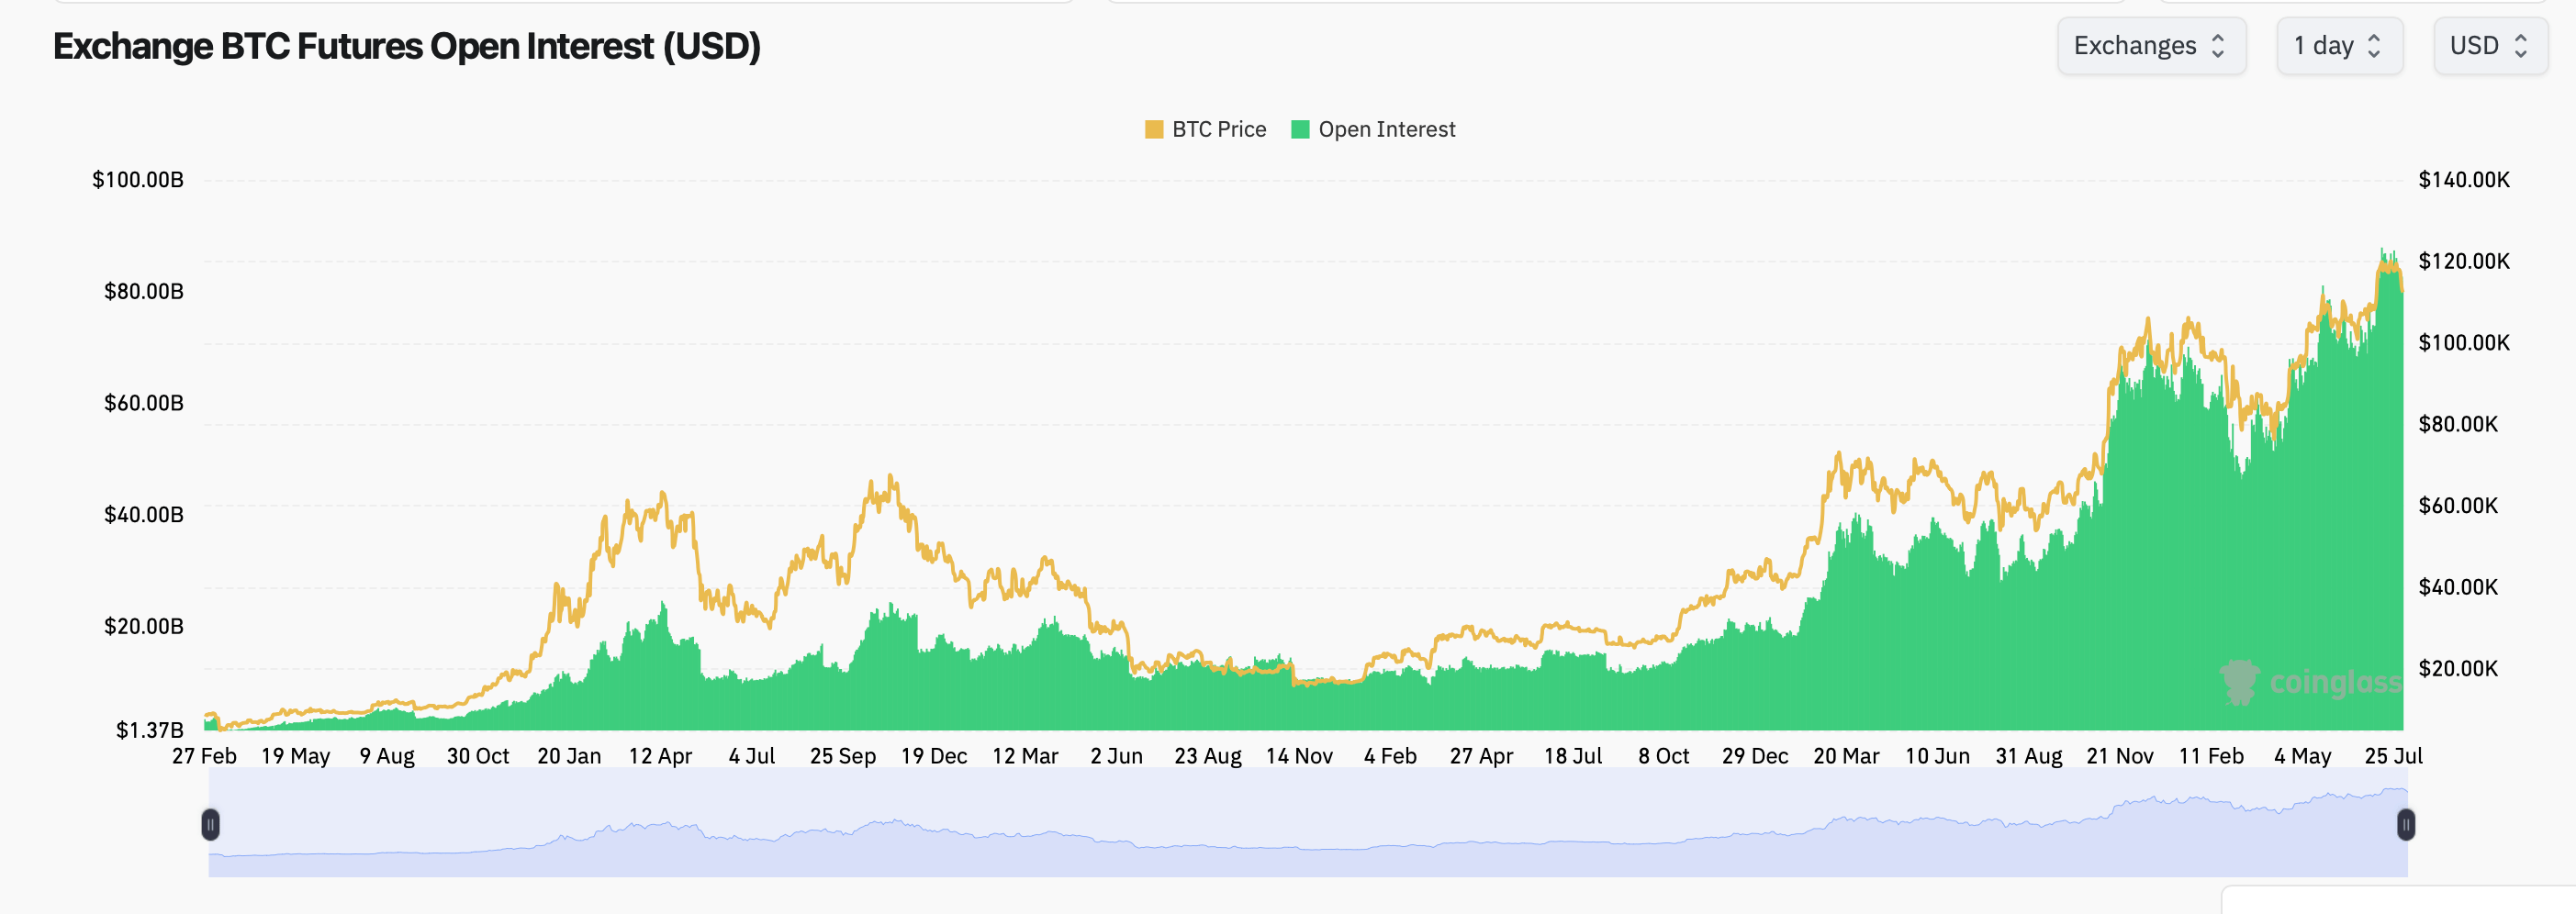
Futures open interest (OI) sits at $80.14 billion across all exchanges, according to coinglass.com metrics. CME and Binance lead at $15.94 billion and $14.12 billion, respectively. Bybit showed the most aggressive 1-hour OI increase at +0.31%, while MEXC’s OI climbed 1.32% over 24 hours.

However, 24-hour liquidations topped $577.19 million on Saturday, with longs taking the bulk of the damage—$514.50 million compared to $62.70 million in short positions. Ethereum traders were hit hardest with $185.7 million in both long and short liquidations, followed by bitcoin at $93.67 million. This suggests overleveraged long positions were flushed as prices slid lower.
Despite bearish spot action, options traders appear optimistic. Calls represent 61.8% of all open interest in the BTC options market, with 210,458.73 BTC in call positions versus 130,099.39 BTC in puts. In the past 24 hours, however, volume shifted more evenly, with 54.99% going to puts and 45.01% to calls—reflecting short-term defensive positioning.
High-interest strike prices include the Dec. 26, 2025, $140,000 call (10,616.4 BTC in OI) and even a bold $200,000 call (8,685.7 BTC). This signals confidence in long-term upside, even as BTC struggles to hold the $112K level.
Oscillators lean neutral to weakly bearish. The relative strength index (RSI) is at 40, while the MACD level is signaling a sell. The commodity channel index (CCI) is deeply negative at −293, often interpreted as a potential buy zone. Momentum has flipped to −6,171, suggesting downward force is in play.
Moving averages are mixed. The 10-, 20-, and 30-day simple and exponential moving averages are all flashing sell signals. However, the 50-, 100-, and 200-day SMAs and EMAs are still pointing to a longer-term uptrend, with the 200-day SMA at $99,213 and EMA at $100,471.
Bitcoin is navigating a technical correction amid solid derivatives activity and heavy long liquidations. Short-term indicators suggest more room to the downside, while options and longer-term moving averages hint at underlying bullish sentiment.
Whether BTC consolidates or continues its decline may hinge on macroeconomic data and derivatives rebalancing early next week.
免责声明:本文章仅代表作者个人观点,不代表本平台的立场和观点。本文章仅供信息分享,不构成对任何人的任何投资建议。用户与作者之间的任何争议,与本平台无关。如网页中刊载的文章或图片涉及侵权,请提供相关的权利证明和身份证明发送邮件到support@aicoin.com,本平台相关工作人员将会进行核查。


