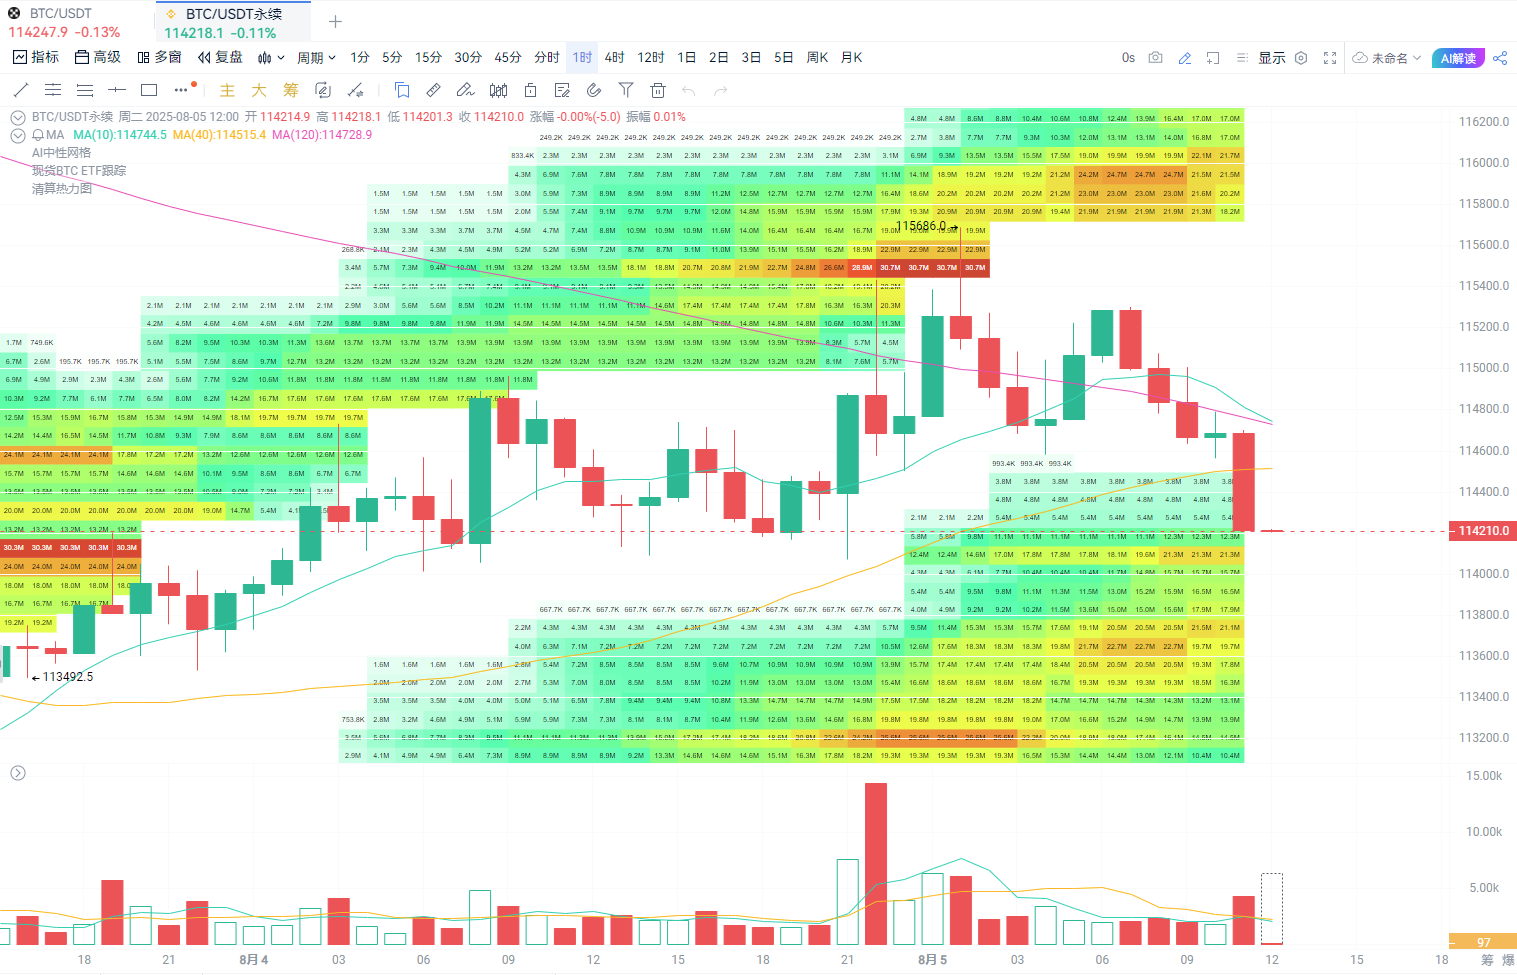
The cryptocurrency market has experienced severe fluctuations, with a total liquidation amount of up to $226 million across the network within 24 hours, including $21.11 million in Bitcoin liquidations. The sentiment index remains at a neutral level of 43, indicating a balanced investor sentiment, but potential uncertainties still exist. The BTC liquidation area is marked at $114,050 below and $116,397 above, indicating that high-leverage positions are susceptible to price swings. According to on-chain data and market analysis, this round of liquidations is primarily dominated by short positions, accounting for nearly 74% of the total, reflecting the significant impact of the short-term market rebound on bearish positions.

Short positions dominate, market rebound triggers chain reaction
Although the total liquidation amount of $226 million in 24 hours did not set a recent high, its structure shows a clear bias towards short positions. Data shows that short liquidations account for 74% of the total, while long positions only account for 26%, which highly correlates with Bitcoin's price rebound from a low of $114,100 to $115,700 on August 4. Many investors bet on further price declines, but the sudden rebound forced high-leverage short positions to close, creating a cascading liquidation effect.
On August 5, San Francisco Fed President Daly released dovish signals, stating that signs of a weak job market are increasing, and the timing for interest rate cuts is approaching, potentially leading to two 25 basis point cuts within the year. This boosted sentiment for risk assets, driving Bitcoin's price rebound and triggering short liquidations. High-leverage derivatives trading also exacerbates risks, with perpetual contract leverage on exchanges like Binance and OKX reaching up to 50 times, and the total amount of open contracts in 24 hours reaching $60 billion. On-chain data reveals institutional movements. Whale addresses accumulated 12,000 ETH during the downturn, indicating a buy-the-dip strategy, but short-term selling pressure remains.
BTC liquidation area
The BTC liquidation area is the focus of investor attention. The lower mark of $114,050 is highlighted in yellow, representing a potential support zone; if broken, it may trigger long position liquidations, leading to further price declines to the $111,000-$109,000 range. The upper mark of $116,397 is also highlighted in yellow, gathering a large number of short positions; if breached, it may trigger short squeezes, pushing the price to the $118,000-$125,000 range.

Liquidation explanation: High-heat areas (the darkest colors) represent market liquidity pools that attract price movements. The market tends to move towards areas with higher liquidation volumes.
- K-line patterns:
On the daily level, recent prices encountered resistance near $115,720 (the high on August 4) and fell back, forming a long upper shadow, indicating heavy selling pressure above.
On the hourly level, the $114,800 to $115,000 area has shown multiple signs of resistance to rebounds, presenting a short-term downward trend.
- Technical indicators:
MACD: The DIF and DEA averages on the hourly level are gradually declining, with the histogram turning from positive to negative, indicating weakening momentum; on the daily level, it remains above the zero axis, but the fast and slow lines show signs of convergence, necessitating caution against further adjustment risks.
RSI: The hourly RSI quickly fell from the overbought zone (above 64) and is currently around 45, indicating a bearish market sentiment; the daily RSI also dropped from above 60 to below 50, suggesting a decline in upward momentum.
EMA: The hourly EMA7 has fallen below EMA30 and is approaching EMA120, indicating a bearish short-term trend; the daily EMA7 and EMA30 remain in a sticky state, with overall direction unclear.
- Trading volume:
Trading volume has significantly increased over the past two days, especially on August 4, with a massive volume accompanying the price surge and subsequent drop, indicating intensified capital divergence and weakened bullish strength.
Current hourly trading volume is shrinking, indicating a rise in market wait-and-see sentiment, and short-term fluctuations may continue.
Concerns behind balanced investor sentiment
The sentiment index of 43 is neutral, reflecting that the market is neither extremely optimistic nor panicked. The Fear & Greed Index is at 60, with a 24-hour trading volume of $35.527 billion, indicating cautious trading. The neutral sentiment stems from Daly's dovish remarks (approaching interest rate cuts), but tariff uncertainties limit enthusiasm.
In a volatile market, data-driven strategies and risk management are key. Investors should monitor on-chain indicators, flexibly adjust positions, and seize opportunities.
This article is for informational sharing only and does not constitute any investment advice for anyone.
Join our community to discuss this event
Official Telegram community: t.me/aicoincn
Chat room: Wealth Group
免责声明:本文章仅代表作者个人观点,不代表本平台的立场和观点。本文章仅供信息分享,不构成对任何人的任何投资建议。用户与作者之间的任何争议,与本平台无关。如网页中刊载的文章或图片涉及侵权,请提供相关的权利证明和身份证明发送邮件到support@aicoin.com,本平台相关工作人员将会进行核查。


