The fluctuations in the cryptocurrency market are like the waves in a turbulent sea, making people feel anxious. However, its charm lies in the fact that it never looks at your past report card. Stop saying "I'll enter the market when it stabilizes"; opportunities in the crypto world never lie in "stability." The real dividends always belong to those who dare to position themselves amid uncertainty. Market volatility is not a risk; not understanding the trend is the biggest risk.
Bitcoin rose to a high of $117,600 yesterday and is currently around $116,700. Compared to Ethereum, Bitcoin's increase has been relatively stable and is currently in a range-bound state.
From a technical perspective, Bitcoin's daily MACD shows increasing green bars, and the KDJ has a golden cross moving upwards. There is significant short-term pullback pressure, but the weekly chart remains in an upward channel. On the 4-hour chart, the price is oscillating around the middle band of the Bollinger Bands (around $116,000), with shrinking trading volume and insufficient bullish and bearish momentum, so we need to be cautious of the risk of a "gap" flash crash. Currently, the key support and resistance levels for Bitcoin are as follows: Support: $115,000 (EMA30), $115,800 (bull-bear dividing line). Resistance: $117,580 (4-hour Bollinger Bands upper band), $118,000 (psychological level). Recently, we should also pay attention to the impact of news, such as the U.S. pension fund market entry policy (401k allowing investment in cryptocurrencies) bringing long-term capital expectations; the probability of the Federal Reserve cutting interest rates in September has risen to 93.6%, and liquidity easing supports the market.
Long position operation range suggestion: If it stabilizes around $115,500-$115,800 on a pullback, consider a light long position, with a stop loss at $115,000 and a target of $117,500-$118,000.
Short position operation range suggestion: If it rebounds to $117,580-$118,000 and faces pressure, consider a short position, with a stop loss at $118,500 and a target of $116,300-$115,800.
Medium to long-term operation suggestion: If it breaks below $115,000, be cautious of a deep pullback and consider reducing positions to observe; after stabilization, you can gradually build long positions, focusing on the effectiveness of breaking through $118,000.
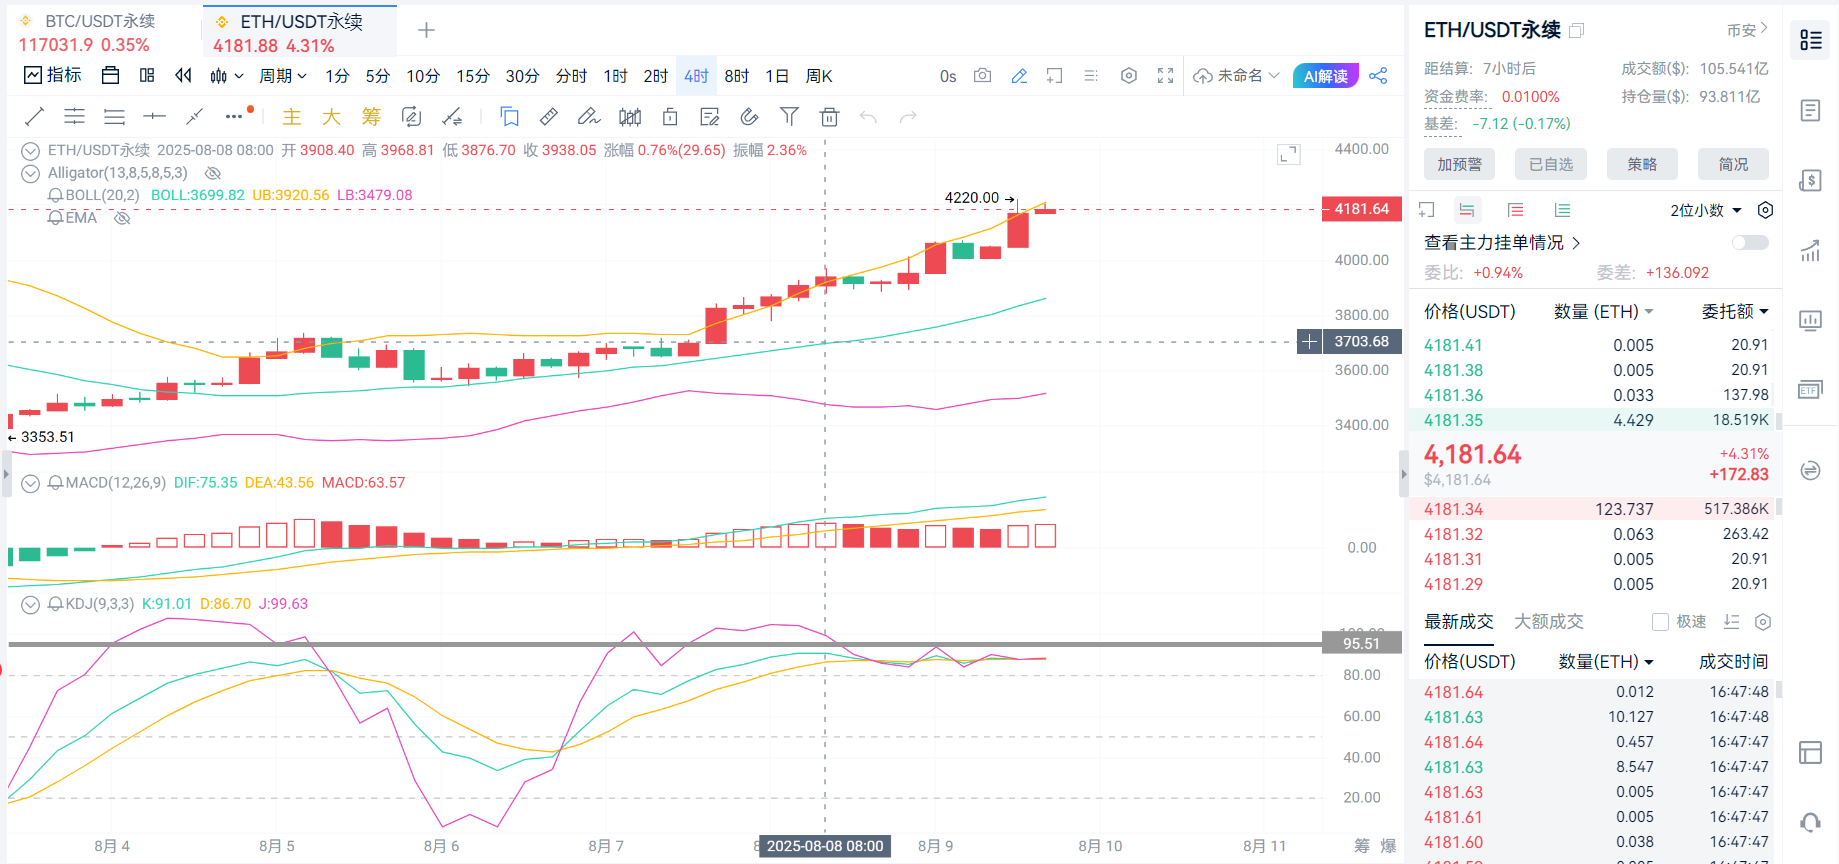
Ethereum has recently experienced a surge, rising from a low of $3,350 on August 3 to a high of $4,220. It is currently around $4,170. Its recent performance has been stronger than Bitcoin's; after stabilizing above $3,900 on August 8, the technical indicators show a bullish trend, and institutional purchases have boosted confidence.
From a technical perspective, the daily Bollinger Bands are opening upwards, the MACD red bars continue to increase, and the KDJ is in a golden cross upward state. On the hourly chart, although the KDJ is in the oversold zone, there is no sign of weakening momentum, and the candlestick is currently running along the upper band of the Bollinger Bands, continuously attempting to break through the upper band. In the short term, Ethereum still has room for further upward movement. Currently, the key support and resistance levels for Ethereum are as follows: First support level at $4,150, second support level at $4,100. First resistance level at $4,250, second resistance level at $4,300.
Long position operation range suggestion: If the price stabilizes around $4,150, consider a light long position, with a stop loss at $4,120 and a target of $4,230. Short position operation range suggestion: If the price fails to form an effective breakthrough at $4,200, consider a short position, with a stop loss at $4,225 and a target of $4,150.
Currently, the volatility is high, so it is recommended to adopt a strategy of building positions in batches and strict stop losses (500 points for Bitcoin, 30 points for Ethereum). Before breaking the range, focus on shorting high and longing low for both Bitcoin and Ethereum. The market changes rapidly, and specific operations need to be adjusted based on real-time data. Investors are advised to closely monitor macroeconomic data (such as Federal Reserve policies) and geopolitical dynamics.
Due to the timeliness of price points, there may be delays in post reviews, so specific operations should still be based on real-time market conditions. The above operation range analysis is for reference only; the cryptocurrency market is highly risky, so please make cautious decisions in your investments. If you are interested in specific indicator analysis or the impact of new market dynamics on prices, feel free to scan the QR code for the public account in the article below. You are welcome to visit.

Warm reminder: The content of the above article is original by the author, and the advertisements at the end of the article and in the comments section are unrelated to the author. Please be cautious!
免责声明:本文章仅代表作者个人观点,不代表本平台的立场和观点。本文章仅供信息分享,不构成对任何人的任何投资建议。用户与作者之间的任何争议,与本平台无关。如网页中刊载的文章或图片涉及侵权,请提供相关的权利证明和身份证明发送邮件到support@aicoin.com,本平台相关工作人员将会进行核查。


