
In the trading market, no one is a god forever; only you are your own god, and you are responsible for your own funds.
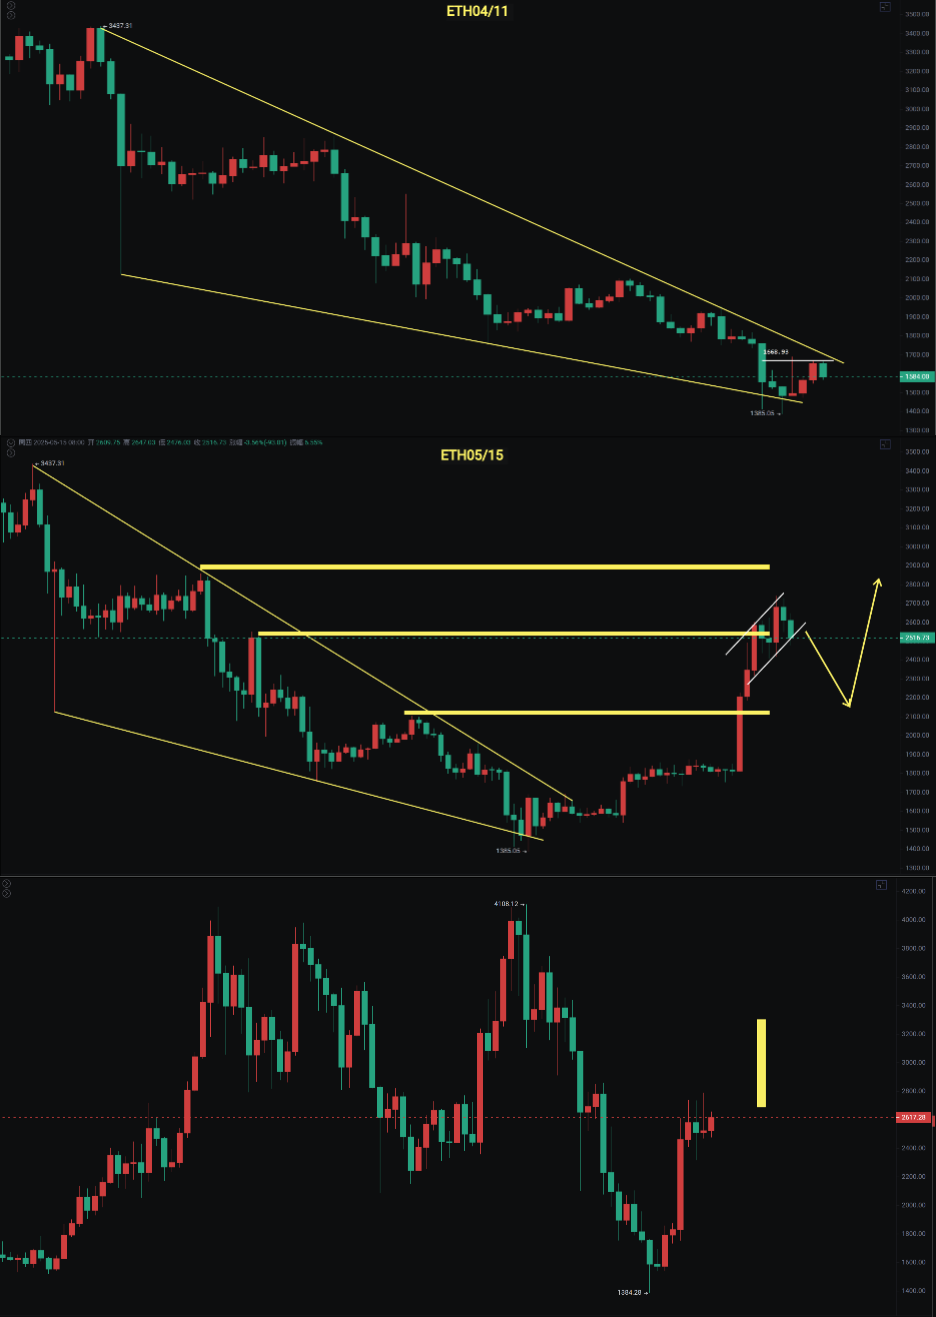
Today, the most exciting news is that Ethereum has broken through 4100, reaching a high of 4246. This is the first time since March 2024 that it has approached 4100, marking a breakthrough after 517 days. The weekly convergence triangle has broken through, and it has also surpassed the 4100 resistance. I have been bullish on Ethereum since May and June. After a series of doji candles in early May, I felt it would follow a throwback pattern but would first experience a pullback in line with Bitcoin's movements before continuing to surge towards 3300 to 3500, and even reaching the 4000 target, which has now been achieved.
The weekly line has not yet closed, but the convergence triangle has already broken. I previously mentioned that if we consider the previous surge to 4868 as the first wave, and the fluctuations since the bottom in late 2022 as the second wave, then we are currently breaking through and entering the third wave, targeting around 6700 (mid-term target). However, for now, do not FOMO; the next resistance on the weekly line is the previous bull market high of 4868. There will definitely be a pullback along the way, which also depends on whether Bitcoin can break through and continue to oscillate upwards.
Bitcoin
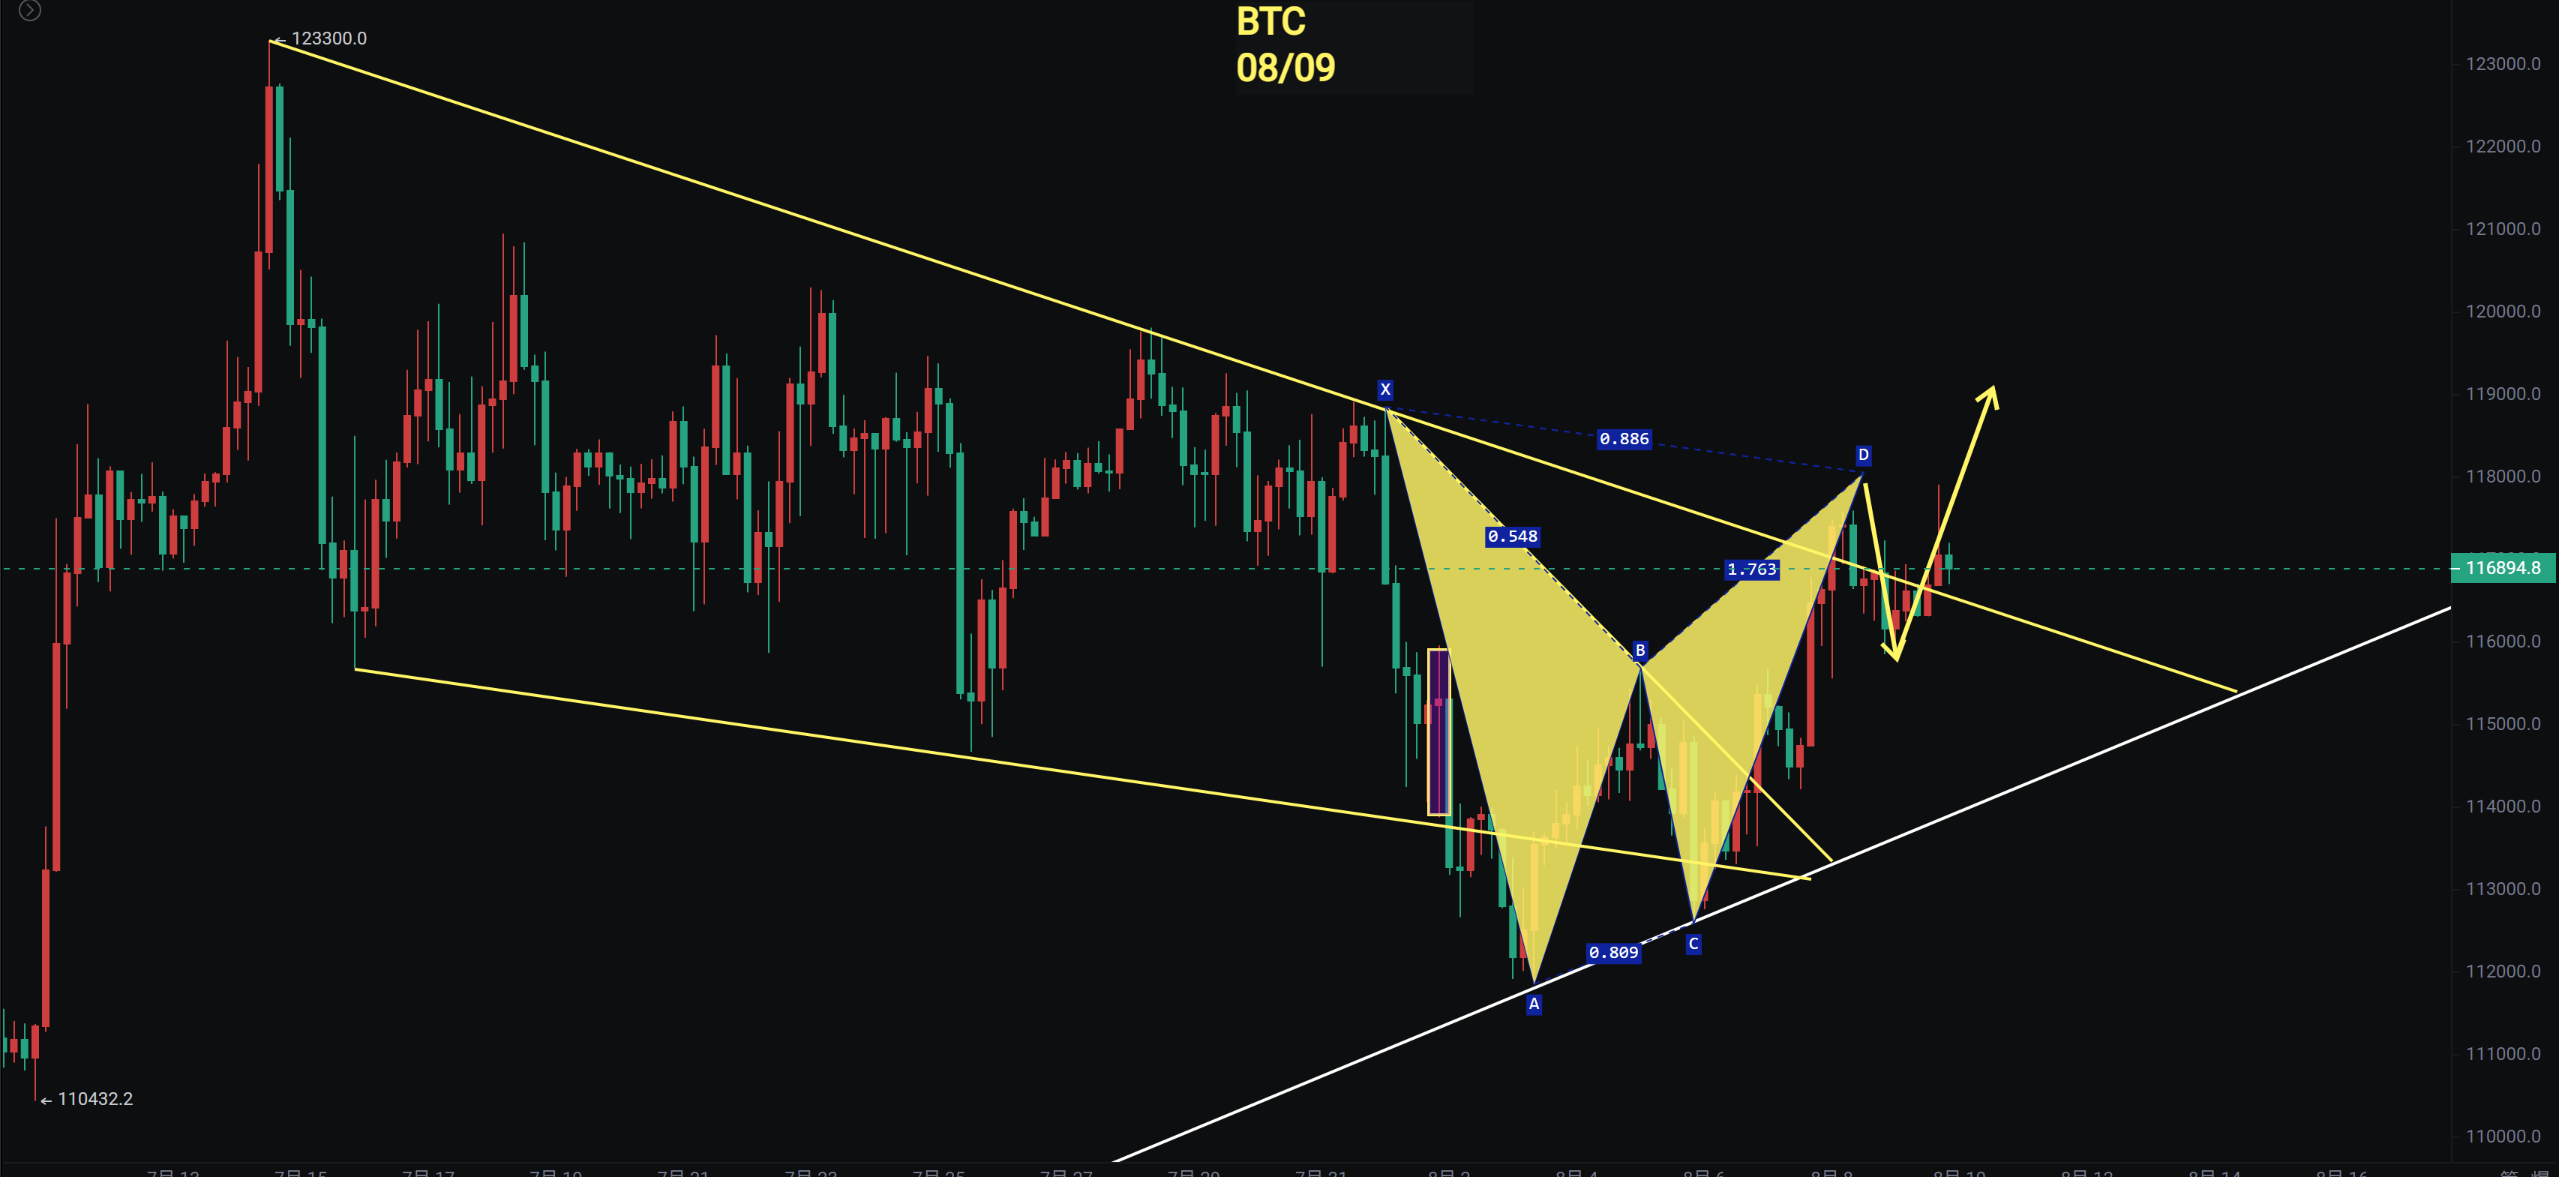
Bitcoin's daily line retraced to 115800 last night and then continued to rebound upwards, reaching a high of 117900 during the day before pulling back. The movement here is consistent with my predictions from the past few days, indicating that it will continue to oscillate upwards in the short term. We will see if it breaks through with a strong bullish candle or continues to test and oscillate.
The daily line has reclaimed above 115700, and today it is testing the bullish flag again. The MACD histogram is continuously shrinking, with a potential crossover of the fast and slow lines. However, from the volume perspective, there has not been a significant increase, and the RSI has not broken through, so the indicators are showing an upward rebound. I previously mentioned that as long as the price does not fall below 115700, we cannot be bearish.
Support: 114700—115700
Resistance: 121000—123000
Ethereum
Ethereum has reached a new high in a year and a half. As long as the price remains above 3950, it is considered a true breakthrough. I previously mentioned that the monthly line's bottom divergence has the potential to break through. August has only seen 9 days of trading, and the fast and slow lines have crossed into the green, with the RSI also breaking through. The weekly line has not yet fully formed, and I will continue to update as it develops.
The daily line has broken through the previous high of 4100, with the MACD histogram turning green and the fast and slow lines crossing. Since I alerted on August 3, Ethereum has seen a rebound of 24%. The ETH/BTC exchange rate has broken through the MA60, reaching 0.03587. A few days ago, I mentioned that once it breaks through the MA60, there is a chance to touch the MA120. This is also near the Fibonacci 0.382 level at 0.436, so we need to pay attention to the potential pullback for Ethereum and altcoins.
Support: 3950—4100
Resistance: 3500—4800
If you like my views, please like, comment, and share. Let's navigate through the bull and bear markets together!!!
The article is time-sensitive and for reference only; it will be updated in real-time.
Focusing on K-line technical research, sharing global investment opportunities. Public account: BTC Trading Prince Fusu

免责声明:本文章仅代表作者个人观点,不代表本平台的立场和观点。本文章仅供信息分享,不构成对任何人的任何投资建议。用户与作者之间的任何争议,与本平台无关。如网页中刊载的文章或图片涉及侵权,请提供相关的权利证明和身份证明发送邮件到support@aicoin.com,本平台相关工作人员将会进行核查。


