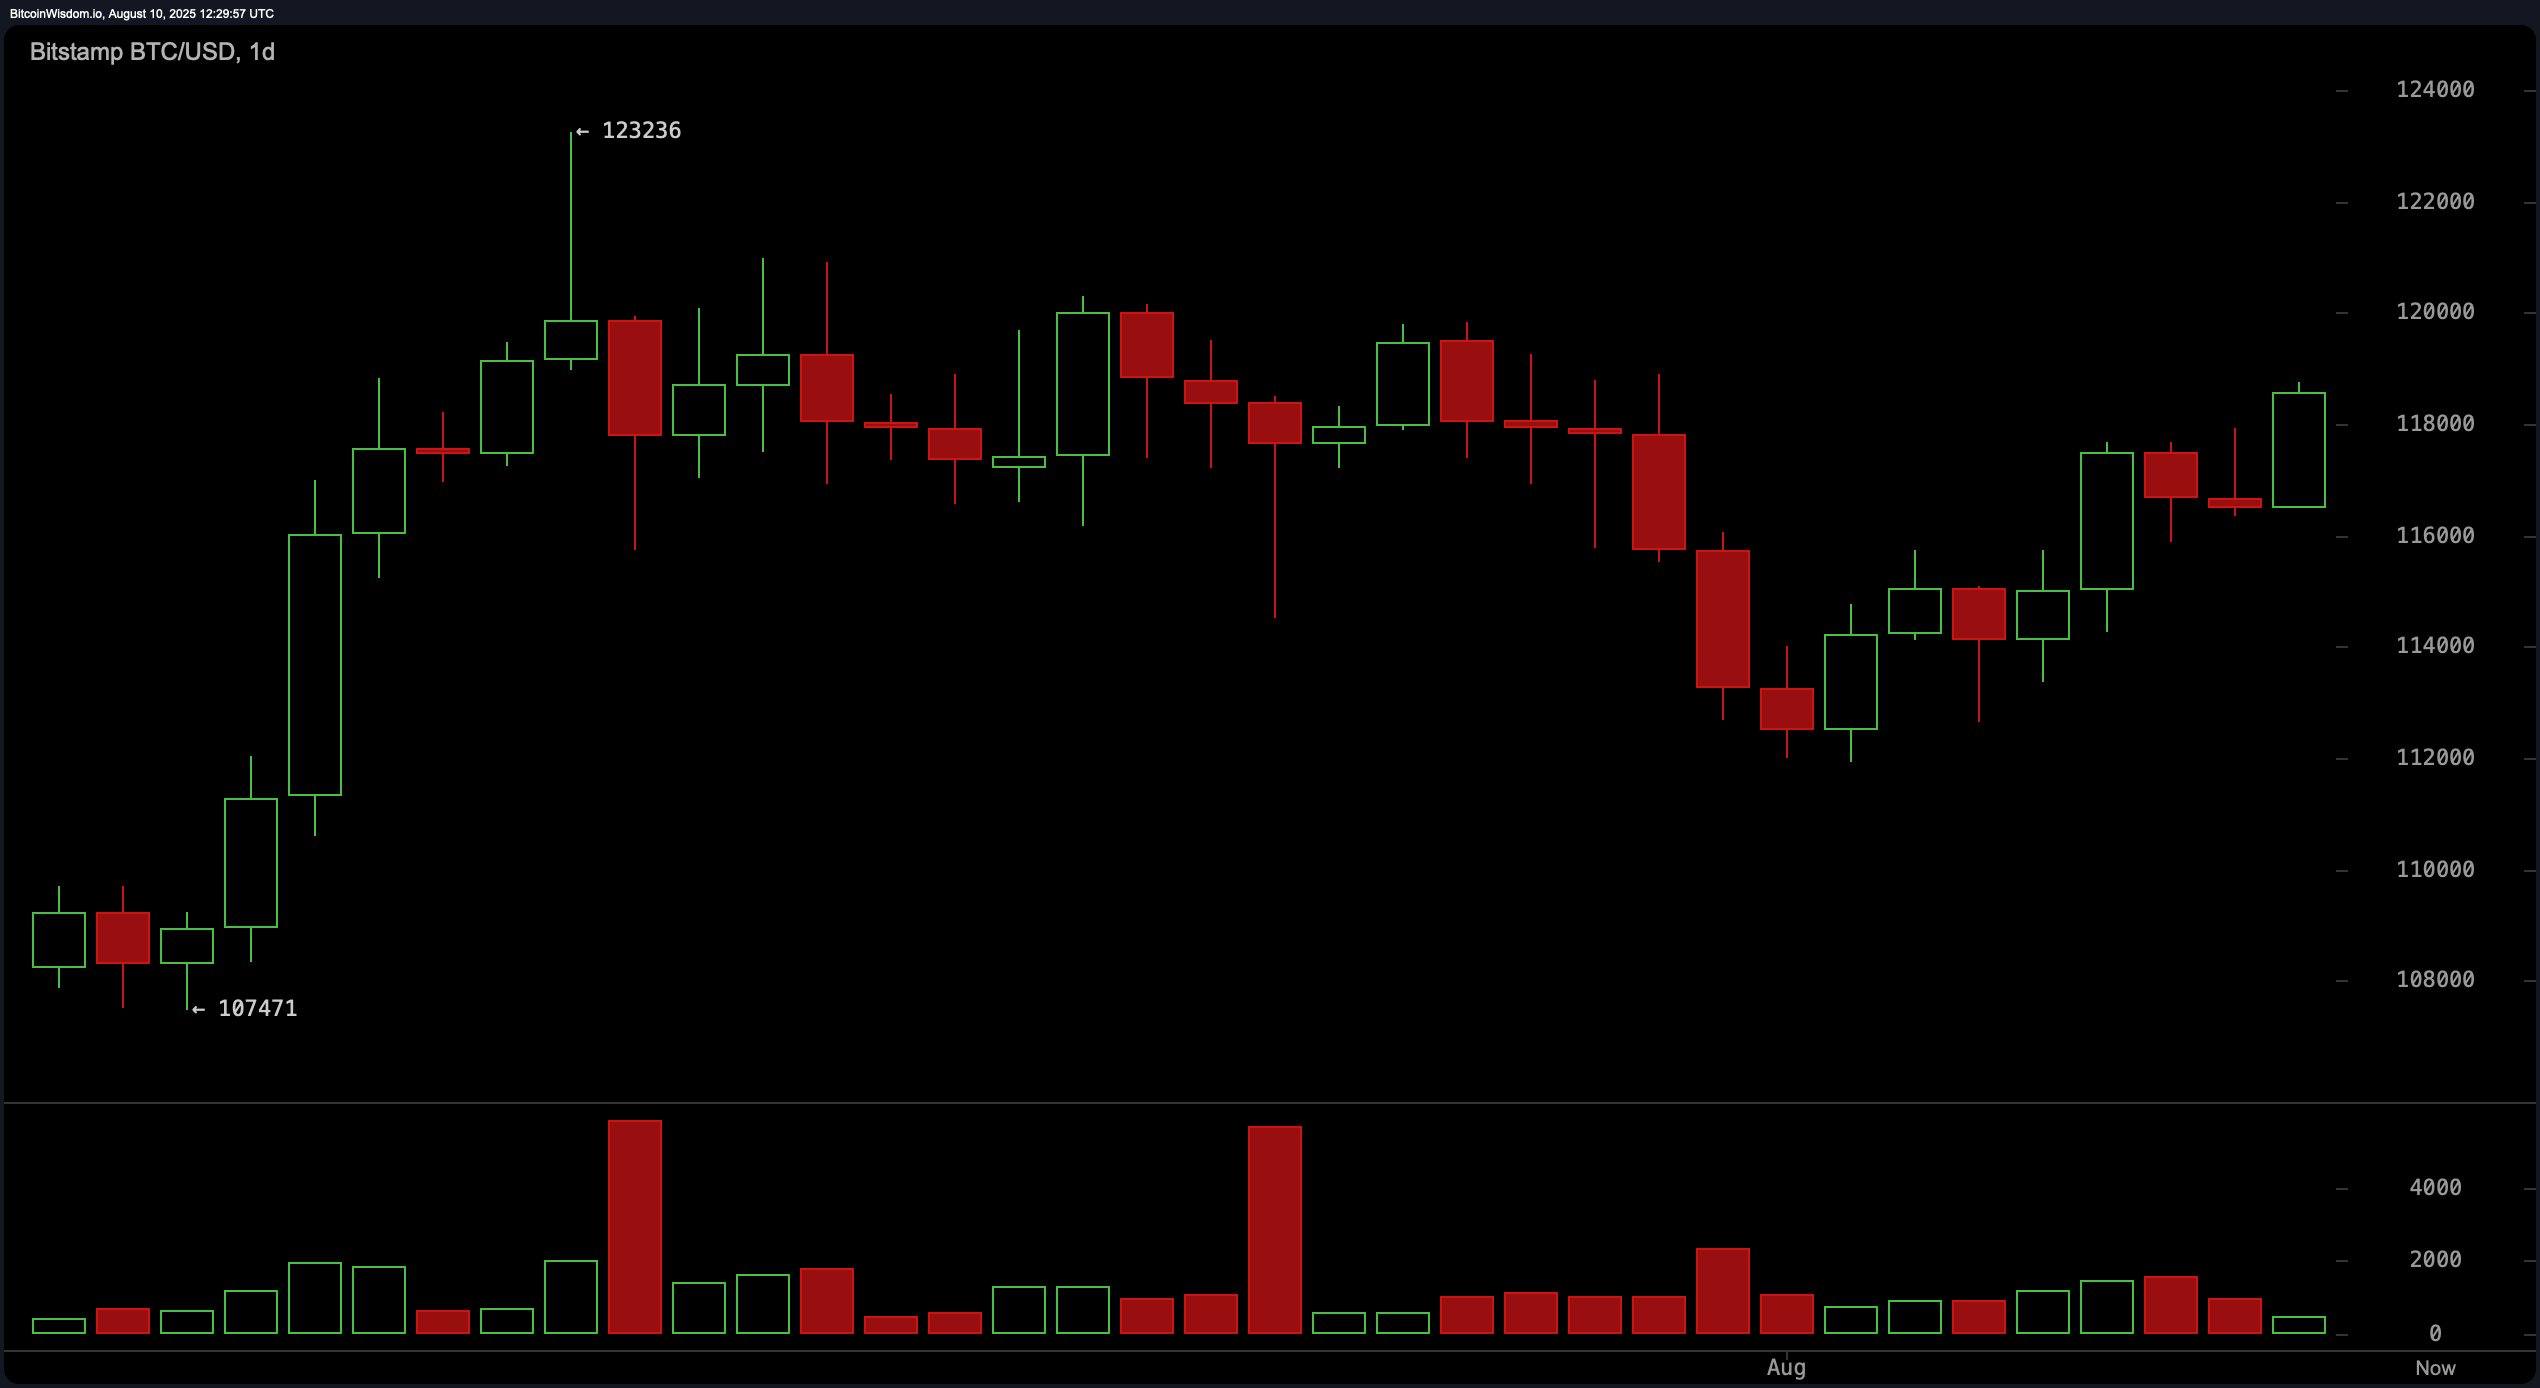
The daily chart shows bitcoin recovering from a sharp retracement, having bounced from around $112,000 toward current levels. The broader trend remains a mid-range consolidation between the $112,000 support and $123,000 resistance zones. The relative strength index (RSI) at 59, Stochastic at 68, and commodity channel index (CCI) at 56 all point to a neutral momentum phase, while momentum at 2,855 signals underlying buying interest. The moving average convergence divergence (MACD) level at 528 reflects a sell signal, highlighting that despite the rebound, there is still caution in the market.

BTC/USD 1-day chart via Bitstamp on Aug. 10, 2025.
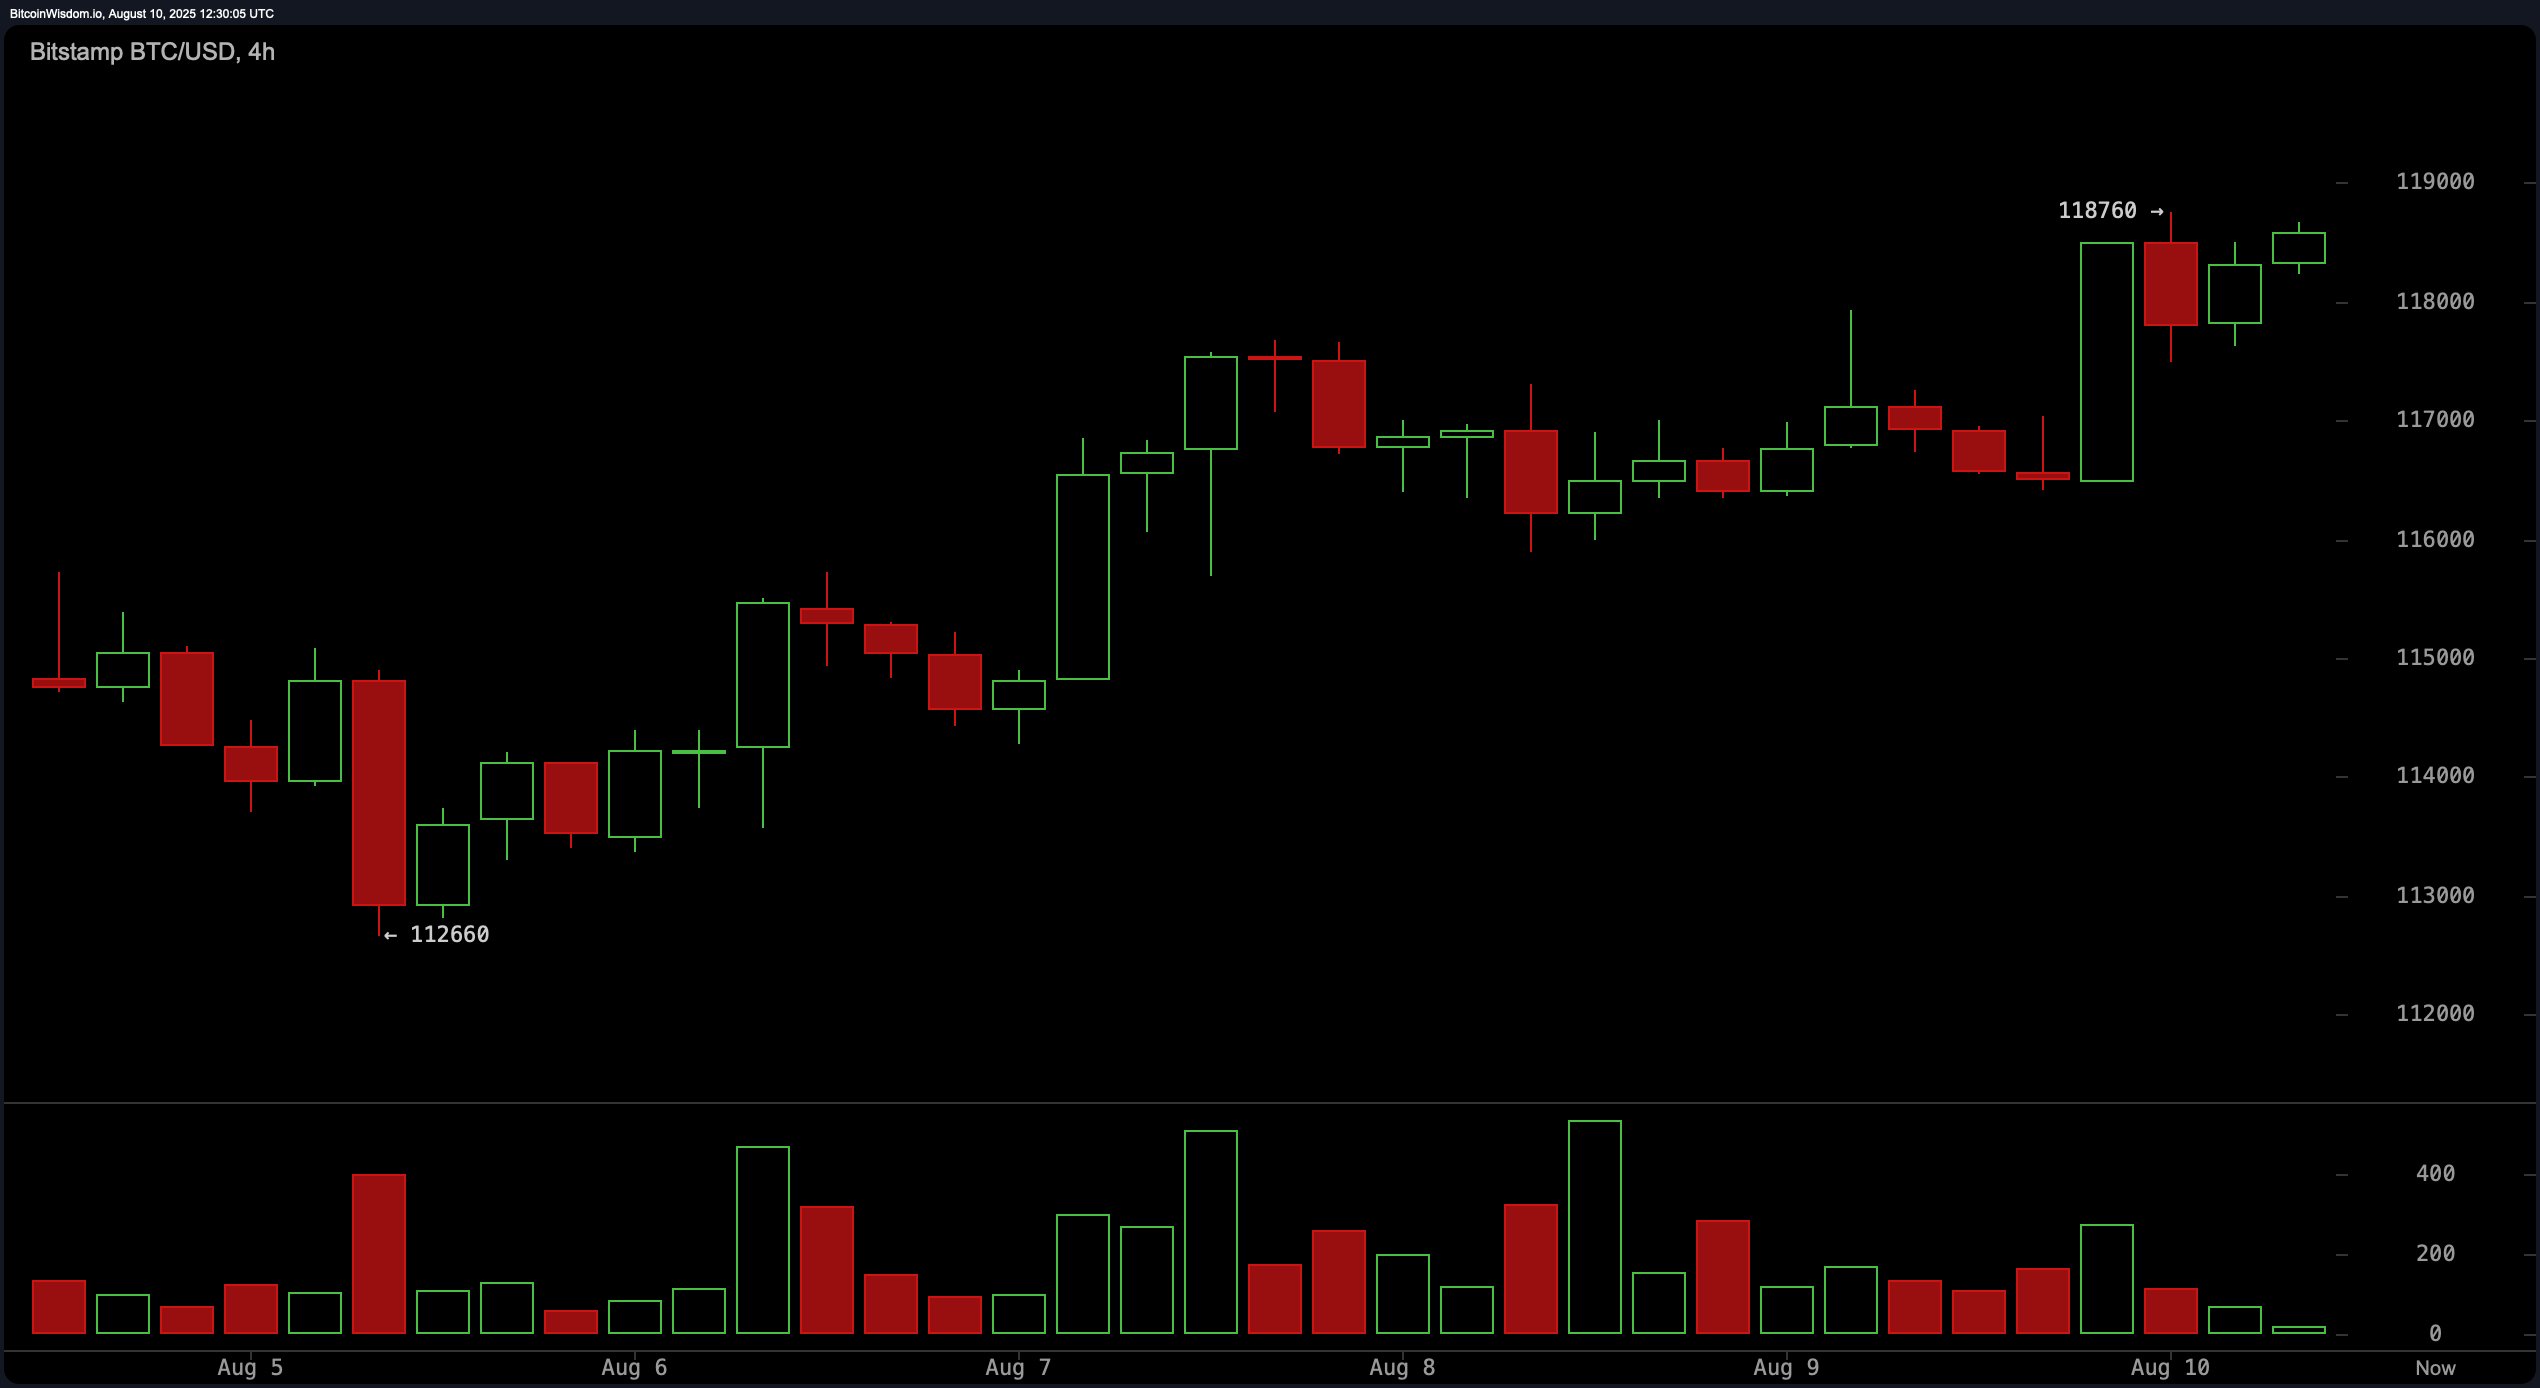
On the 4-hour chart, bitcoin has formed a series of higher highs and higher lows since reaching $112,660, with the most recent surge taking prices toward $118,760. This advance came on strong green volume, suggesting aggressive buying, though near-term resistance at $119,000 remains a significant hurdle. The average directional index (ADX) at 16 reinforces the idea that the prevailing trend strength is relatively weak, indicating potential for either a breakout attempt or a pullback. Traders may watch for entries on dips toward $117,000, with a cautious approach to profit-taking near $119,000 unless volume confirms a breakout.

BTC/USD 4-hour chart via Bitstamp on Aug. 10, 2025.
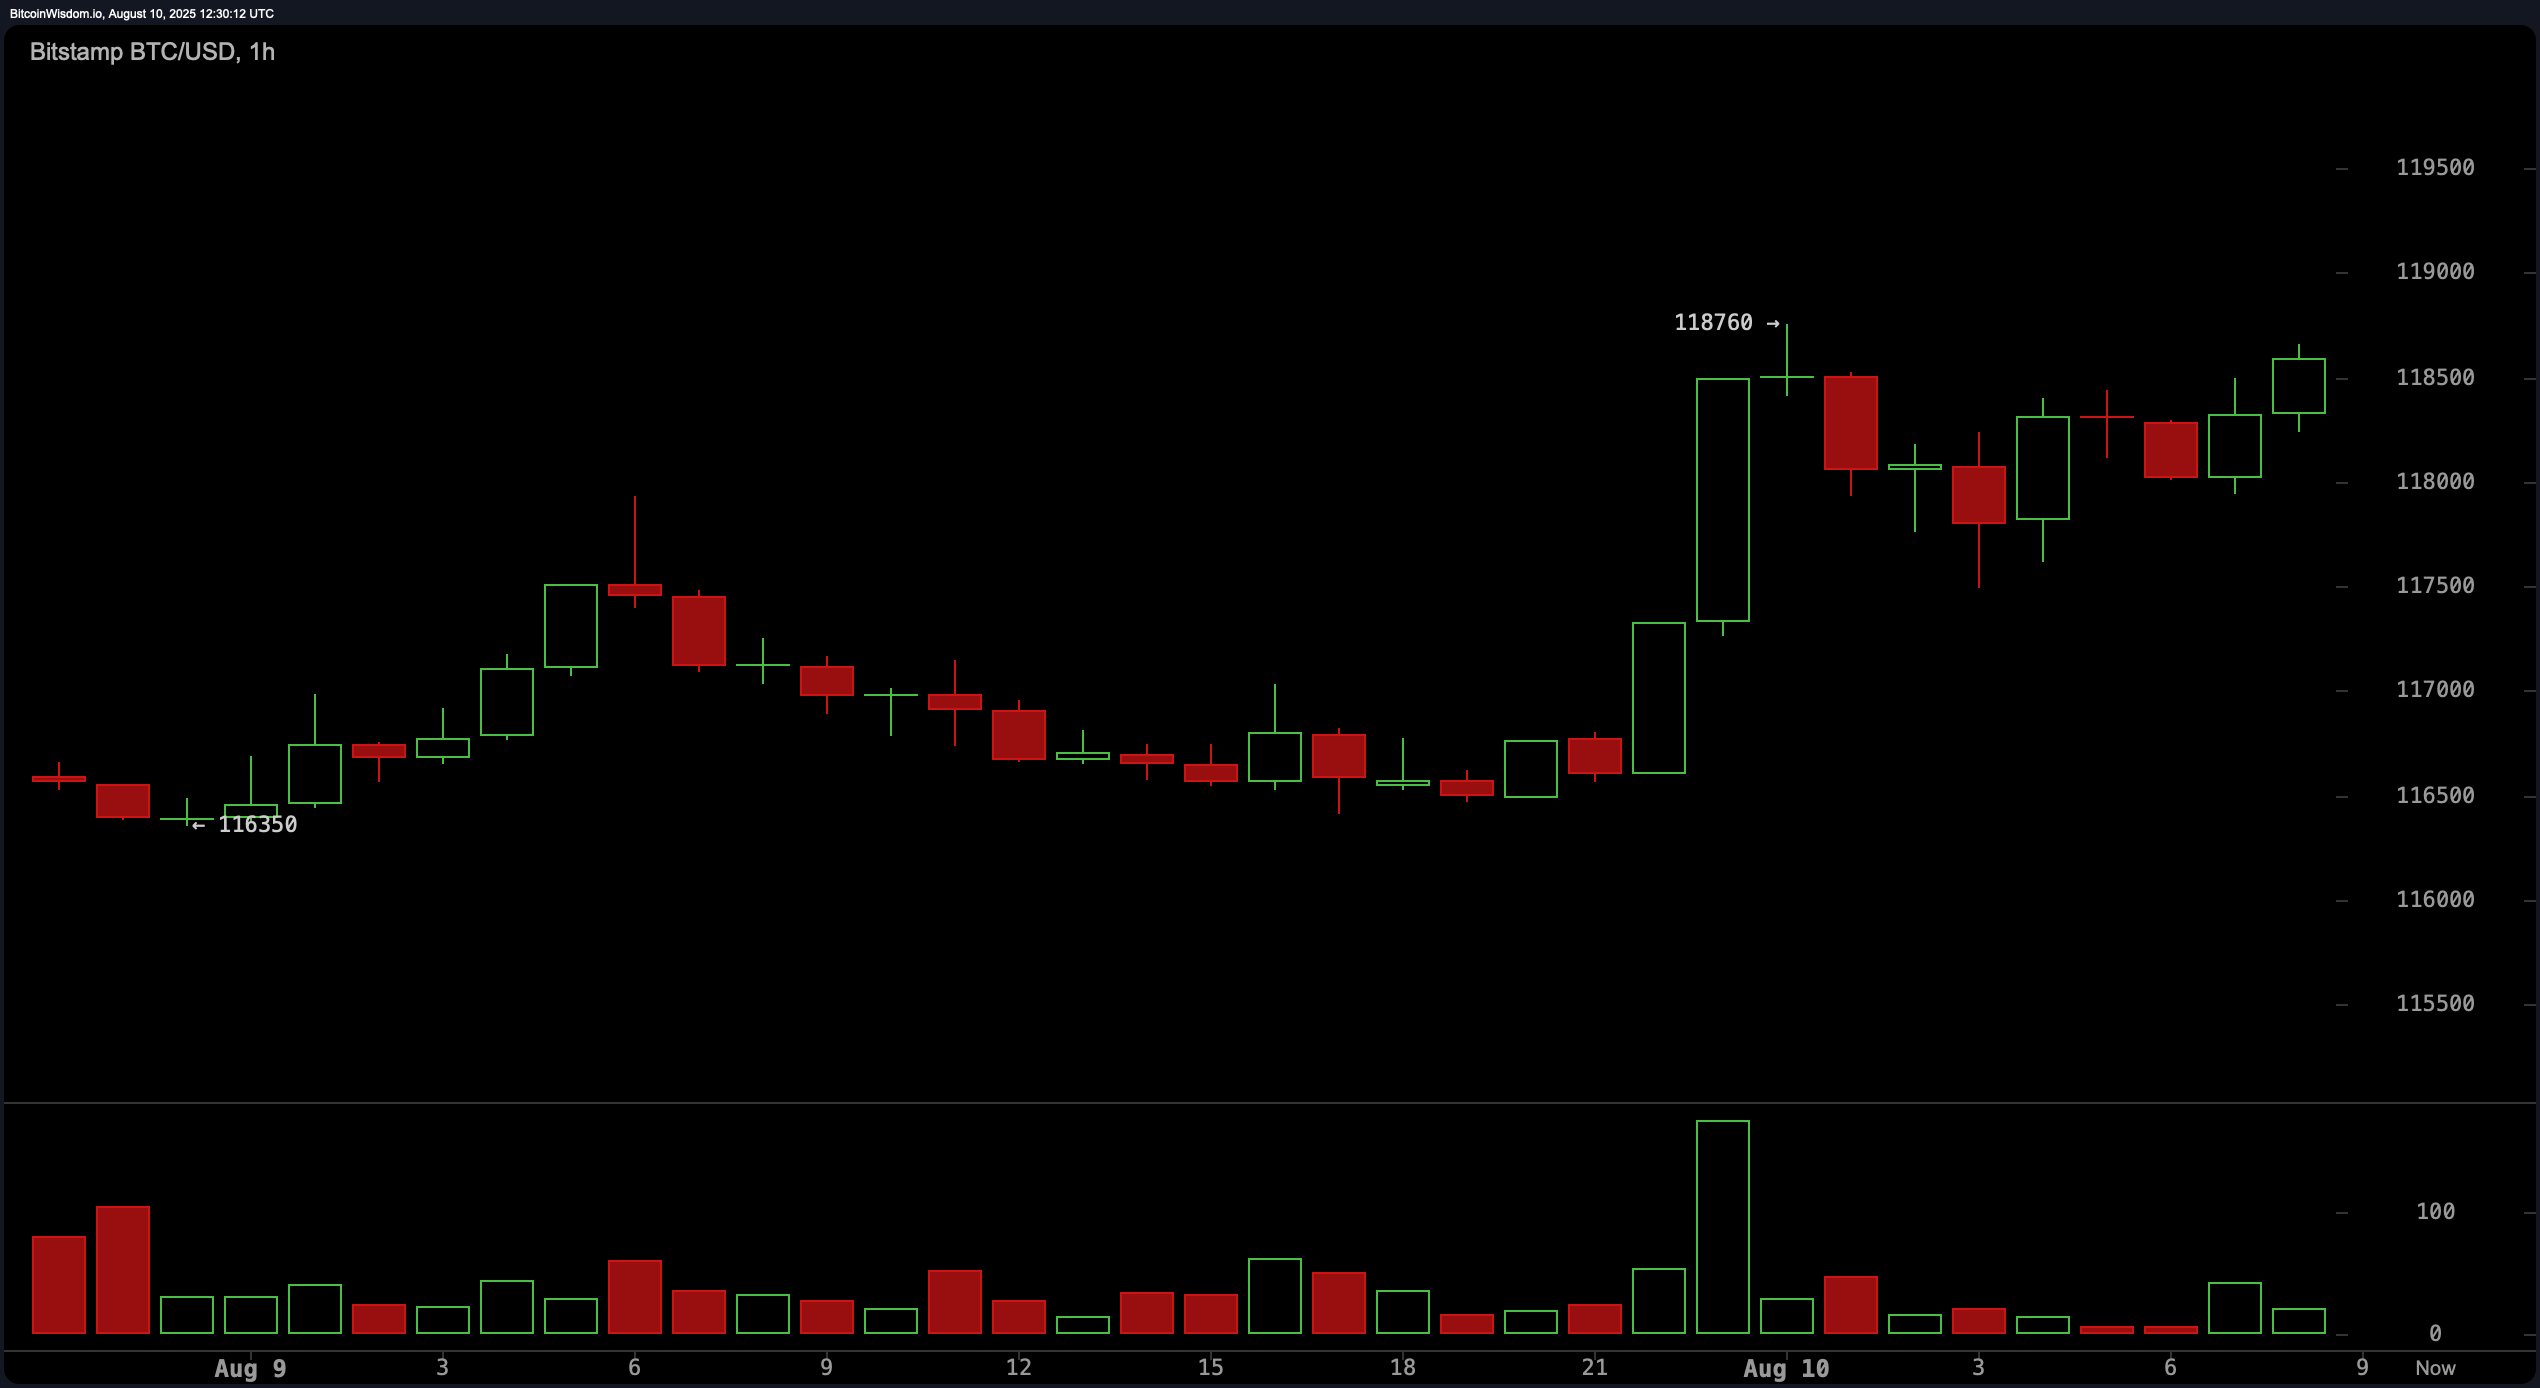
The 1-hour bitcoin chart reveals a sharp breakout from $116,350 to $118,760, followed by sideways price action forming a pennant-like pattern. This setup often precedes continuation if accompanied by renewed buying volume. However, the awesome oscillator at −237 remains neutral, and reduced momentum after the breakout suggests consolidation is still underway. A decisive push above $118,800 with strong green volume could trigger short-term scalps, while weak breakouts risk pullbacks toward $117,000.

BTC/USD 1-hour chart via Bitstamp on Aug. 10, 2025.
From a moving averages (MAs) perspective, the technical structure remains overwhelmingly bullish. All major exponential moving averages (EMAs) and simple moving averages (SMAs) from the 10-period to the 200-period — including EMA (10) at $116,458, SMA (20) at $116,765, EMA (50) at $113,759, and SMA (200) at $99,740 — are flashing positive signals. This alignment indicates that while short-term oscillators present a mixed-to-neutral picture, the underlying longer-term trend remains intact to the upside.
Overall, bitcoin’s price action suggests an underlying bullish bias but with overhead resistance constraining immediate upside. The market remains locked in a $112,000 to $123,000 range, with near-term dynamics hinging on the $119,000 level. A volume-backed breakout above this point could open the path to retesting $123,000, while failure to hold above $117,000 could invite a deeper pullback toward the $116,000 support zone. Traders appear poised for decisive movement, but the next wave of volume will likely determine the breakout’s legitimacy.
Bull Verdict:
Bitcoin’s strong alignment of all major exponential moving averages (EMAs) and simple moving averages (SMAs) in buy territory, combined with the formation of higher highs and higher lows on the 4-hour chart, supports the case for a breakout toward $123,000 if $119,000 resistance is cleared with strong volume.
Bear Verdict:
The presence of a sell signal on the moving average convergence divergence (MACD) and neutral readings across most oscillators, coupled with waning volume after the latest breakout, leaves bitcoin vulnerable to a pullback toward $116,000–$117,000 if resistance holds.
免责声明:本文章仅代表作者个人观点,不代表本平台的立场和观点。本文章仅供信息分享,不构成对任何人的任何投资建议。用户与作者之间的任何争议,与本平台无关。如网页中刊载的文章或图片涉及侵权,请提供相关的权利证明和身份证明发送邮件到support@aicoin.com,本平台相关工作人员将会进行核查。


