# 1. What is a Liquidation Heatmap
## 1. Characteristics of the Liquidation Heatmap
A liquidation heatmap is a tool that visually displays the distribution of potential liquidation orders in the market. It captures the open interest data of high-leverage traders to show where there are large amounts of potential liquidation orders within certain price ranges.
● Liquidation Orders: Refers to orders that are automatically closed or forcibly liquidated by the trading platform due to severe price fluctuations that deplete the margin of high-leverage traders.
● Logic of Liquidation Triggers: The higher the leverage, the closer the liquidation price is to the entry price. This often concentrates liquidations at certain key price points, forming a "liquidity pool." These areas are targets for venture capital firms and market manipulators, as they represent potential concentrated capital flow opportunities.
The liquidation heatmap relies on publicly available open interest data from exchanges. By calculating the open interest volume and high leverage distribution in each price range, the density of potential liquidation areas can be derived. The system typically uses color intensity to indicate this density:
● Darker Colors → Indicate that the area has a higher concentration of potential liquidation orders.
● Lighter Colors → Indicate that the area has fewer or no significant potential liquidation funds.
## 2. AiCoin Liquidation Heatmap
The AiCoin liquidation heatmap presents liquidation risk areas in a professional and intuitive manner, providing users with important references to identify potential market volatility points in advance:
● Real-time Dynamic Updates: The system updates the distribution of liquidation heat in real-time during trading hours, ensuring the timeliness of the data.
● Cross-Platform Analysis Support: The liquidation heatmap supports multiple mainstream exchanges and contract varieties, with extensive data coverage.
● Intuitive Color Scheme: Uses a gradient of light green, yellow, and purple-red to indicate liquidation intensity, helping investors quickly locate key areas.
Application Scenarios:
High-Leverage Area Warnings: Helps investors avoid hedging positions in high-risk liquidation areas, reducing losses from unprepared actions during market fluctuations. It also prevents setting their liquidation price in concentrated liquidation zones, lowering the risk of liquidation.
Reference for Major Player Behavior: Market makers or large capital often use liquidation liquidity pools to achieve their trading intentions. The liquidation heatmap can help identify these "liquidity hunting points," allowing investors to anticipate potential actions from large funds.
Assisting Technical Analysis: Combined with other technical indicators (such as support/resistance levels), the liquidation heatmap can provide auxiliary verification to confirm potential major trend target levels.
By effectively utilizing the liquidation heatmap, investors can respond more calmly to sudden market fluctuations, gaining an advantage in risk management and opportunity capture.
AiCoin - Heatmap Liquidation Tool Access:
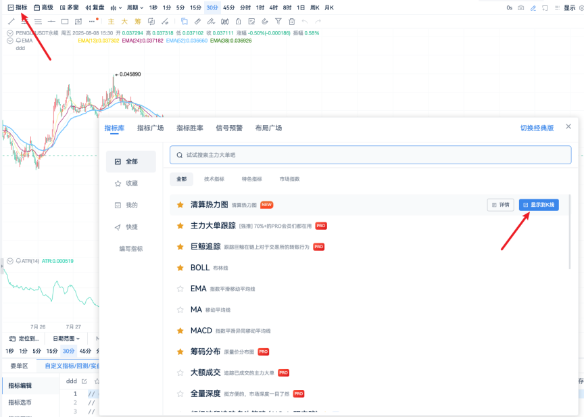
1) Open the liquidation heatmap tool page via: Click on the indicator in the top left corner of the AiCoin PC interface and select the first indicator.
2) Select the trading pair (currently only supports USDT perpetual trading pairs for BTC, ETH, and SOL on Binance and OKX).
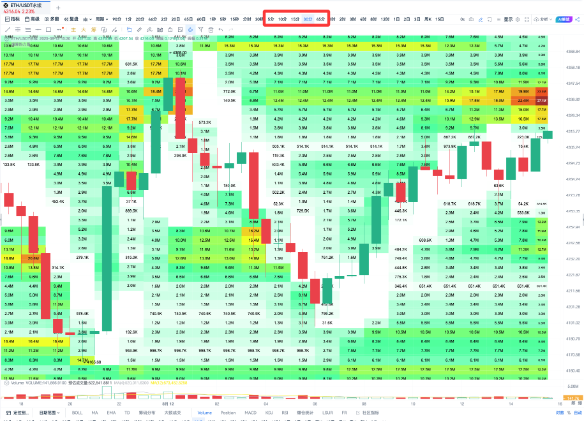
3) Select the time period (recommended 5 minutes - 45 minutes).
# 2. Core Uses of the Liquidation Heatmap
## 1. "Magnetic Zones": Attracting Prices
In the liquidation heatmap, the areas with the darkest colors often correspond to the regions with the highest liquidity concentration, referred to as "liquidity pools" or "magnetic zones."
● These areas are typically where liquidation orders are most concentrated, exhibiting extremely high capital flow density.
● Market prices have a natural tendency to gravitate towards these "magnetic zones" because the liquidity abyss is attractive to prices. Traders and major funds often push prices towards these areas, triggering market liquidation actions.
Strategy Tips:
● When the heatmap shows a magnetic zone with dense liquidations close to the current price in one direction, investors can view it as a short-term price target or mid-term directional guidance. For example, if there is a large concentration of liquidation orders for short positions above the price, the market may be pushed upward to trigger these liquidation orders; the opposite is also true.
● Note that the closer you get to the magnetic zone, the more intense the short-term fluctuations, but once a breakout occurs, the direction becomes clearer, requiring a response based on market sentiment.
Example Illustration:
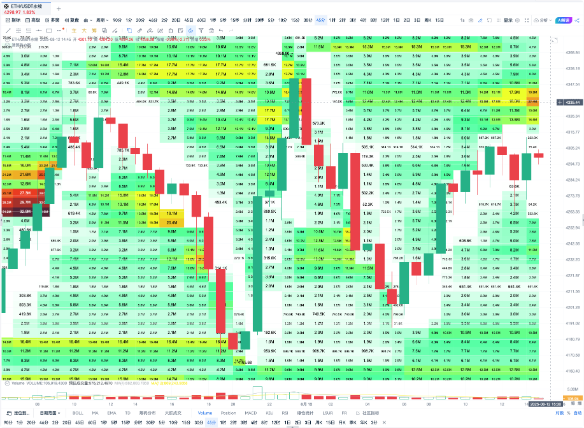
Figure: OKX-ETHUSDT Perpetual Contract 45-Minute Cycle
Above the latest price:
Price: $4335.23, the liquidation area forms a dark color zone, indicating that this position has created a short-term magnetic zone, likely attracting short-term prices towards it. At this point, the price may experience a slight increase in the short term.
## 2. "Reversal Zones": Forming Price Support or Resistance
In addition to "attracting prices," dense liquidation areas often form new support or resistance after triggering liquidations, becoming "reversal zones." The emergence of these areas mainly stems from the resonance between market price fluctuations and certain capital and technical signals.
● Price reaching a high liquidation zone above → Potential Resistance Level (Bearish Signal)
When the price rises rapidly and approaches the upper magnetic zone, a large number of short positions are liquidated, releasing liquidity. However, the bullish momentum may wane, and the price could face resistance and retreat near this position.
● Price reaching a high liquidation zone below → Potential Support Level (Bullish Signal)
Similarly, when the price retraces and touches the lower magnetic zone, a large number of long positions are forcibly liquidated, releasing bearish momentum, and the price may rebound from this point.
Strategy Tips:
● Clarify the Direction: Observe the market's "tracking trajectory" through the heatmap distribution, clarifying the current price's position relative to the magnetic zone (close, far, crossing).
● Corresponding Verification: Combine volume indicators (trading volume, capital flow) with traditional technical analysis tools such as support/resistance to strengthen the reliability of reversal signals.
Example Illustration:
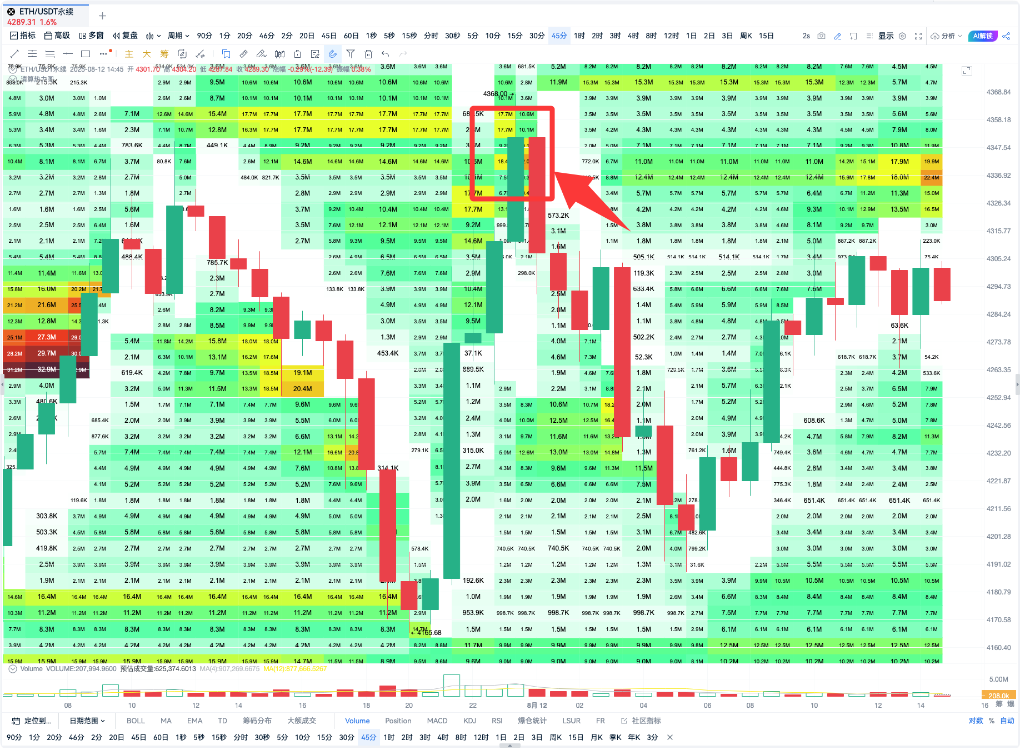
Figure: OKX-ETHUSDT Perpetual Contract 45-Minute Cycle
In the area circled in red:
This position is a deep yellow area, resulting in concentrated liquidations, which formed a high-level resistance after the liquidation, releasing liquidity. Subsequently, the price experienced a slight decline.
Comprehensive Use:
● The "magnetic zone" reveals the core of market liquidity, with prices tending to flow and gather in that area;
● The "reversal zone" helps us anticipate the formation of support and resistance areas, fundamentally understanding the logic of market price fluctuations.
● Combining Both provides a more comprehensive liquidation heatmap strategy, offering rich reference points for short-term, mid-term, and even capital management.
# 3. Analyzing in Combination with Other Indicators
The liquidation heatmap effectively captures key liquidity dense areas in the market. If combined with other indicators for multi-dimensional verification, it can enhance the accuracy and operability of strategies.
## Major Orders + Liquidation Heatmap
The flow of major orders is one of the key driving forces behind market price changes. When the high liquidation zones (dark yellow or dark purple areas) in the liquidation heatmap align with the direction of major large orders, the probability advantage of the market trend significantly increases.
1) Large Long Orders Inflow + Magnetic Zone Attraction
If a major order has executed a large amount of long orders (e.g., over ten million dollars), and at the same time, the liquidation heatmap shows a dark area (e.g., yellow or purple) above the price, it indicates that the bullish major player is likely to have completed their positioning, targeting the deep color magnetic zone above. At this point, the probability of the price continuing to rise is very high.
2) Large Short Orders Inflow + Magnetic Zone Attraction
If a major order has executed a large amount of short orders (e.g., over ten million dollars), and at the same time, the liquidation heatmap shows a dark area (e.g., yellow or purple) below the price, it indicates that the bearish major player is likely to have completed their positioning. At this point, the probability of the price declining or experiencing a significant retracement is very high.
By combining major order execution data with the liquidation heatmap, investors can more clearly identify the flow of capital at key price levels and formulate precise trading strategies based on changes in liquidity dense areas.
## Combining Other Indicators:
Indicators such as MACD, TD Sequential, OBV, etc., also have significant reference value:
● MACD (Trend Confirmation Tool)
When combined with the liquidation heatmap, it is suitable for confirming the trend direction after a breakout.
● TD Sequential (Turning Point Capture Tool)
Combined with the liquidation heatmap, it can enter high sell-low buy trades at reversal points in high liquidation zones.
● OBV (Capital Flow Monitoring Tool)
When combined with the liquidation heatmap, it is used to verify the inflow and outflow of capital within the magnetic zone, assessing the continuity and strength of the market trend.
By integrating other technical indicators, the liquidation heatmap can more efficiently help traders capture trend and reversal signals, improving the overall win rate and execution of trading strategies.
# 4. Conclusion
The liquidation heatmap, as an innovative capital flow analysis tool, can accurately identify liquidity dense areas in the market, providing strong references for capturing key support and resistance prices.
In practical applications, by combining information on the flow of major orders, the reliability of magnetic zones can be effectively verified, further increasing the win rate of price trend judgments. Additionally, using traditional technical indicators (such as MACD, TD Sequential, OBV, etc.) in conjunction can help traders confirm market signals from multiple dimensions, optimizing the comprehensiveness and effectiveness of trading strategies.
Overall, the liquidation heatmap not only provides traders with a unique perspective on understanding market sentiment and capital behavior but also injects new momentum into the scientific and precise nature of trading decisions. By interpreting and flexibly utilizing this tool, traders can enhance their win rates in the rapidly changing market and seize more robust profit opportunities.
免责声明:本文章仅代表作者个人观点,不代表本平台的立场和观点。本文章仅供信息分享,不构成对任何人的任何投资建议。用户与作者之间的任何争议,与本平台无关。如网页中刊载的文章或图片涉及侵权,请提供相关的权利证明和身份证明发送邮件到support@aicoin.com,本平台相关工作人员将会进行核查。


