This article is from: The DeFi Report founder Michael Nadeau
Translation|Odaily Planet Daily (@OdailyChina); Translator|Azuma (@azuma_eth)
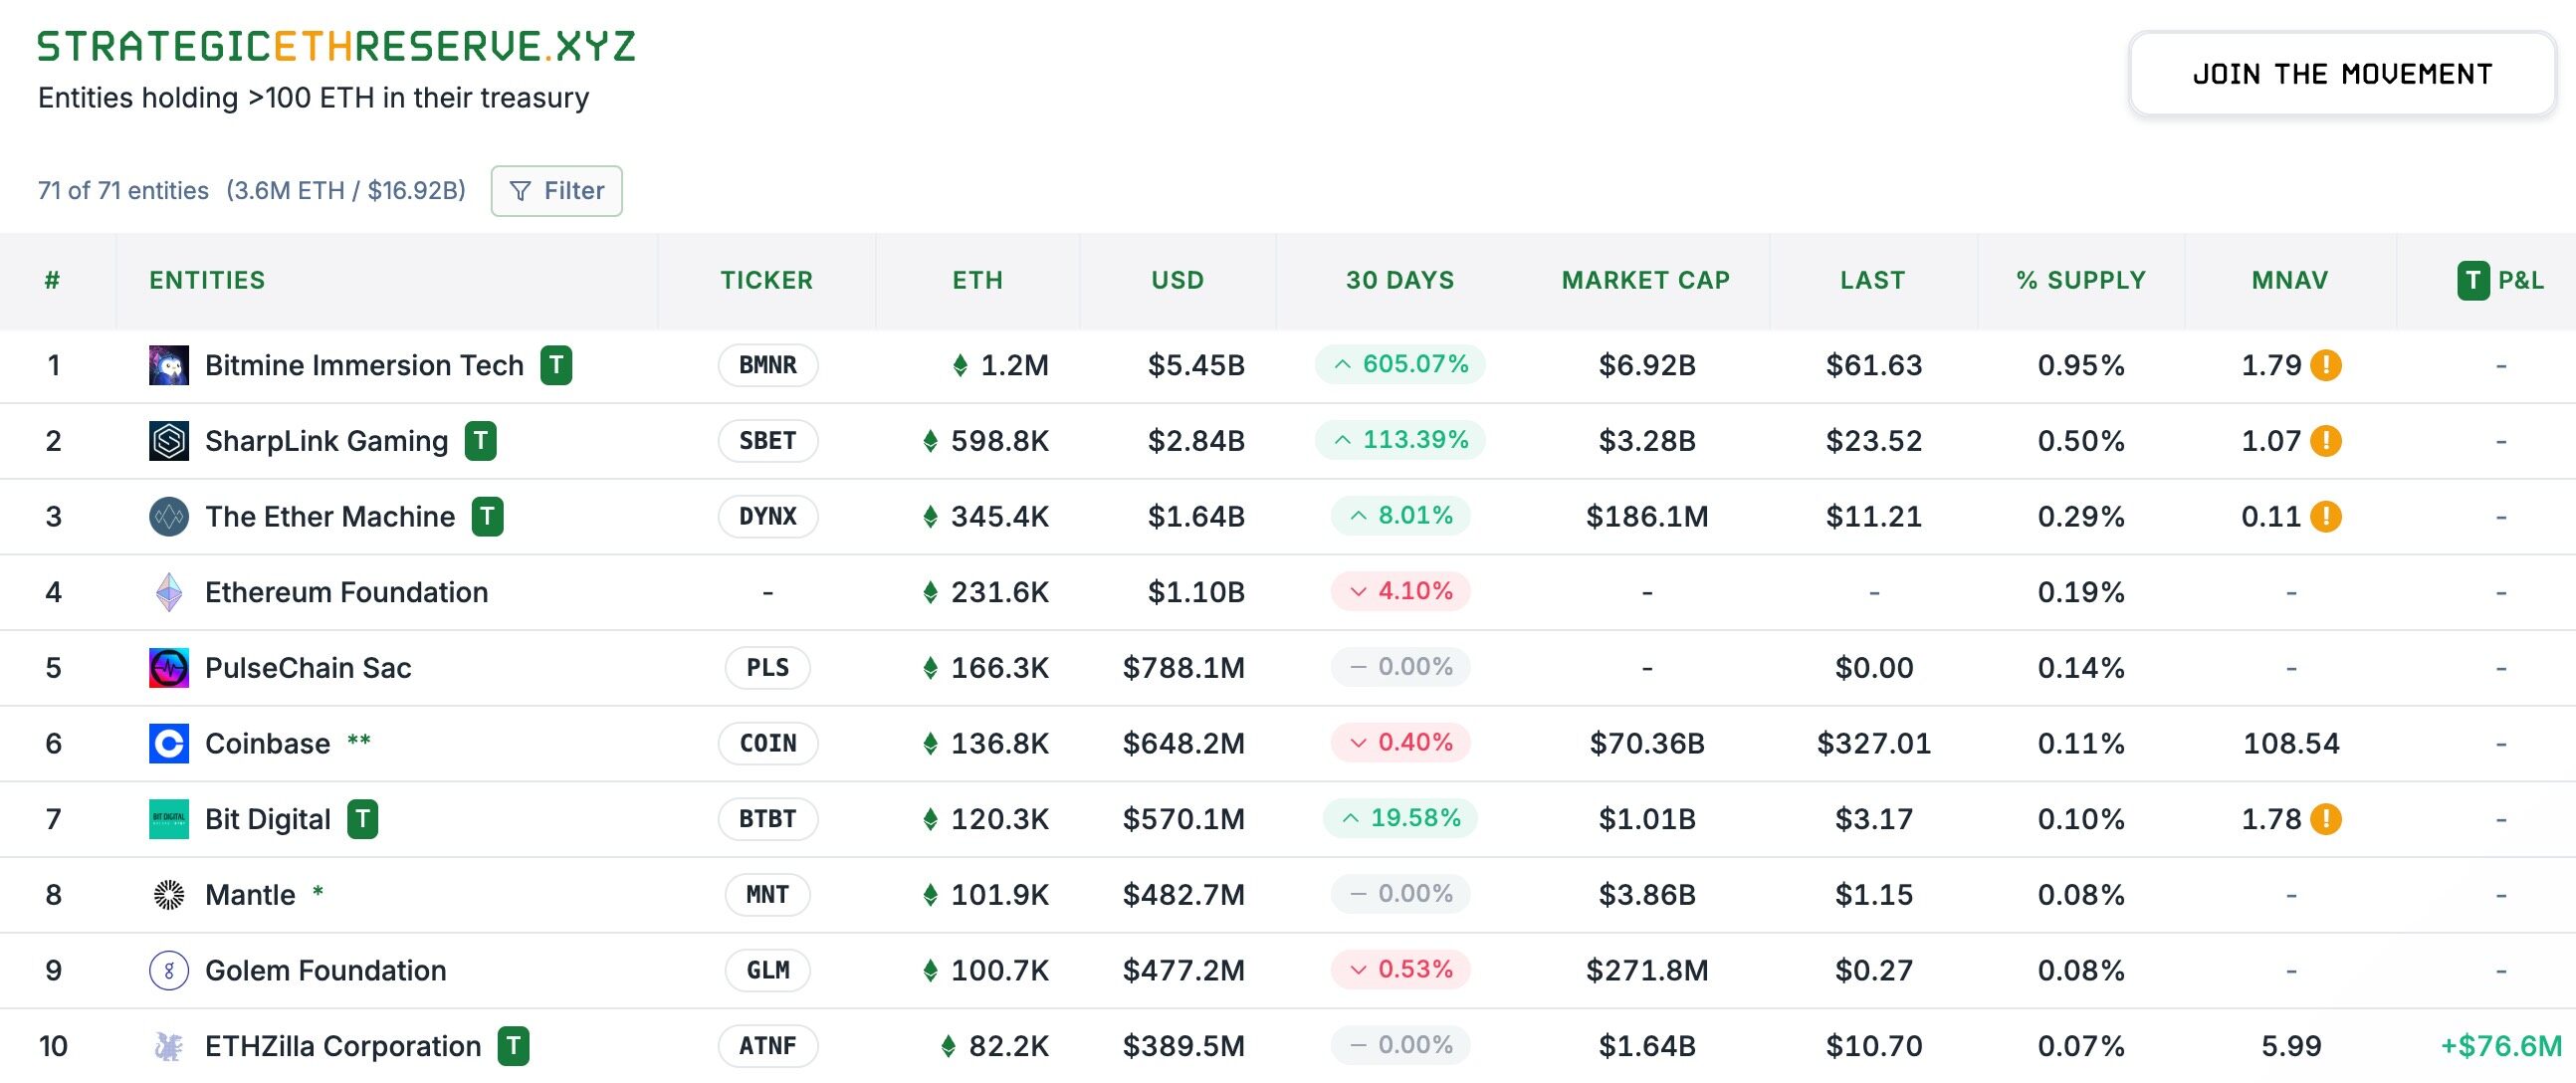
Editor's Note: The crazy buying spree of ETH treasury companies has become the hottest topic in the recent market, constituting the strongest "buying pressure" on ETH prices. Strategic ETH Reserve data shows that as of August 14, Beijing time, the total holdings of major ETF treasury companies have reached 3.57 million ETH, valued at approximately $16.92 billion, with BitMine (BMNR), Sharplink Gaming (SBET), and The Ether Machine (DYNX) holding 1.2 million, 598,000, and 345,000 ETH respectively, ranking in the top three.
This morning, Michael Nadeau, founder of The DeFi Report, who has been closely monitoring the status of ETH, reviewed the distribution of ETF chips outside of treasury companies and the changing trends (Note: There will be some overlap between the holdings of treasury companies and the classifications below), which may help you assess the sources of ETH's future momentum.
Below is the original text by Michael Nadeau, translated by Odaily Planet Daily.
People often discuss the price trends of ETH, but the real key lies in its distribution pattern. Once you understand the actual distribution of ETH—existing in different areas such as ETFs, staking contracts, Layer 2, wrapped tokens, exchanges—you can gain insights into:
- Who truly holds the control;
- The flow of funds and the actual liquidity scale;
- Where the next round of "buying pressure" may come from;
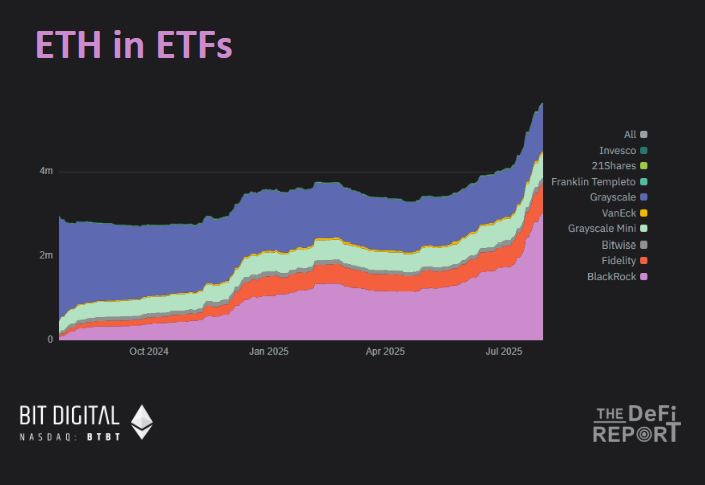
ETF Holdings
Various Ethereum ETFs currently control about 5% of the ETH supply.
In the past three months, the assets under management of ETH ETFs have grown by 80%, with BlackRock and Fidelity's ETFs accounting for 73% of the AUM.
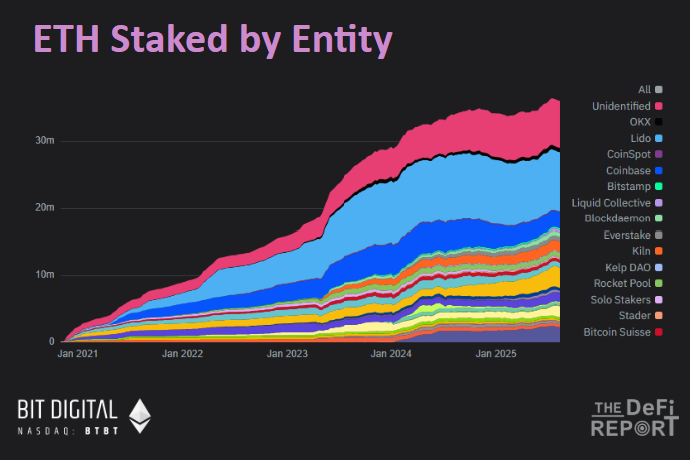
Staking
Currently, about 29.7% of ETH is staked.
In the past three months, the staking scale of ETH has increased by 5%, while the market share of leading staking platform Lido has decreased by 3.5%, and Binance's staking share has increased by 23%, currently ranking second in market share.
As more ETH treasury companies stake their ETH, we expect this number to continue to rise in the coming months.
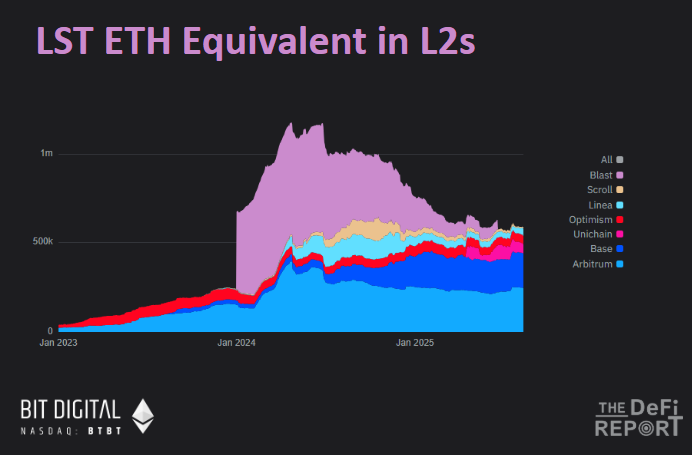
Layer 2 (including LST)
ETH in Layer 2 currently accounts for only 5% of the circulating supply.
Over a year ago, Blast accounted for 52% of the Layer 2 ETH supply, but now it is almost 0%—the incentive program was a complete waste of money. Currently, 41% of ETH on Layer 2 is on Arbitrum, and 33% is on Base.
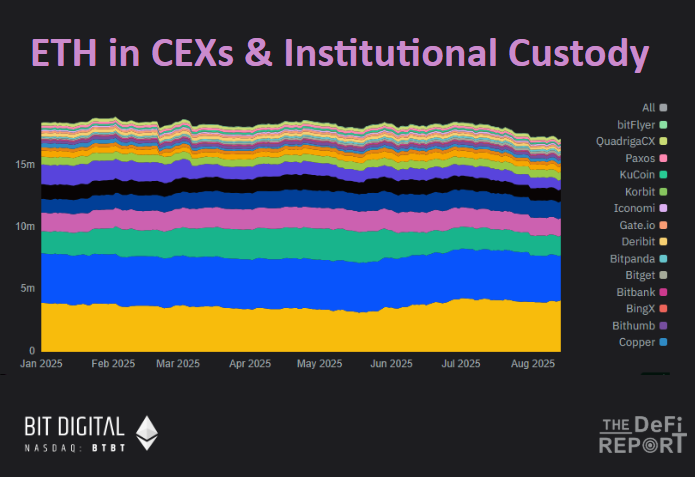
Centralized Exchanges (CEX)
Currently, the total amount of ETH in major CEXs accounts for 14% of the circulating supply.
Since the third quarter, this number has decreased by 6.7%, currently at its lowest level since July 2016.
Where has all this ETH gone? Most of it has gone into staking contracts and cold wallets.
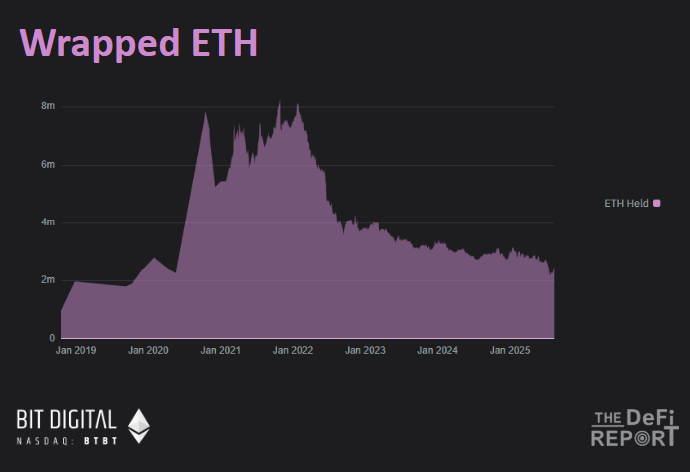
Wrapped ETH
Wrapped ETH currently accounts for only 1.8% of the circulating supply.
Since the beginning of 2022, this number has decreased by 70% from its peak, and this downward trend aligns with the upward trend of ETH in staking contracts.
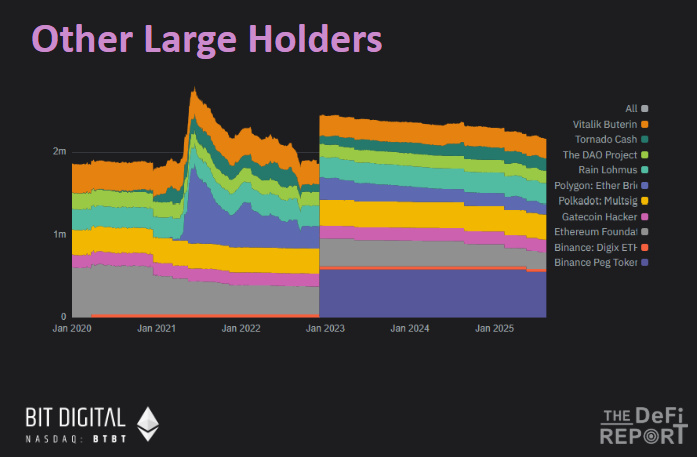
Other Large Holding Entities and Individuals
In addition to the above categories, other large holding entities and individuals account for approximately 1.7% of ETH holdings.
Of this 1.7%, Binance's Binance Peg Tokens Fund accounts for about 25%, while Polygon Bridge, Tornado Cash, the Ethereum Foundation, and Vitalik himself are the main holders.
In summary, the six charts above cover about 55% of the ETH supply. Beyond that, the remaining ETH is mostly stored in externally held accounts (EOA) and cold wallets.
免责声明:本文章仅代表作者个人观点,不代表本平台的立场和观点。本文章仅供信息分享,不构成对任何人的任何投资建议。用户与作者之间的任何争议,与本平台无关。如网页中刊载的文章或图片涉及侵权,请提供相关的权利证明和身份证明发送邮件到support@aicoin.com,本平台相关工作人员将会进行核查。