Early holders typically control a large supply of tokens, and their buying and selling decisions are crucial to market trends. Understanding the behavior patterns of early holders can provide traders with important insights into market trends and potential price corrections/tops.
This article is a curated translation from Antonio Manrique de Lara Martín's "Tracking Early Token Holder Behavior," translated by Benpaocai · Web3.0 Reading Room.
By analyzing four key indicators: "Early Holder Balance," "Herfindahl Index," "Net Unrealized Profit/Loss (NUPL)," and "Cost Basis Distribution Heatmap (CBD)," this article helps traders understand methods for predicting price tops and effectively managing risks.
Four Key Indicators
- Early Holder Balance
- Herfindahl Index
- Net Unrealized Profit/Loss (NUPL)
- Cost Basis Distribution Heatmap (CBD)
By examining the same phenomenon from multiple angles, traders can more accurately predict market shifts and optimize exit timing.
1. Early Holder Balance
A direct method to assess the influence of early holders is to track changes in their holdings. Early holders typically accumulate tokens at low prices. As the asset appreciates, some holders begin to sell, increasing market selling pressure and often triggering price corrections. Tracking the evolution of their holdings can reveal trends of large-scale profit-taking, assisting in predicting corrections.
How It Works
- Balance Dips: When early holders sell, their total holdings decrease. If this phenomenon coincides with price peaks, it indicates significant selling pressure, potentially marking the formation of a top.
- Price Impact: Due to controlling a large supply, early holders' selling can trigger sharp price declines.
- Chart Insights: Monitoring balance changes can identify large-scale profit-taking trends, aiding in predicting market corrections.
Figure 1↓ shows how early holders of SHIB accumulated tokens at low prices (once accounting for over 20% of total supply) and sold off significantly after the price surged, causing a sharp price drop.
In the chart, the blue line represents SHIB holdings, while the yellow line shows the percentage of early holders relative to total supply, clearly presenting their relative holding evolution and the market impact of their selling activities.
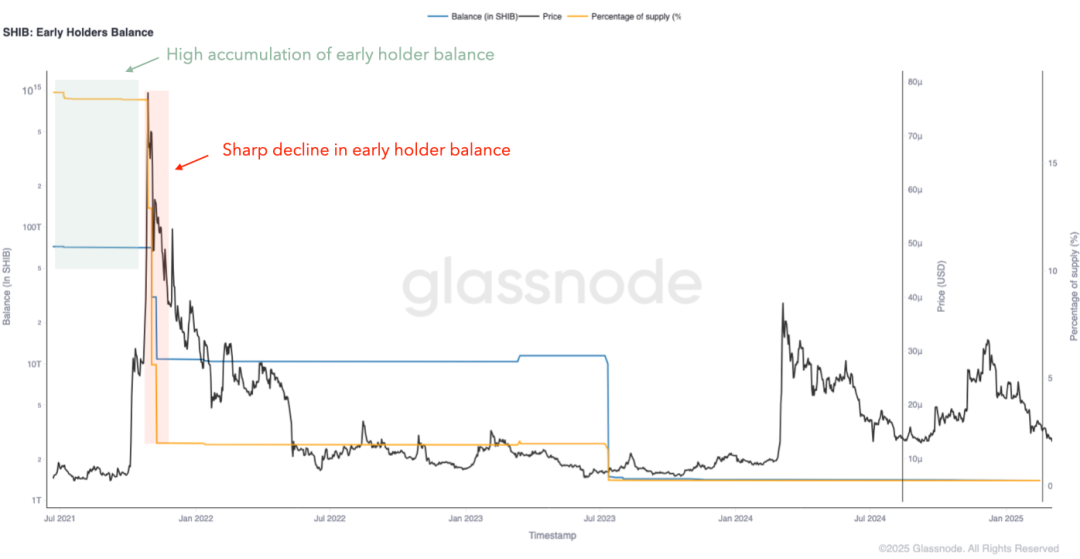
Figure 1. SHIB Early Holder Balance
To maintain consistency in the analysis of the same asset, the subsequent indicators in this article will focus on SHIB. However, before delving deeper, a horizontal comparison of early holder balances across different tokens is valuable for observing behavioral differences and their potential impact on prices.
Figure 2↓ presents the strategic selling of early holders of APW at key price peaks:
- First Sell-off (left of the chart): The yellow line representing the proportion of early holders' holdings drops sharply, indicating large-scale selling near the first price peak.
- Accumulation Phase (middle of the chart): After the first sell-off, the remaining early holders show low activity.
- Second Sell-off (right of the chart): When the price rises again, early holders sell off a large portion of their holdings after accumulating, causing a steep decline in their supply proportion.
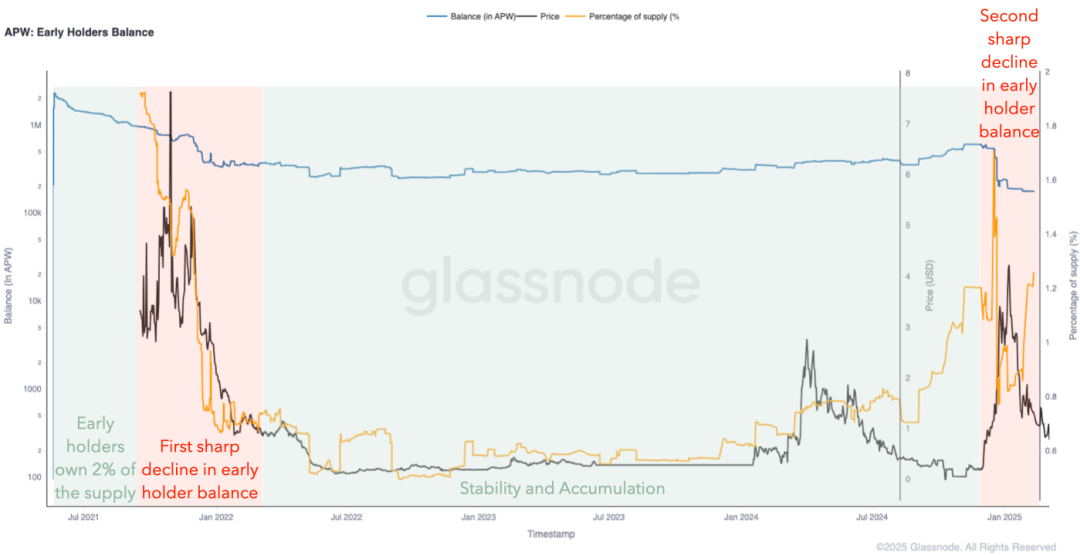
Figure 2. APW Early Holder Balance
Figure 3↓ shows that early holders of TSUKA have a gradual decrease in holdings, differing from the previous examples of sudden sell-offs:
- Steady decline in holdings avoids sharp price drops.
- More controlled selling leads to better price stability.
- Dispersed selling pressure reduces market impact.
This indicates that they adopted an orderly exit strategy, effectively suppressing extreme volatility.
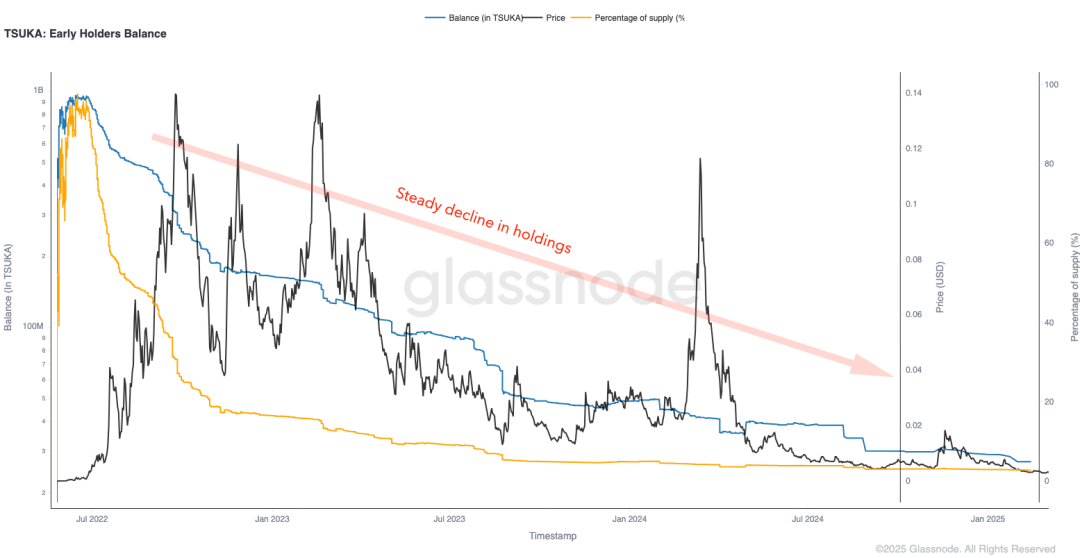
Figure 3. TSUKA Early Holder Balance
In Figure 4↓, early holders of PEPE sold off most of their tokens immediately after the first price increase (the orange line drops sharply on the left):
- Early Exit: Most tokens were sold off early, causing a sharp price drop but avoiding subsequent large-scale selling pressure (similar to the SHIB model).
- Price Discovery: After early holders exit, the market can price more organically.
- Long-term Stability: Due to the lack of subsequent large distributions, price movements are driven more by new demand rather than large holder activities. This model avoids gradual selling pressure, allowing the market to form a fair price without ongoing supply shocks.
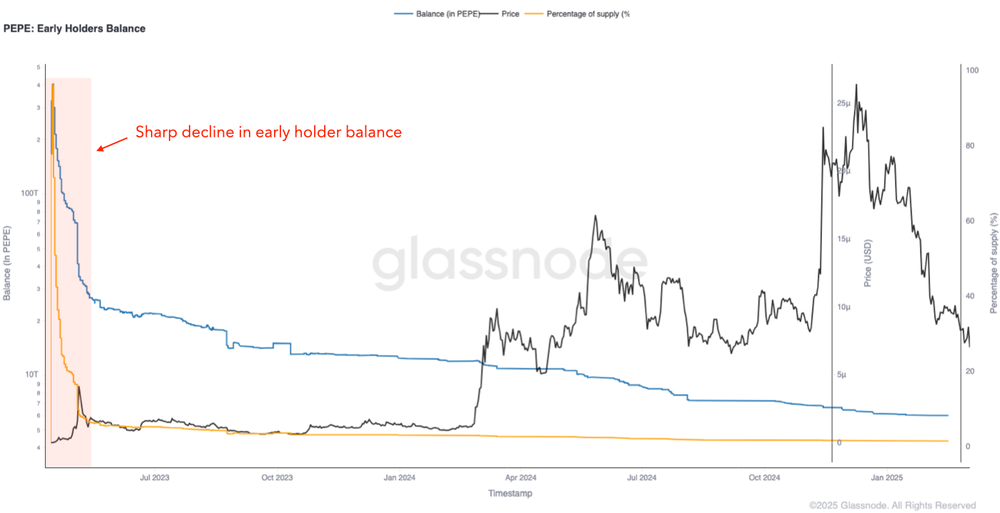
Figure 4. PEPE Early Holder Balance
2. Monitoring the Herfindahl Index
The Herfindahl Index measures market concentration. A high index indicates that a few large holders dominate the market; a low index reflects a more dispersed token distribution.
How It Works
- Early Holder Influence: In the early stages of token issuance, early holders often concentrate supply, raising the Herfindahl Index.
- Market Dynamics: As they sell, the index decreases, reflecting a broader distribution of tokens.
- Market Signals: The Herfindahl Index declines alongside early holder balances, indicating that tokens are being distributed to more market participants, suggesting potential profit-taking behavior and a possible market top.
Figure 5↓ shows the SHIB Herfindahl Index (red line) alongside price (black line). The sharp drop in the index corresponds to moments of large holder sell-offs, aligning with price peaks.
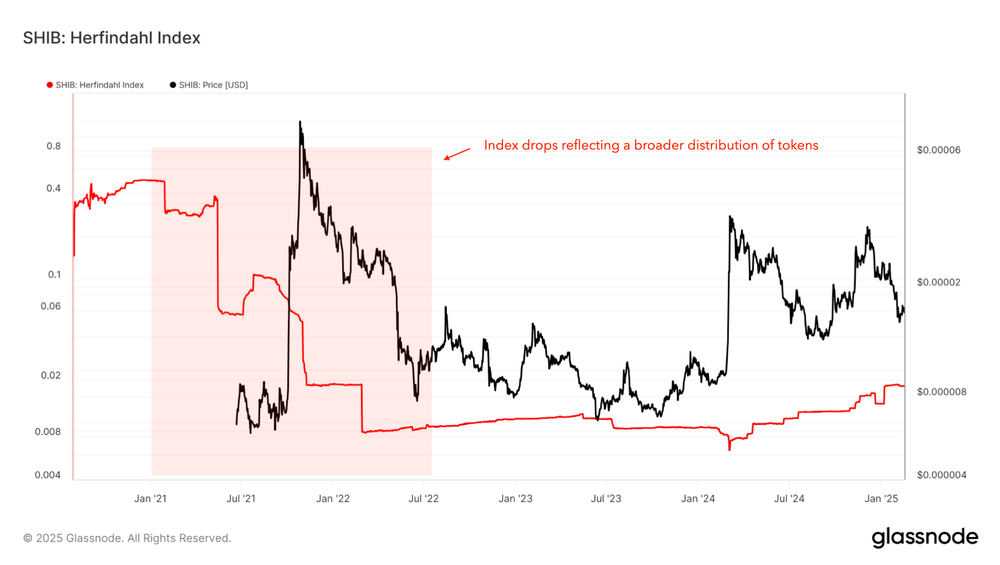
Figure 5. SHIB Herfindahl Index
3. Utilizing Net Unrealized Profit/Loss (NUPL)
Net Unrealized Profit/Loss (NUPL) is an on-chain metric that quantifies the unrealized gains and losses of all holders at a specific point in time. As a sentiment indicator, it can detect potential market tops and bottoms based on the profit and loss status of investors.
For early holders, their profit-taking behavior often manifests in early peaks of NUPL—since they typically accumulate at low prices and sell during strong price increases.
How It Works
- Early NUPL Rises → Market Euphoria and Sell-offs: High NUPL values early in the token's lifecycle indicate that most holders are in profit, often triggering profit-taking by early holders, increasing selling pressure.
- Early NUPL Declines → Large Holder Exit: If the token reaches new highs but NUPL begins to decline early, it indicates that early adopters and large holders are selling, leading to a weakening market structure.
Figure 6↓ presents SHIB's NUPL alongside price, showing that early high NUPL values coincide with price peaks, often followed by sell-offs. Pay special attention to the first price peak (corresponding to the most active phase of early holders, consistent with the balance indicator observation).
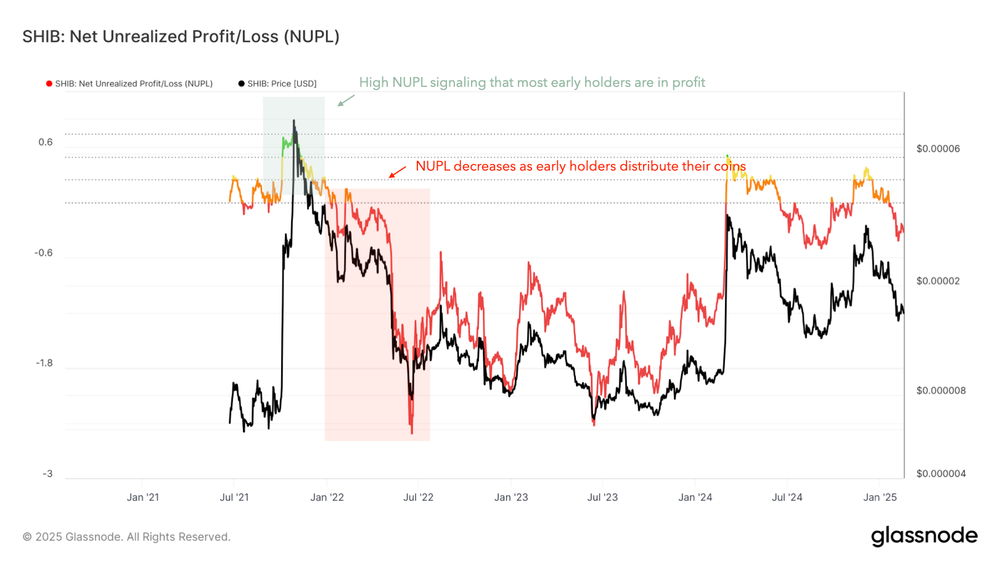
Figure 6. SHIB Net Unrealized Profit/Loss (NUPL)
4. Analyzing Cost Basis Distribution (CBD)
The CBD heatmap visualizes the acquisition cost (cost basis) of tokens over time. Focusing on the early stages of the chart can identify the cost basis range of early holders, providing insights into their initial accumulation areas and the evolution of their selling behavior.
How to Read the CBD Heatmap
- The vertical axis represents specific cost basis levels, with color intensity reflecting the supply accumulation at that average entry price (blue = low concentration, red = high concentration).
- The black line represents the current price.
- Areas below the black line are in profit (cost basis below current price).
- Areas above the black line are in loss (cost basis above current price). This visualization helps track the evolution of accumulation areas and whether supply is being sold over time.
How It Works
- Low Cost Basis: Early holders accumulate tokens at extremely low prices, forming a low-cost basis accumulation area (e.g., the red area in the January 2021 chart).
- Accumulation vs. Selling: As prices rise, holders begin to sell, causing the low-cost area to thin out (the red area in the chart turns blue, indicating that the supply accumulated at low prices is being sold).
- Top Identification: If the heatmap shows a large amount of low-cost holdings being sold near price peaks, it may indicate a market top.
- Sell-off Prediction: The CBD heatmap not only reveals the selling behavior of early holders but also predicts their selling tendencies—by visualizing their cost basis, it exposes the price levels at which they accumulated tokens. Comparing the current price with these accumulation areas can assess the strength of their profit-taking motivations. If the price is far above the accumulation area, the probability of early holders selling increases, making the heatmap a powerful tool for predicting potential sell-offs.
Figure 7↓ shows the heatmap indicating that early holders of SHIB accumulated in the low-price area in January 2021 (red and yellow areas) and sold off significantly near the market peak in October-November 2021, reflected in the sharp price increase, fading early accumulation, and subsequent decline.
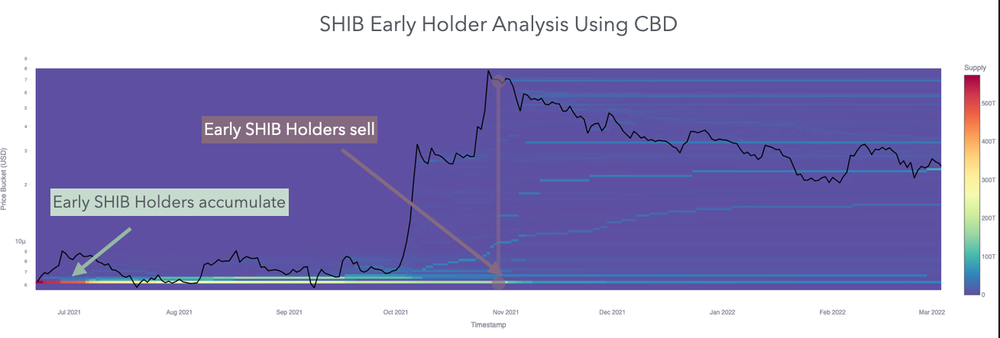
Figure 7. SHIB Early Cost Basis Distribution
5. Conclusion: Framework Value and Application Strategies
By comprehensively utilizing the four methods, traders can analyze early holder behavior from multiple dimensions, assisting in predicting potential market tops:
- Early Holder Balance Analysis: Reveals the timing of early investors' reduction in holdings (often preceding price declines).
- Herfindahl Index: Tracks changes in market concentration, identifying large holder exits or ownership dispersion.
- Net Unrealized Profit/Loss (NUPL): Assesses market sentiment; high NUPL values indicate that early holders have substantial unrealized profits, increasing the likelihood of sell-offs.
- Cost Basis Distribution Heatmap (CBD): Precisely identifies profit-taking points for early investors (potentially marking the end of an uptrend).
The four types of indicators complement each other, interpreting early holder behavior from different dimensions. When multiple indicators send coordinated signals, the predictive strength significantly increases, reducing uncertainty and optimizing decision-making.
By integrating these insights, traders can optimize their strategies and navigate the early market stages of tokens with greater confidence.
免责声明:本文章仅代表作者个人观点,不代表本平台的立场和观点。本文章仅供信息分享,不构成对任何人的任何投资建议。用户与作者之间的任何争议,与本平台无关。如网页中刊载的文章或图片涉及侵权,请提供相关的权利证明和身份证明发送邮件到support@aicoin.com,本平台相关工作人员将会进行核查。


