The fluctuations in the cryptocurrency market are like the waves in a turbulent sea, making people feel anxious. However, its charm lies in the fact that it never looks at your past report card. Stop saying "I'll enter the market when it stabilizes"; opportunities in the crypto world never lie in "stability." The real dividends always belong to those who dare to position themselves amid uncertainty. Market volatility is not a risk; failing to understand trends is the biggest risk.
On August 14, Bitcoin reached a historical high of $124,500, but subsequently, influenced by better-than-expected U.S. retail sales data and fluctuations in consumer confidence, the strengthening dollar caused Bitcoin to drop over $7,000, briefly falling below the $117,000 support. The current price is around $117,500.
From a technical perspective, Bitcoin has been in a continuous daily correction, with the MACD showing a death cross and the KDJ falling back to the neutral zone at 45, indicating bearish momentum. On the four-hour chart, the last candle is a bullish one, but trading volume has decreased, and the market is relatively quiet, with the price between the middle and lower bands, while the Bollinger Bands are narrowing, indicating reduced volatility. Although the MACD green bars remain negative and are gradually shortening, it is necessary to observe whether a golden cross can be confirmed for a rebound.
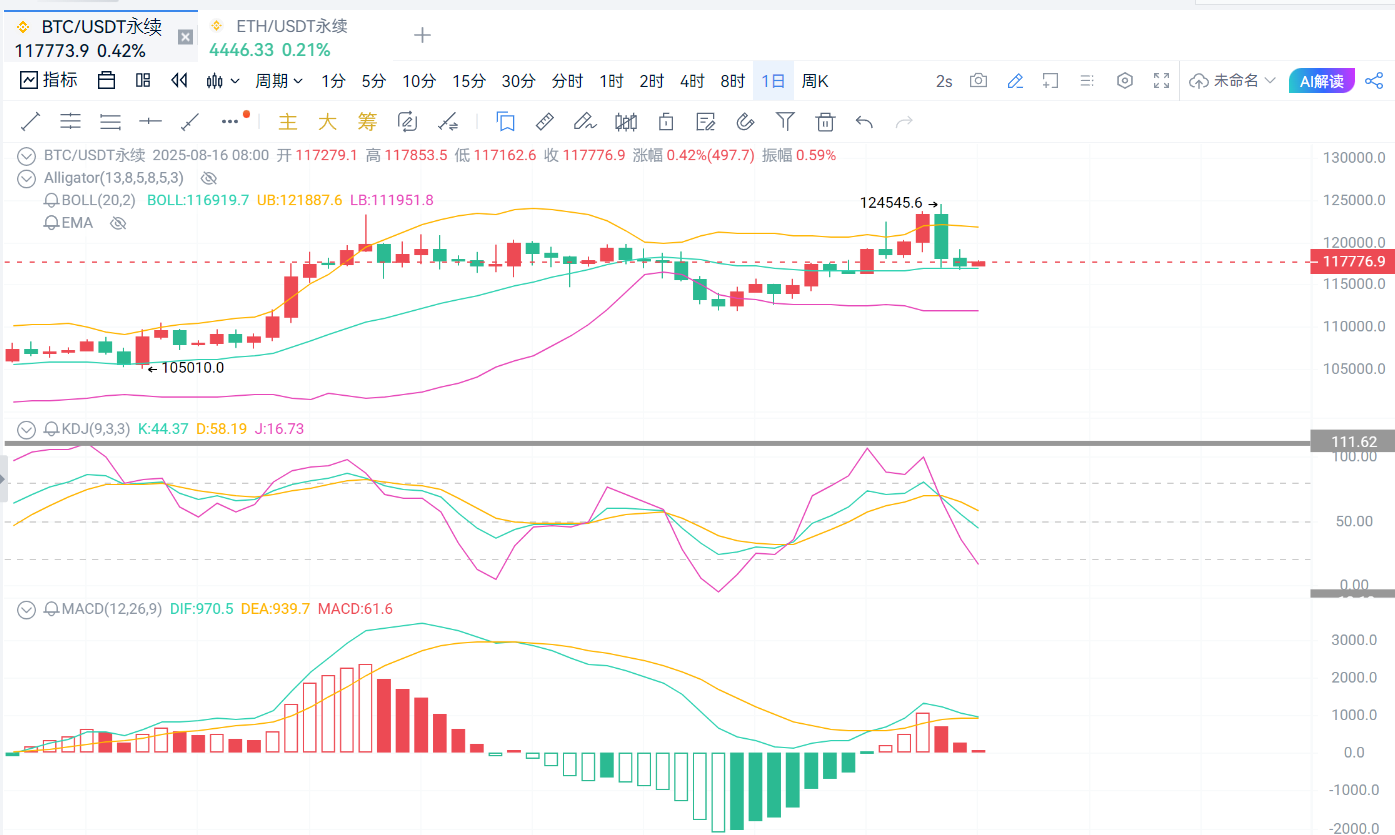
Long position operation range suggestion: Buy lightly on a pullback to $116,500-$117,000, with a stop loss at $115,500-$116,000 and a target of $118,500-$119,500.
Short position operation range suggestion: Sell lightly on a rebound to around $119,500, with a stop loss at $120,500 and a target of $117,000-$116,500.
Ethereum reached a high of $4,794 on August 14, just a step away from breaking the historical high of $4,877, but subsequently fell significantly due to Bitcoin's correction, with the current price around $4,420, a drop of over 3.54% within 24 hours, hitting a daily low of $4,364, showing a divergence in capital flow.
From a technical perspective, the daily K-line has broken below the EMA30 trend line ($4,478), and the four-hour Bollinger Bands are opening downwards, with short-term support moving down to $4,286. The hourly chart has formed a "descending triangle" structure, with the EMA120 moving average showing significant resistance, and shrinking trading volume indicating that selling pressure has not been fully released.
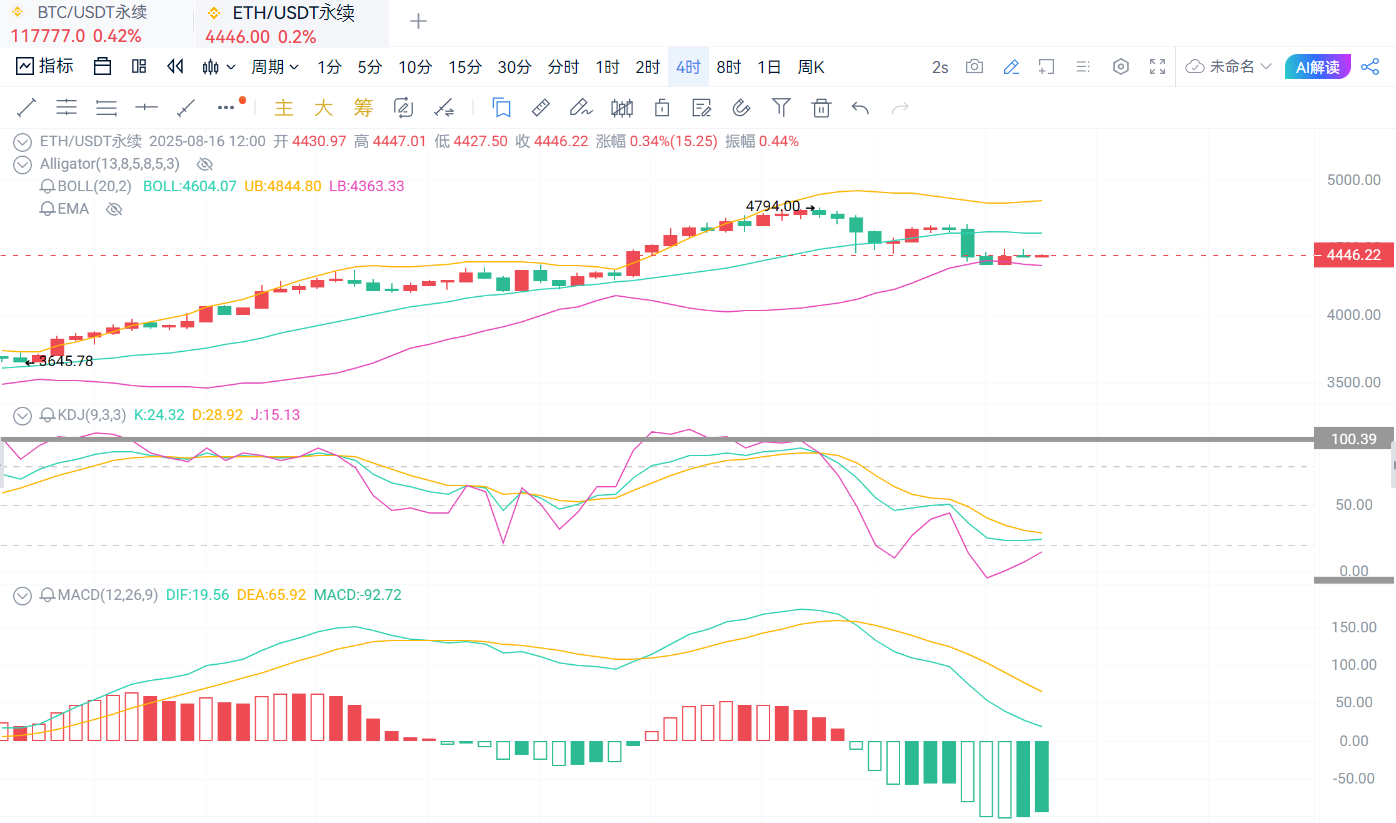
Long position operation range suggestion: Buy on a pullback to the $4,400-$4,420 range, targeting $4,480-$4,520, with a stop loss at $4,365. Short position operation range suggestion: Sell lightly on a rebound to the $4,550-$4,600 range, targeting $4,450-$4,480, with a stop loss at $4,620.
The cryptocurrency market is highly volatile, and the above analysis is for reference only and does not constitute investment advice. Investors should formulate strategies based on their own risk tolerance and make cautious decisions.
Due to the timeliness of price points, there may be delays in post reviews; specific operations should still be based on real-time market conditions. The above operational range analysis is for reference only; the cryptocurrency market carries high risks, so please manage your risk well and make cautious decisions when investing. If you are interested in specific indicator analysis or the impact of new market dynamics on prices, feel free to scan the QR code for the public account in the article below. You are welcome to visit.
Friendly reminder: The content of the above article is original by the author, and the advertisements at the end of the article and in the comments section are unrelated to the author; please be cautious!
免责声明:本文章仅代表作者个人观点,不代表本平台的立场和观点。本文章仅供信息分享,不构成对任何人的任何投资建议。用户与作者之间的任何争议,与本平台无关。如网页中刊载的文章或图片涉及侵权,请提供相关的权利证明和身份证明发送邮件到support@aicoin.com,本平台相关工作人员将会进行核查。


