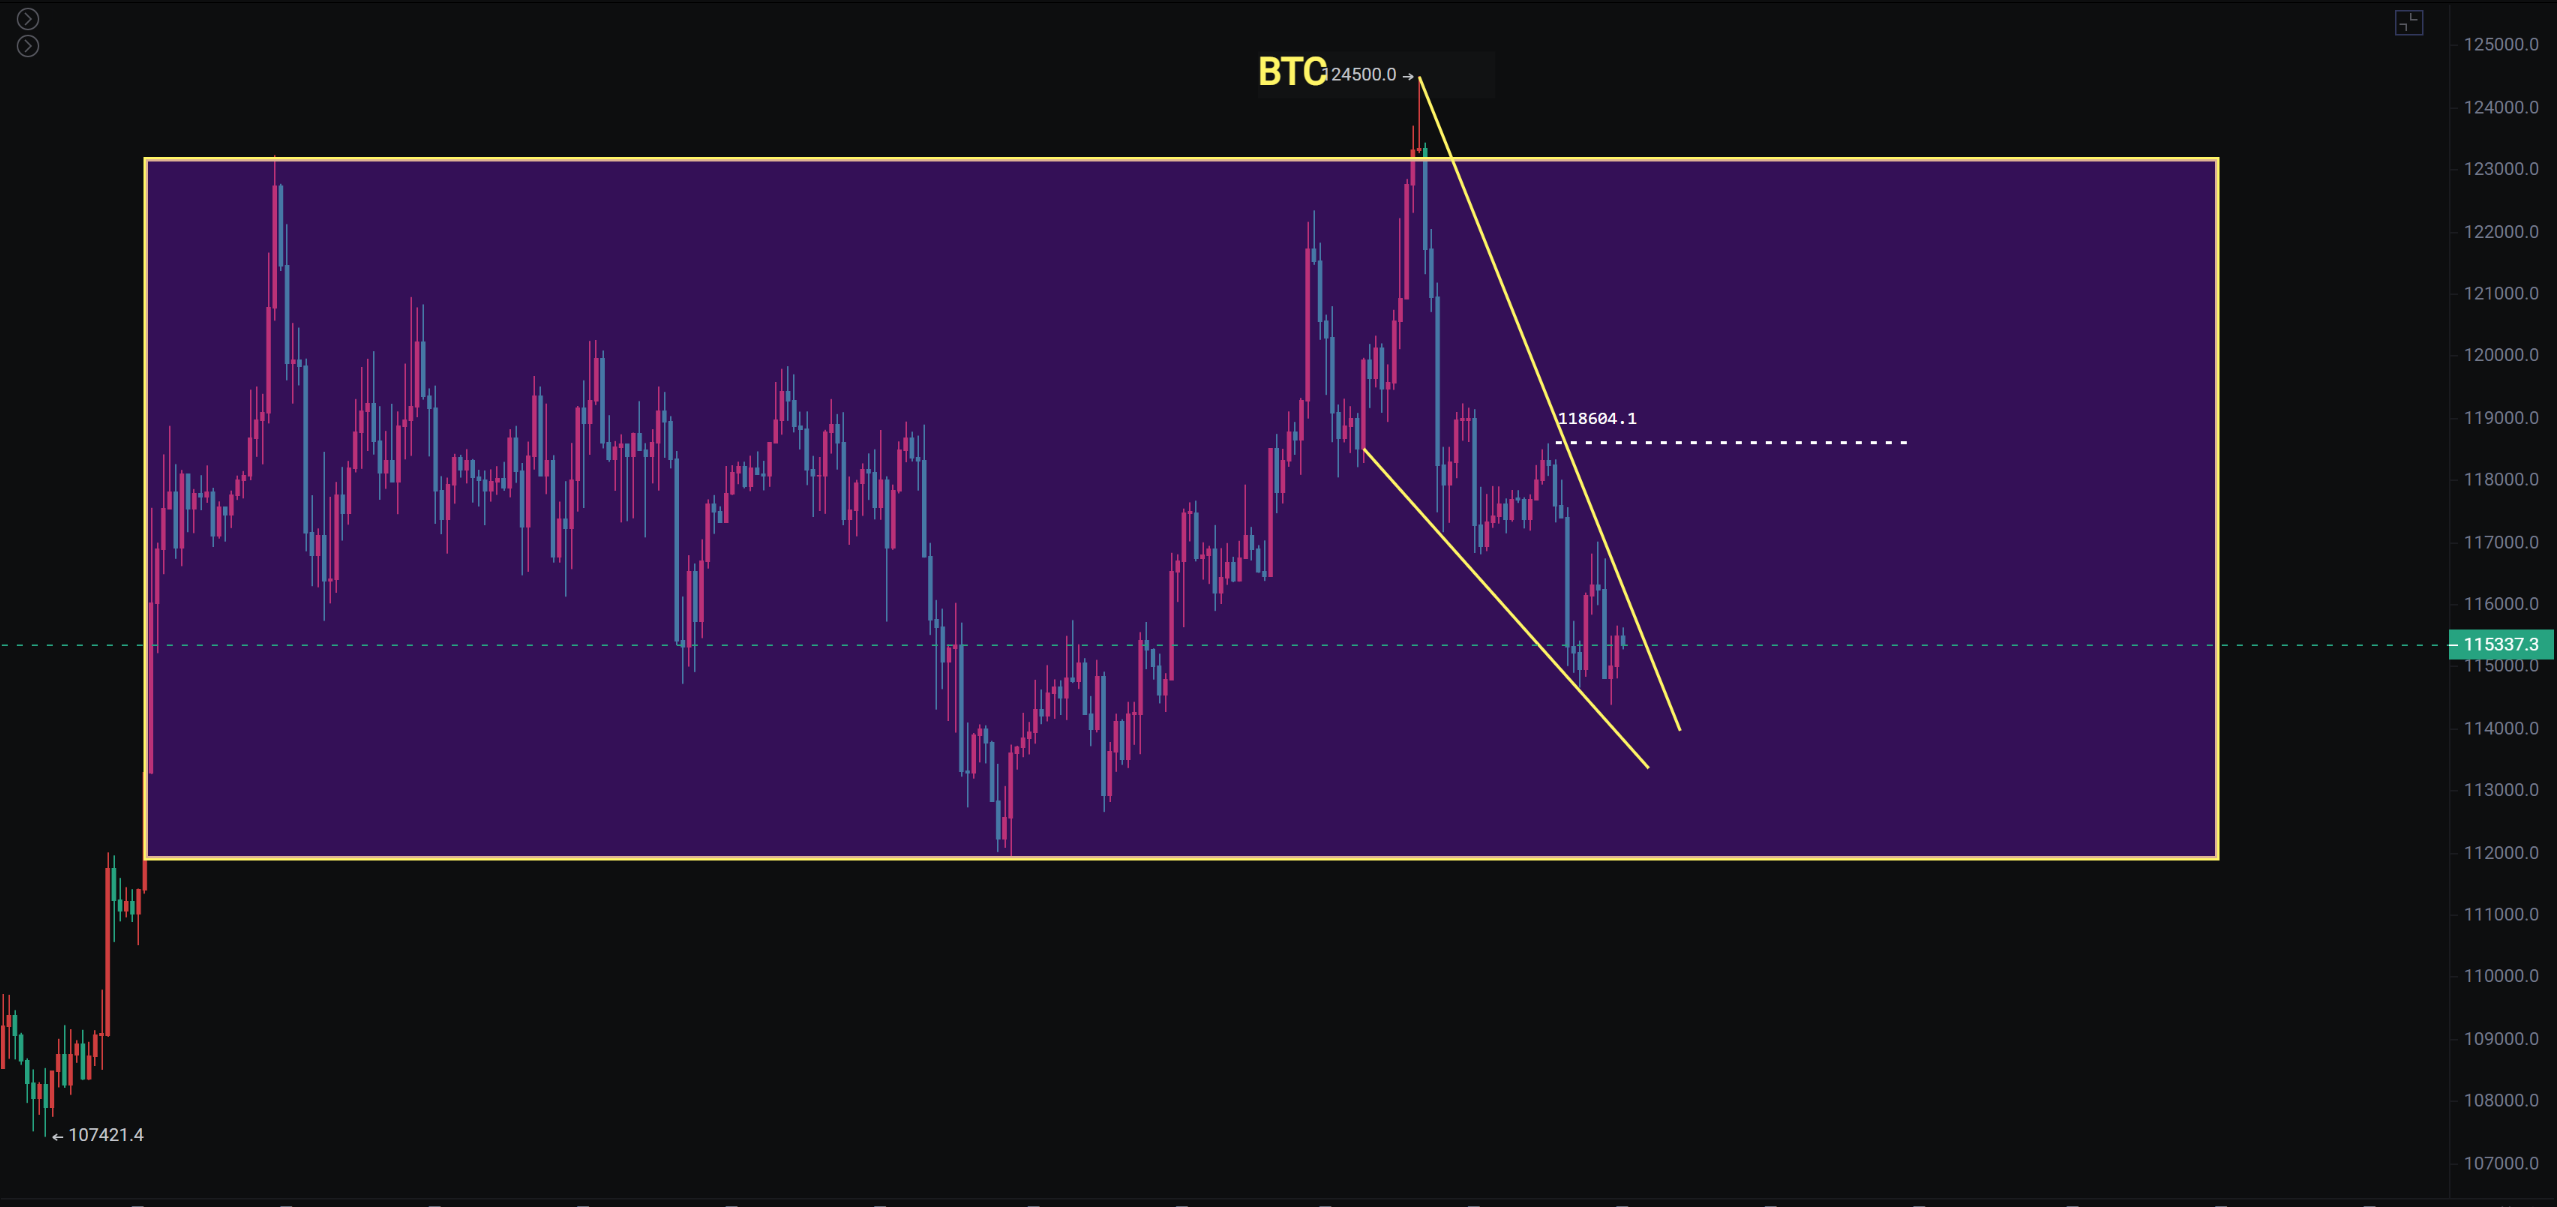
After Bitcoin reached a historical high, it fell back after a false breakout and has been declining for six days. It is currently touching the bottom of the range around 114,000, where there will be short-term support. The 4-hour chart has formed a descending wedge, so we will focus on the height of this rebound pressure at 118,600, with key support continuing downwards around 112,000. This level cannot be broken by a large bearish candle; if it breaks, the risk of further declines will increase.
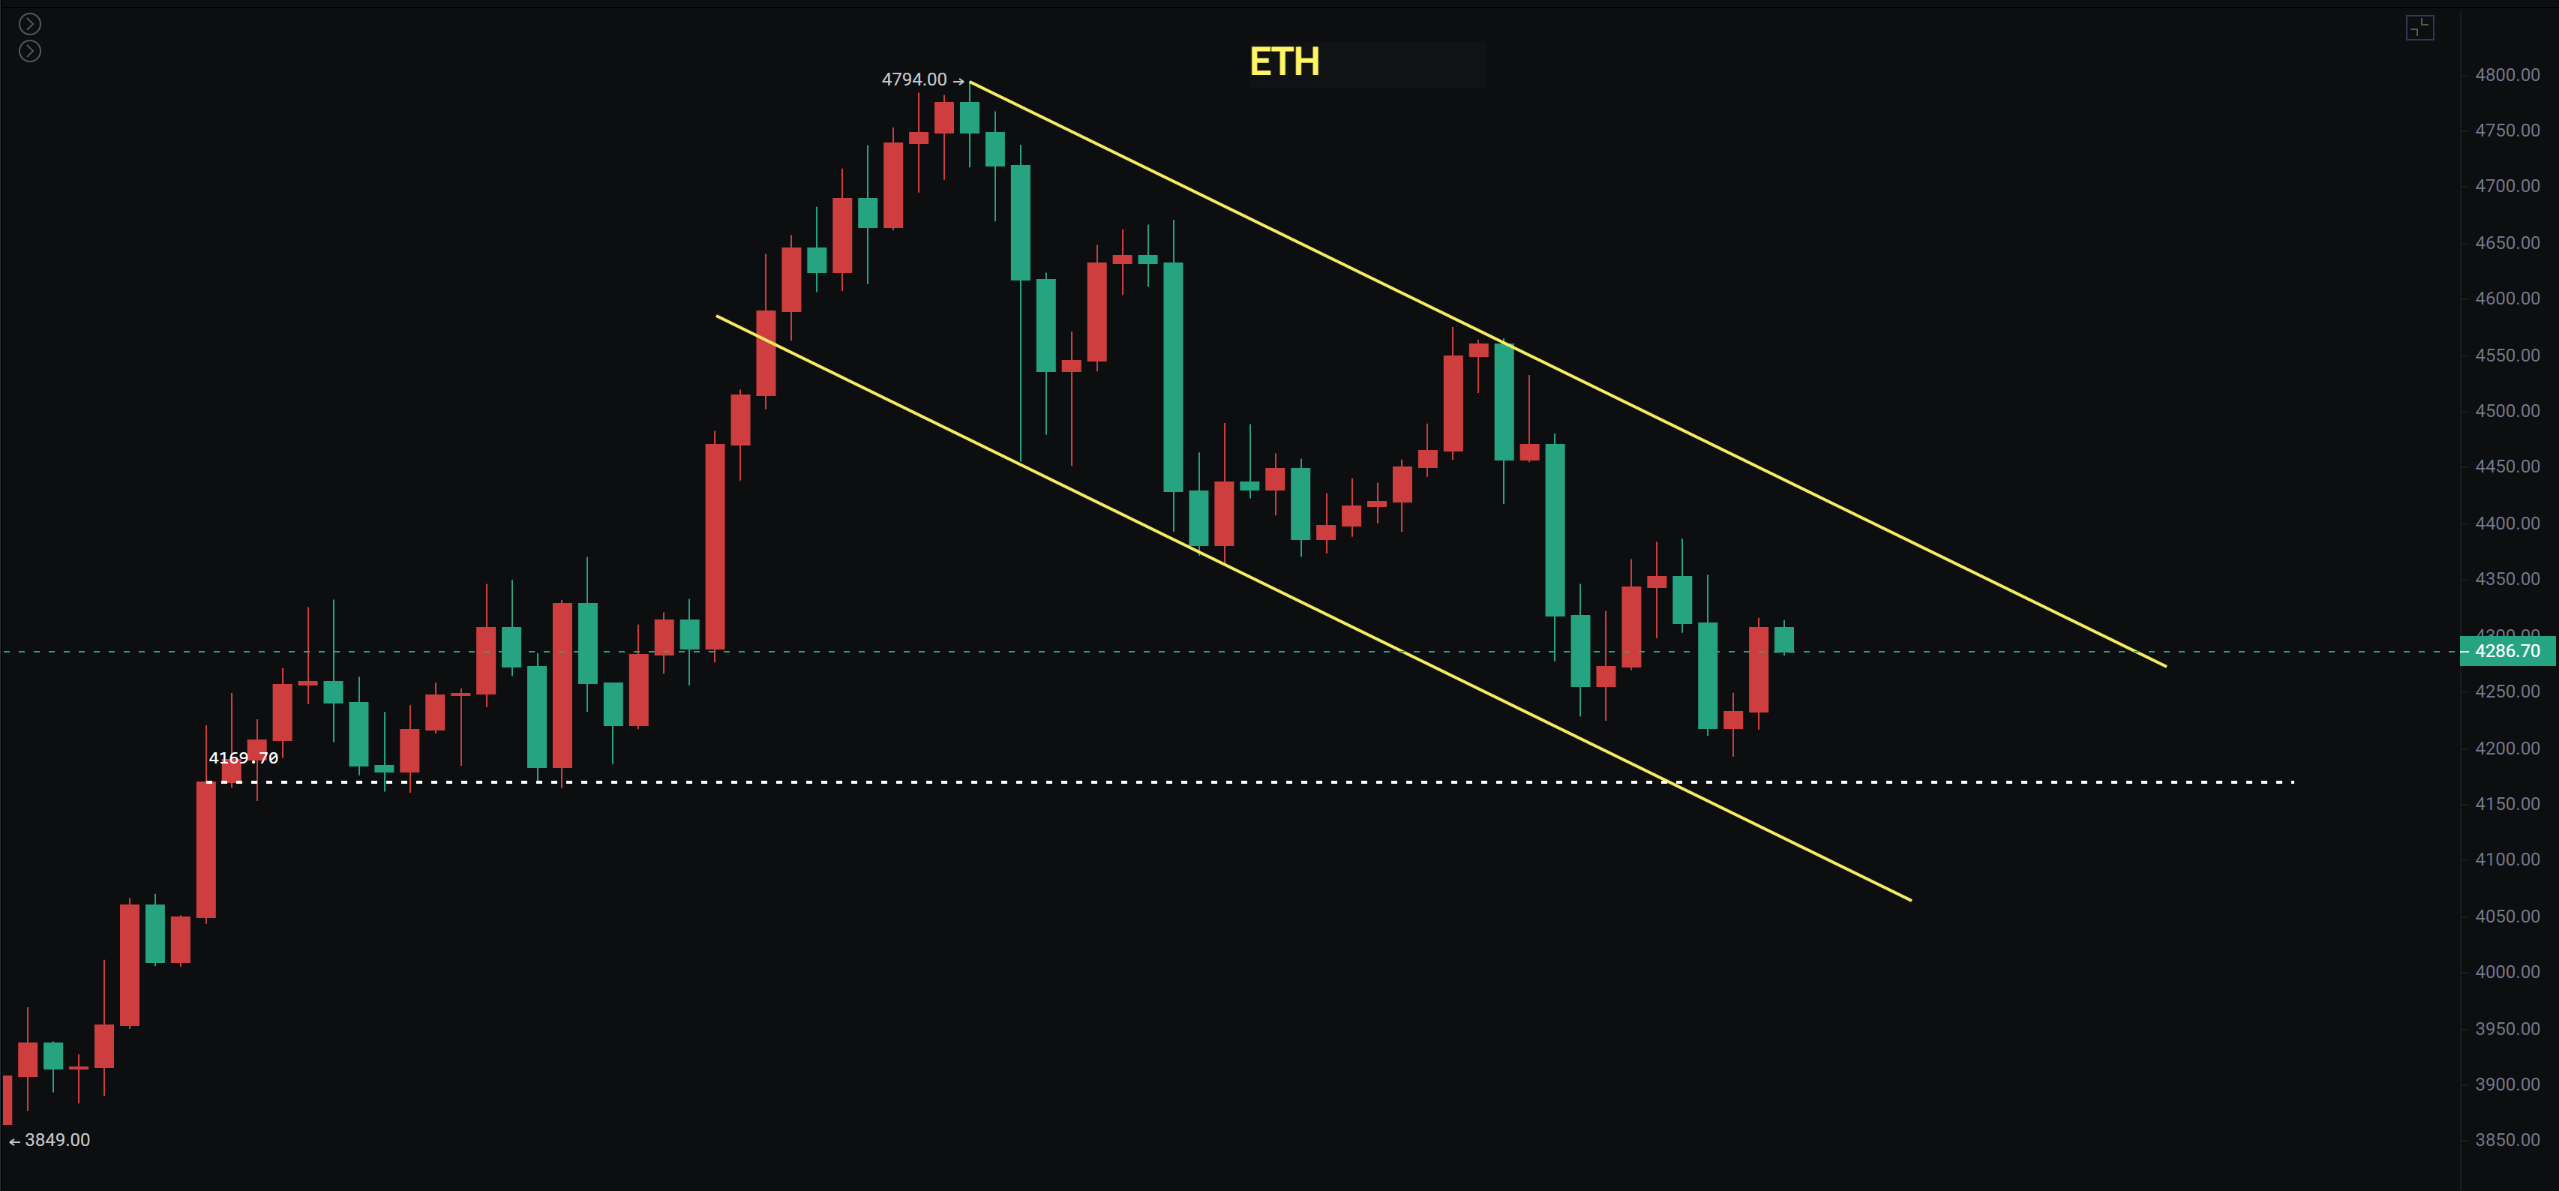
Ethereum dropped from 4,788 to 4,193, which is also the bottom of the previous consolidation platform. We will first look for support around this area. If it continues to break down, we need to consider support around 3,800 to 3,950. The 4-hour chart maintains a descending channel, so we should pay attention to changes in the channel; a breakout would allow for long positions.
The Nasdaq index and S&P 500 have not fully broken below the previous breakout highs during the short-term fluctuations and pullbacks. We will watch whether they will fall back again; if they do, a wide range of fluctuations may occur, potentially rebounding around August 1. This would also affect Bitcoin's movement. The Dow Jones has just shown signs of a slight breakout but has fallen back, indicating a very tangled situation.
Bitcoin
Bitcoin has been in a downtrend for six days, and the daily upward trend has been broken. It is also retesting the previous range bottom around 114,000. If this support continues to break down, it will test the neckline support around 112,000. I have previously reminded that 112,000 is a very critical support for bulls. If it breaks, the adjustment period of the bull market will be prolonged, and mid-to-long-term positions will need to be reduced.
The 4-hour chart has formed a descending wedge, so we will focus on whether it can break out and return to the daily upward trend line to continue. The probability of a rate cut in September has decreased to 83%, but the probability of a rate cut is still relatively high.
Support: 112,000 to 114,000
Resistance: 118,600 to 121,000
Ethereum
Ethereum rose from 1,385 to 4,788, an increase of nearly 2.5 times. The current pullback still belongs to a weak correction. This entire segment has not yet broken below 0.236, which is around 3,980. As long as it stays above 3,800 to 3,900, we still look for a rebound after the pullback.
The 4-hour chart has formed a descending channel, and the current rebound is still weak. However, it has dropped to the first support level, which is around 4,160. We will first look for a rebound around this area. My view on Ethereum is still that pullbacks provide opportunities to accumulate positions in batches, and Ethereum and altcoins are expected to perform well in the second half of the year.
Support: 3,800 to 3,950
Resistance: 4,400 to 4,670 to 4,788
If you like my views, please like, comment, and share. Let's navigate through the bull and bear markets together!!!
The article is time-sensitive and for reference only; it is updated in real-time.
Focusing on K-line technical research, sharing global investment opportunities. Public account: BTC Trading Prince Fusu

免责声明:本文章仅代表作者个人观点,不代表本平台的立场和观点。本文章仅供信息分享,不构成对任何人的任何投资建议。用户与作者之间的任何争议,与本平台无关。如网页中刊载的文章或图片涉及侵权,请提供相关的权利证明和身份证明发送邮件到support@aicoin.com,本平台相关工作人员将会进行核查。