# 1. Core Principles of Super Band Tracking
In quantitative trading, successful strategies are often built on the precise capture of market patterns and the optimization of risk-reward ratios. The core principle of Super Band Tracking is to capture important rebound points in the market through mathematical modeling and data analysis, enabling automated buy operations to reduce operational costs while enhancing capital utilization efficiency. This method is particularly suitable for highly volatile assets, allowing for the identification of high win-rate trading opportunities within market fluctuations.
- Analysis of Core Ideas
The design inspiration for the Super Band Tracking strategy comes from the theoretical assumptions of mean reversion and momentum reversal. The core idea is to capture price rebound signals through quantitative indicators after significant price pullbacks, converting these signals into clear buy/entry points. This approach allows investors to avoid subjective emotional interference and achieve precise operations based on data-driven insights.
From the perspective of strategic goals, Super Band Tracking emphasizes three core advantages:
- Reducing Holding Costs:
Buy at low points during market pullbacks and lock in profits during rebounds. Band pullbacks are often accompanied by heightened market panic. By tracking the extent of pullbacks in conjunction with changes in trading volume, suitable buying opportunities can be accurately identified, thus avoiding greater holding costs caused by indiscriminate chasing in trends.
- Enhancing Capital Efficiency:
Automatically identify trading opportunities and avoid frequent trial and error caused by inefficient fluctuations through set quantitative conditions. Compared to traditional subjective trading methods, automated quantitative strategies reduce hesitation or repetition in entry timing, while avoiding excessive exposure to ineffective volatile markets, thereby improving the overall return on capital utilization.
- Accurately Capturing Trend Lows:
Buy during trend pullbacks to reduce cost losses from blind entries. In trending markets, price movements are rarely linear but are accompanied by multiple band adjustments. The Super Band Tracking strategy accurately identifies entry timing at relatively low points through real-time monitoring of pullback magnitudes, candlestick structures, and trading volumes.
Benefit 1: Alignment with Market Rhythm — Significant pullback points in trends often serve as windows for technical buying re-entry, and signals from quantitative tools can significantly reduce the likelihood of missing key nodes.
Benefit 2: Maximizing Cost Savings — In highly volatile markets, indiscriminate entries often lead to higher unrealized losses, while dynamically capturing pullback depths can help avoid inflated holding costs, resulting in a better profit-loss ratio.
- Detailed Explanation of Core Indicators
This strategy relies on the following key quantitative indicators to assist in signal capture and operational decision-making:
- Highs, Lows, and Averages of the Last 50 Candlesticks:
1) Utilize historical price data to calculate interval extremes and averages, thereby determining the price range of the current band.
2) The relative position of highs and lows can reveal whether the market is in an overbought or oversold state, providing a reference for subsequent judgments.
- Price Increases and Decreases of Candlesticks:
1) By calculating the price amplitude of single or multiple candlesticks, capture the intensity of market fluctuations to identify potential trend reversal signals.
2) A significant increase in amplitude often indicates a heightened divergence between bulls and bears, marking a key moment for strategy intervention.
- Volume Rebound Lows:
1) Combining volume and price is an important means to enhance strategy effectiveness. Abnormal expansion or contraction of trading volume often signals that the market is approaching a critical turning point.
2) Setting the low points of trading volume as a reference can further filter out noise signals, accurately pinpointing rebound buy points in "super-level" bands.
- Causes of Signal Logic
The statistical logic behind this strategy is that when prices reach low points in key support areas, accompanied by significant changes in trading volume, a short-term or medium-term rebound trend typically forms. This market behavior reflects the transition of the "bull-bear contention boundary," where short-term bears become powerless, and capital tends to favor bulls. This momentum often drives prices to reverse quickly, providing investors with high profit-loss ratio entry opportunities.
Through quantitative settings, Super Band Tracking can integrate the above indicators, automatically filtering out operational paths for "low band entry," combined with pre-set take-profit and stop-loss measures, allowing the strategy to exhibit strong adaptability across different volatile market conditions.
- Practical Significance and Unique Advantages
Eliminating Emotional Trading: By quantifying signal indicators, investors can avoid making impulsive buy and sell decisions based on emotions, relying on data for trading actions.
Responding to Complex Markets: In relatively volatile or unclear trend environments, this strategy can capture profit opportunities through rebounds.
Reducing Trading Costs: The inclusion of volume indicators can help filter out low-quality signals during volatile markets when price and volume diverge, preventing ineffective trades.
# 2. Effectiveness of Super Band Tracking Signals
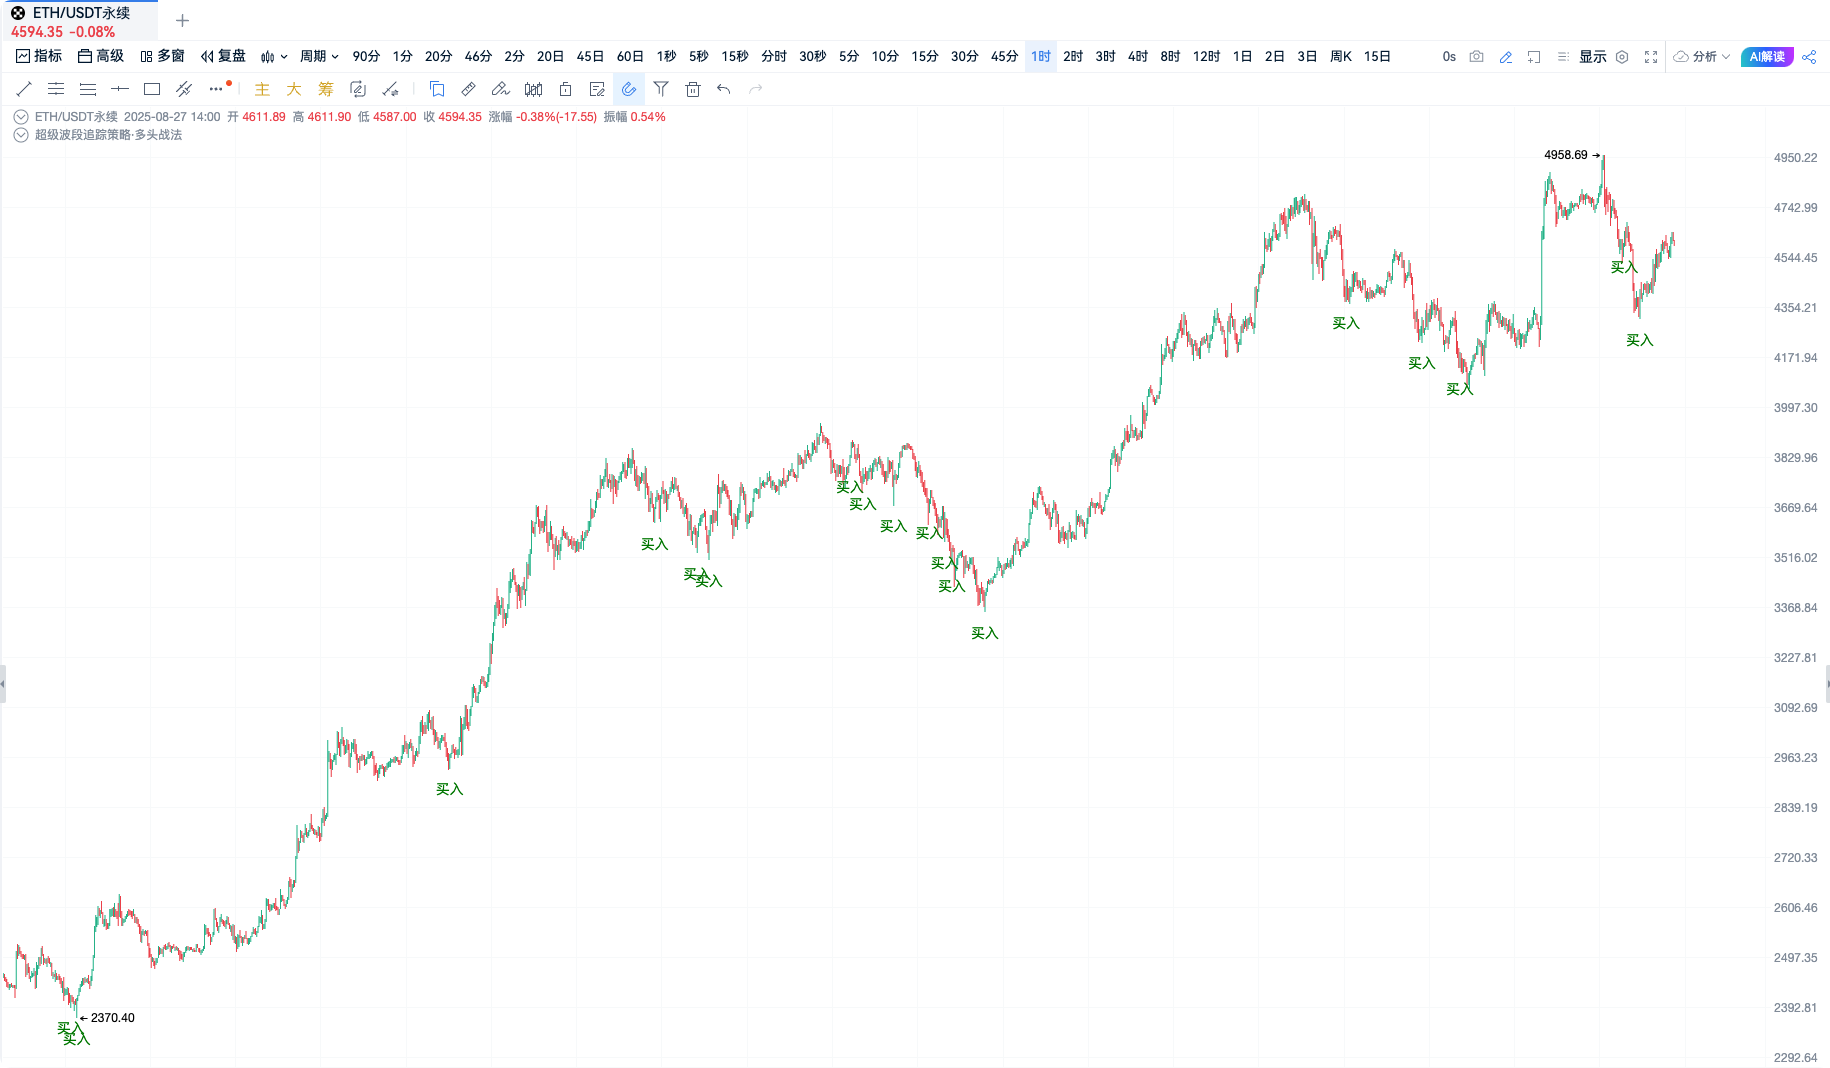
Chart OKX-ETHUSDT Perpetual Contract 1-Hour Cycle
Signal Highlights: In an upward trend, buy operations were executed at each pullback low.
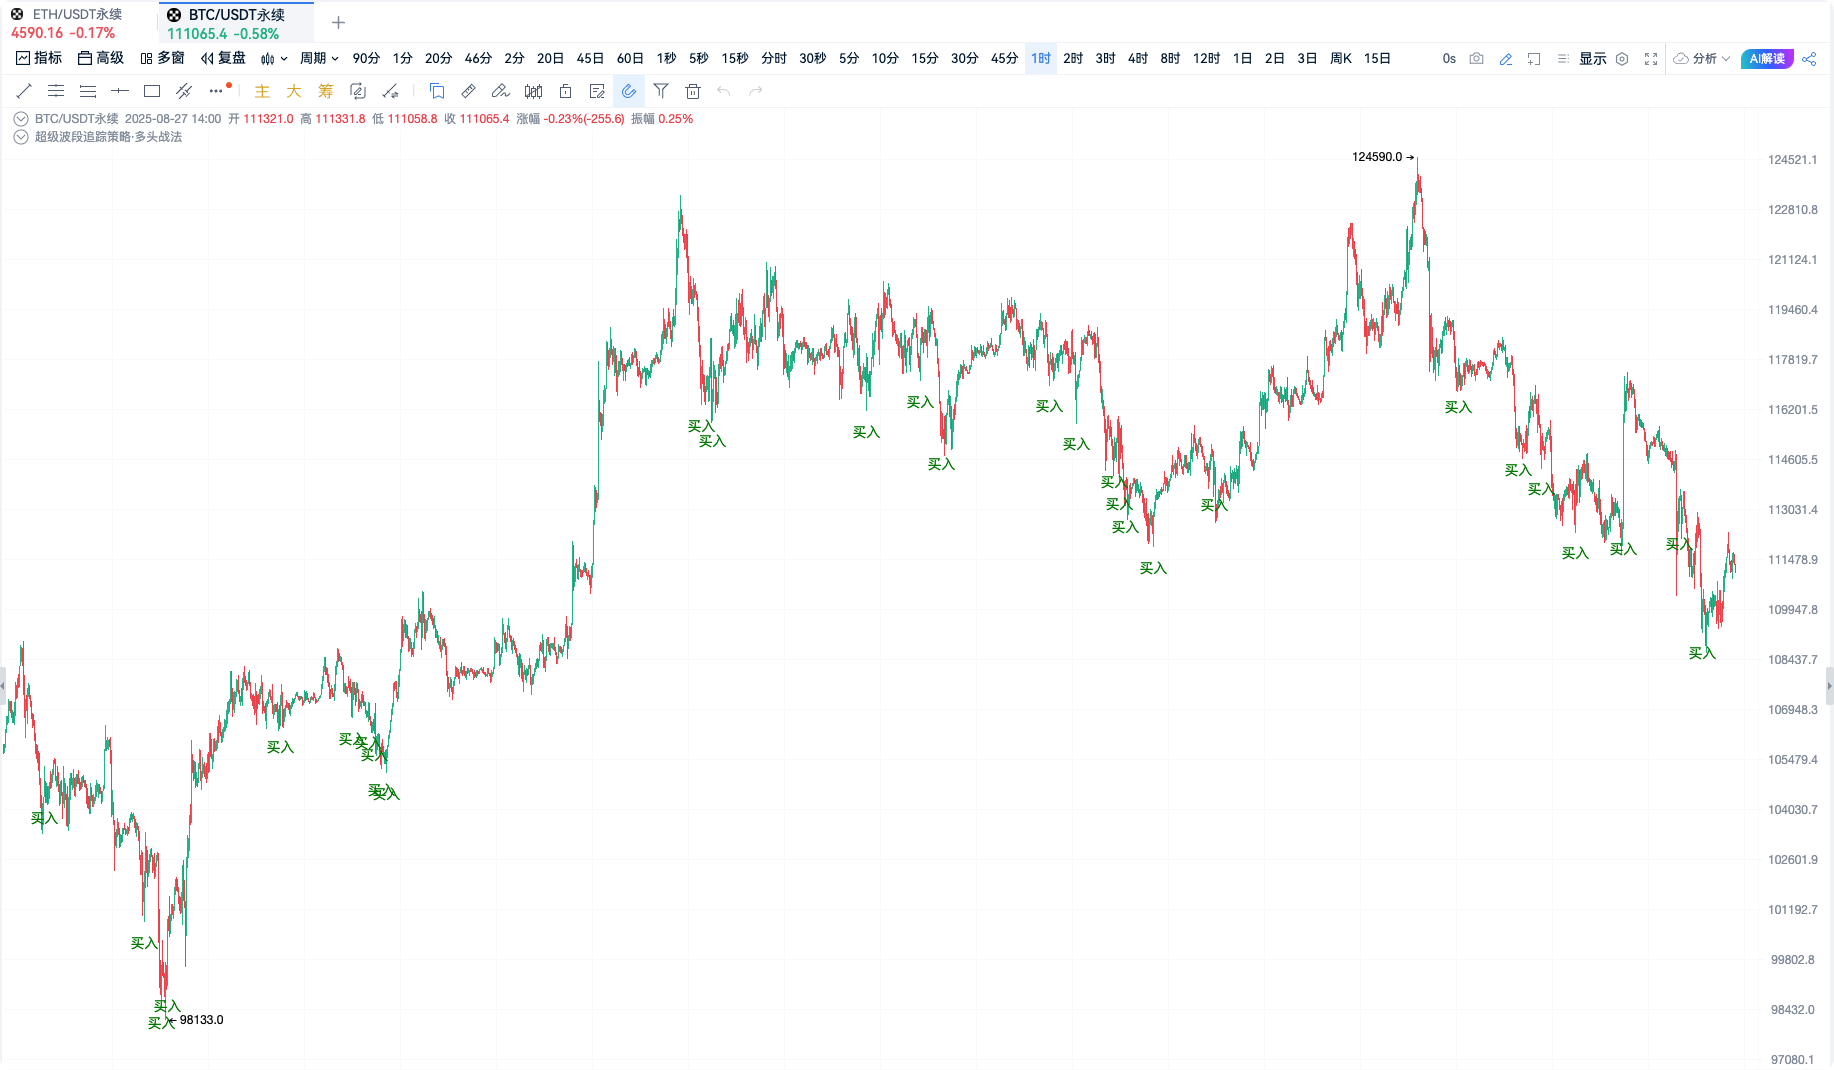
Chart OKX-BTCUSDT Perpetual Contract 1-Hour Cycle
Signal Highlights: In a volatile market, buy operations were executed at each low of the fluctuations.
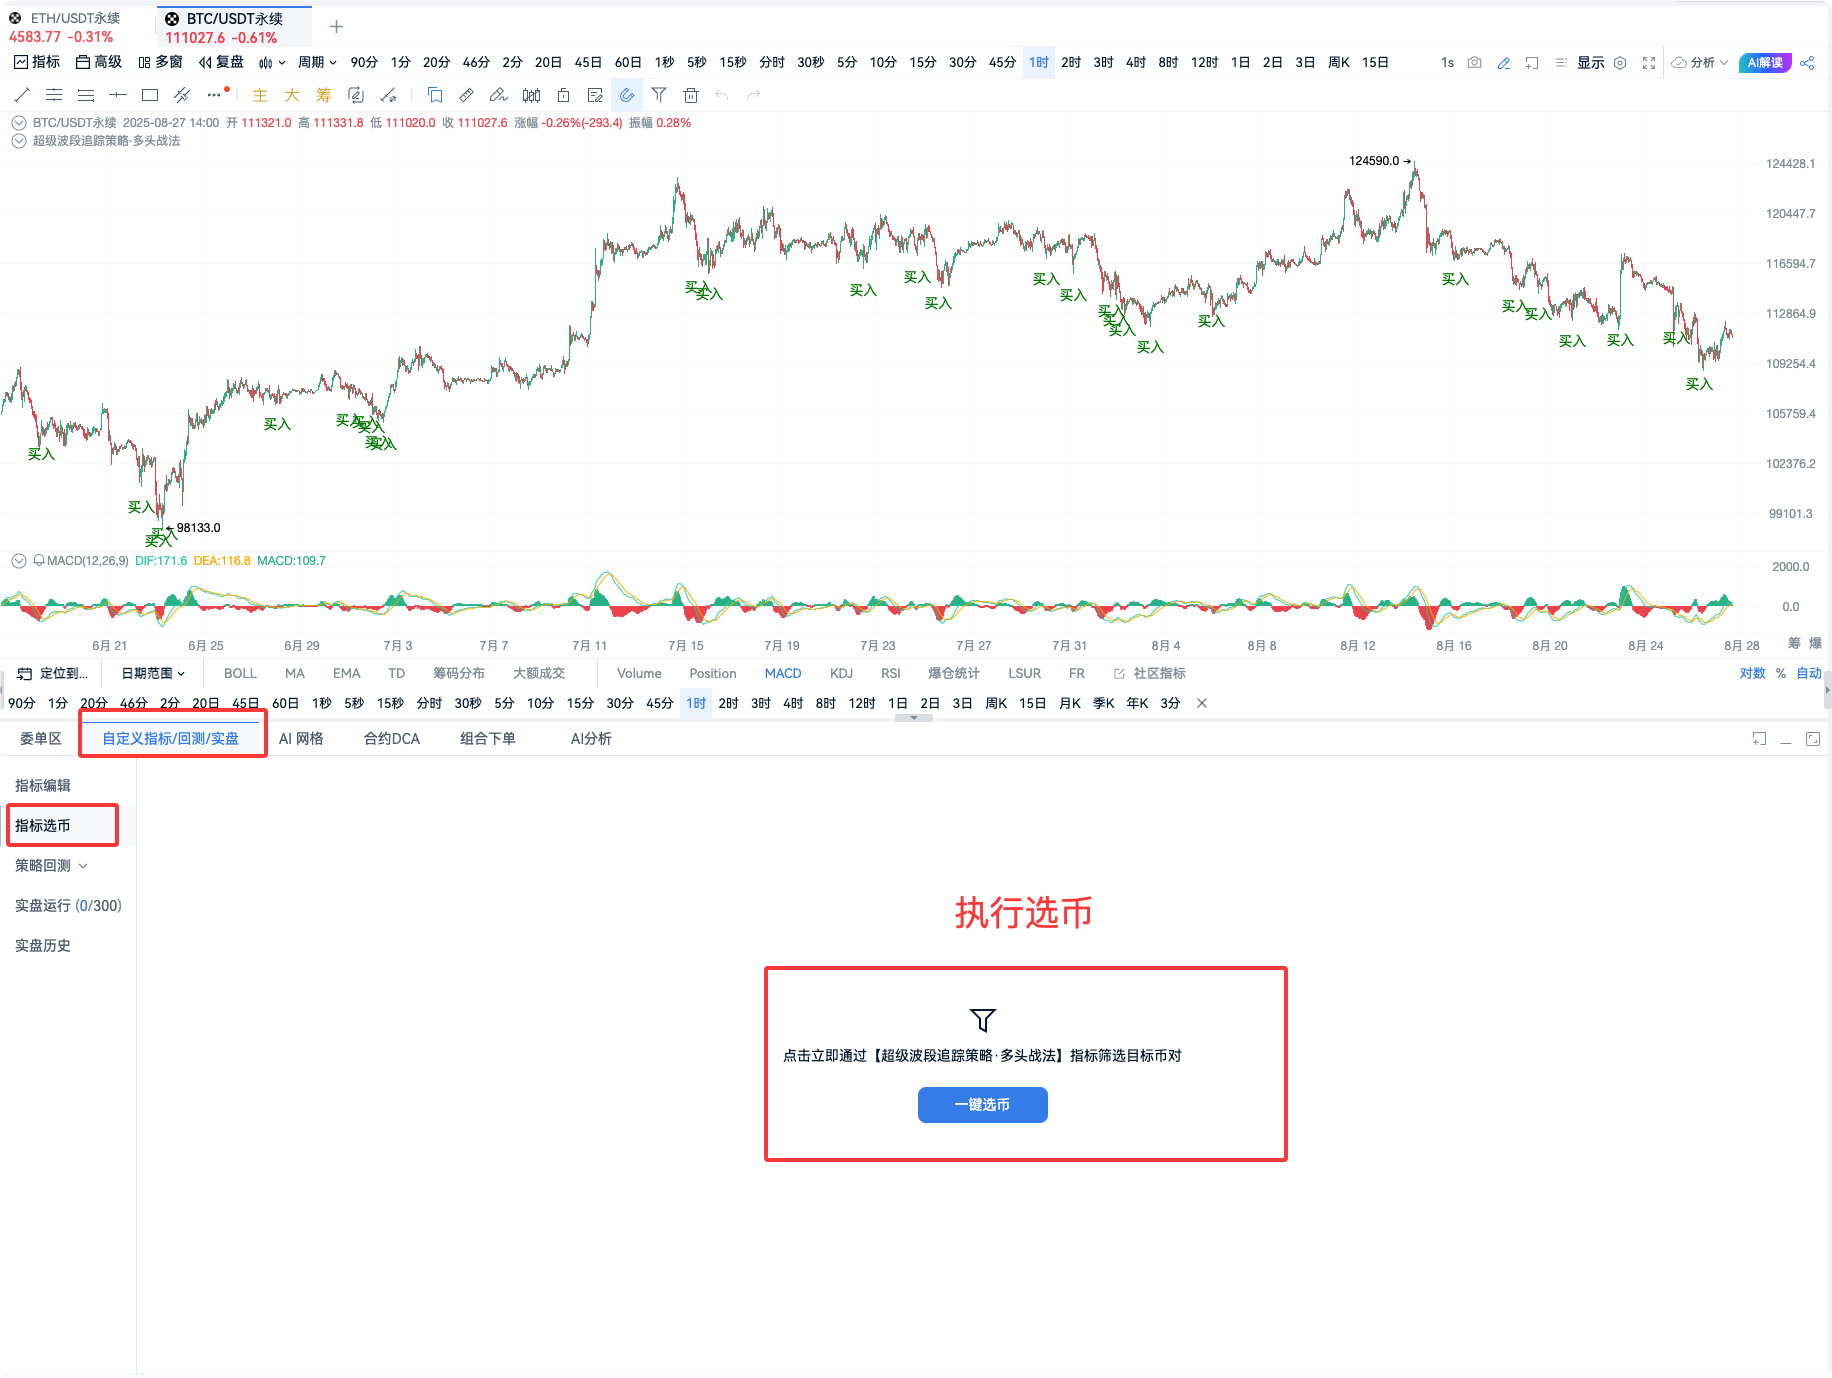
# 3. Super Band Tracking Coin Selection
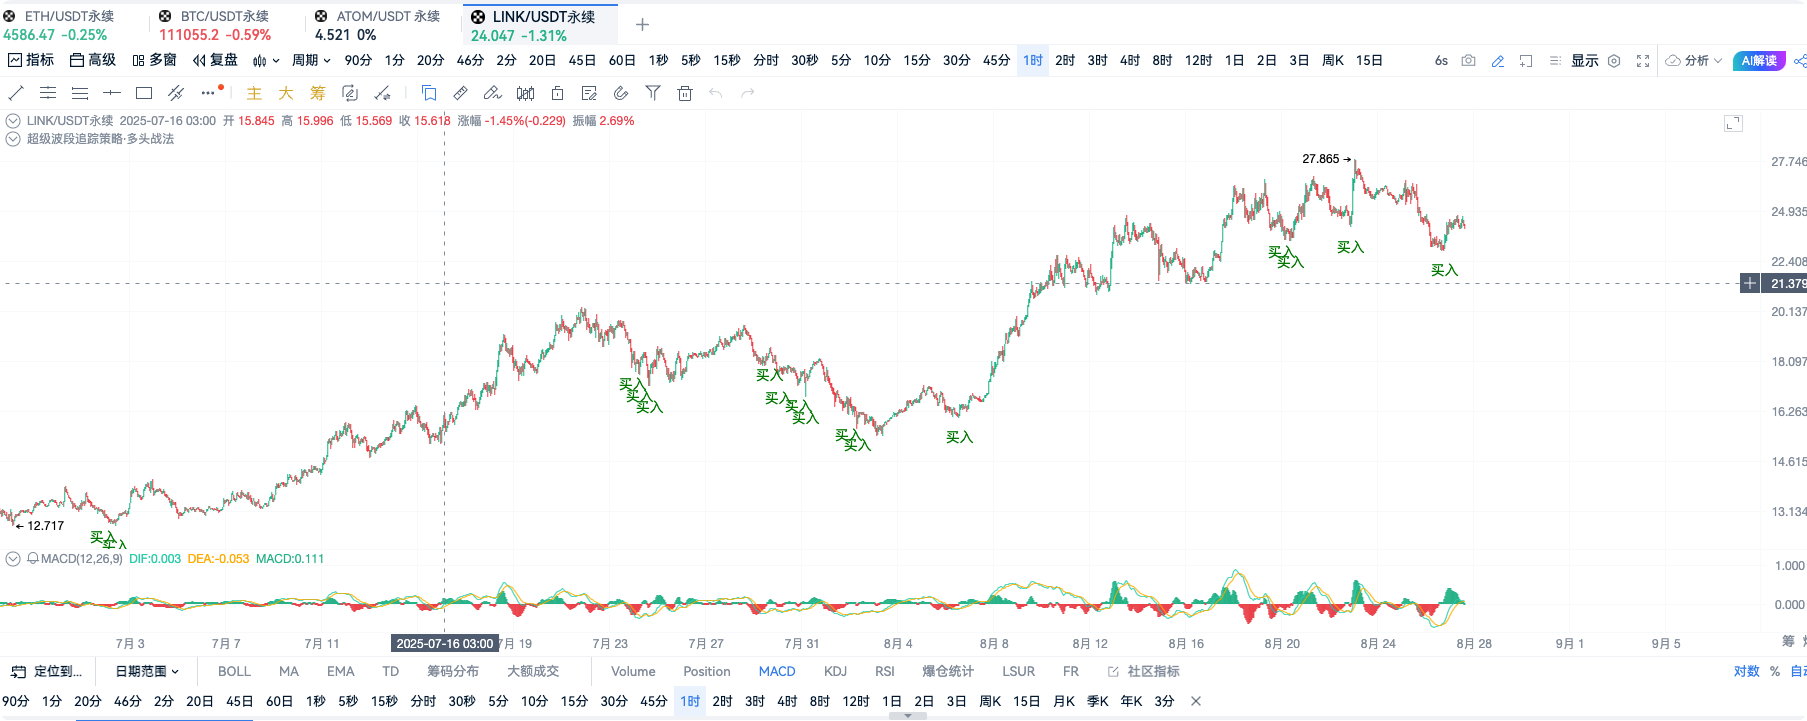
Quality Result 1: OKX-LINKUSDT Perpetual Contract, a rebound occurred after the signal appeared.
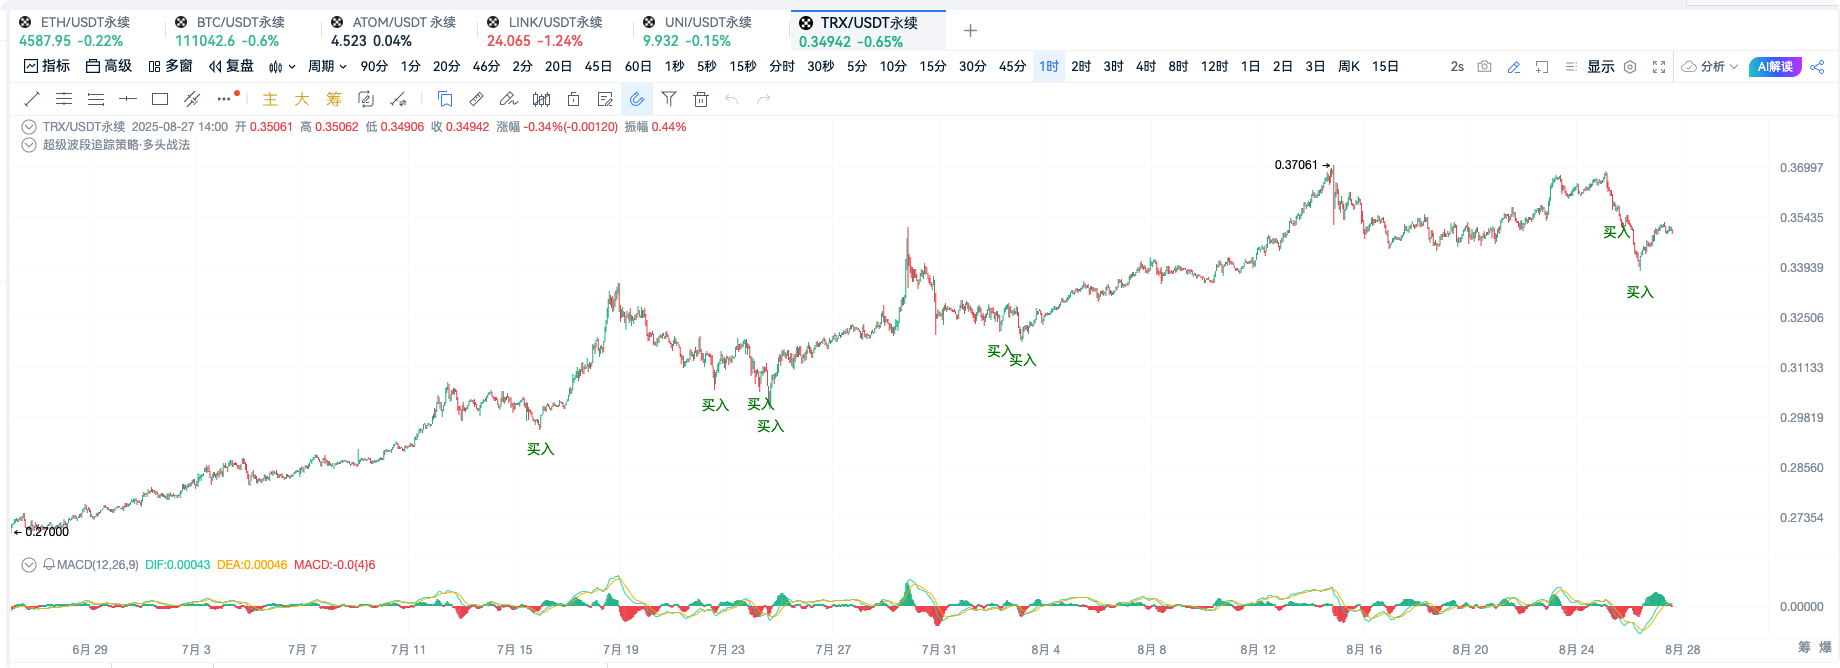
Quality Result 2: OKX-TRXUSDT Perpetual Contract, the best buy signals were issued at each pullback low.
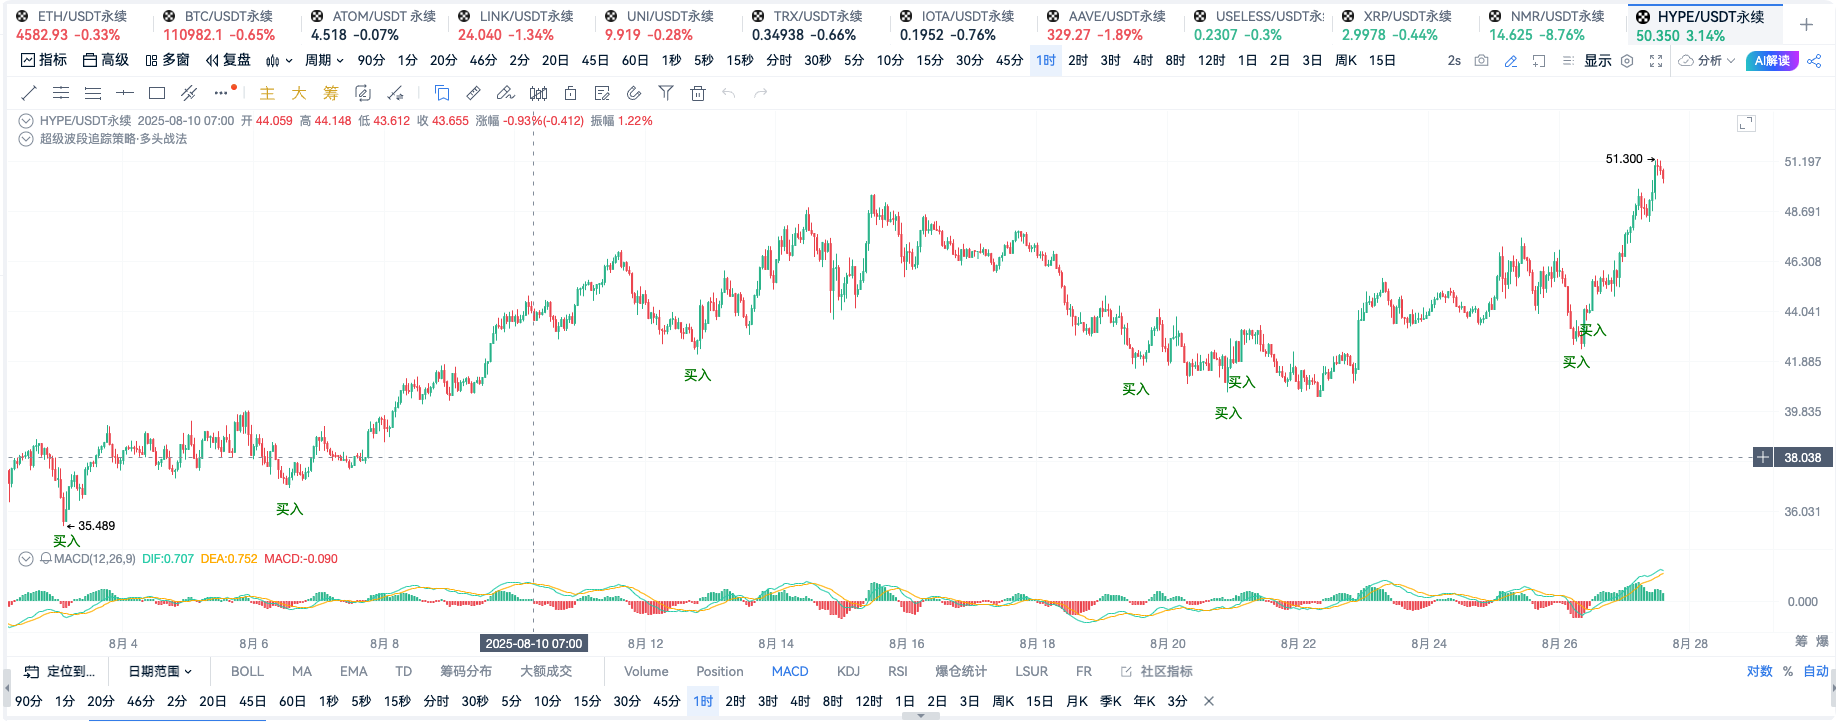
Quality Result 3: OKX-HYPEUSDT Perpetual Contract, buy signals were issued at each low of the fluctuations.
Comprehensive Summary:
From these three sets of charts and descriptions, the following common points can be drawn:
- High Signal Credibility:
All contract trading pairs exhibit a high responsiveness to buy and sell signals, providing clear operational guidance.
- Suitable for Short-Term Trading Strategies:
The overall market shows strong short-term trend characteristics, whether in rebounds, pullbacks, or fluctuations, providing traders with operational space.
- Strong Regularity:
The trading trends of TRXUSDT and HYPEUSDT demonstrate stable signal occurrence patterns, suitable for trend-following traders.
- Capturing Rebound Opportunities:
For LINKUSDT, it leans towards capturing rapid rebound opportunities in the market, suitable for short-term investors seeking breakout points.
# 4. Indicator Source Code
// Strategy Applicable Conditions: Bullish Market
// Strategy Principle: Find points where prices rebound after a volume increase in decline, automatically execute buys to reduce entry costs.
// Recommended Running Cycle: 30m
// Notes: The strategy only executes buys; take-profit and stop-loss settings are required. It is recommended to set take-profit at 2% and stop-loss at 1%, adjusting according to leverage conditions.
//
// @version=2
// Calculate the highest value of the last 50 bars
hhv = highest(high, 50)
// Calculate the lowest value of the last 50 bars
llv = lowest(low, 50)
// Calculate the length of the candlestick
len= abs(high - low)
// Calculate the average height of the candlestick
maLen = ma(len, 50)
// Define recent new highs and new lows
newHigh = high == hhv
newLow = low == llv
// Calculate price change percentage
degree = ((close - open) / open) * 100
// Calculate price change
change = close - open
// Define conditions
lenLimit = len > maLen
newHighEnd = ((newHigh[1] && !newHigh) || newHigh) && change < 0 && lenLimit
newLowEnd = ((newLow[1] && !newLow) || newLow) && change > 0 && lenLimit
degreeThrehold = 0.2
maVol = ma(volume, 120)
volumeCondition = volume > maVol
volUp = volumeCondition && degree >= degreeThrehold
volDown = volumeCondition && degree <= -degreeThrehold
signal = 0
if (volUp && (newLowEnd || newLowEnd[1] || newLowEnd[2] || newLowEnd[3] || newLowEnd[4]) && (signal[1] != 1 && signal[2] != 1 && signal[3] != 1 && signal[4] != 1)) {
signal := 1
} else if (volDown && (newHighEnd || newHighEnd[1] || newHighEnd[2] || newHighEnd[3] || newHighEnd[4]) && (signal[1] != -1 && signal[2] != -1 && signal[3] != -1 && signal[4] != -1)) {
signal := -1
} else {
signal := 0
}
buy = signal == 1
sell = signal == -1
// Create corresponding alert conditions for use in the alert addition window
alertcondition(buy, title='Buy Signal', direction="buy")
// Plot signals on the chart
plotText(buy, title='Buy', text='Buy', color='green', refSeries=low, placement='bottom')
// Spot buy or open long position in contracts
enterLong(buy, price='market', amount=1)
# 5. Summary
The core idea of Super Band Tracking lies in utilizing pullback magnitudes and rebound strengths to assess market potential, capturing important entry opportunities through band operations, while avoiding short-term abnormal fluctuations and enhancing operational robustness. Compared to traditional technical methods, it has three major advantages:
Reducing Price Risk: By verifying pullback positions and short-term signals, it filters high win-rate entry points, reducing the risk of market reversals.
Enhancing Profit-Loss Efficiency: The automated introduction of signal discrimination mechanisms helps investors accurately locate profit zones, matching the best trading times in the market.
Precisely Locking Target Prices: For rebound markets and price bands, it optimizes entry rhythms and improves capital utilization.
This strategy combines various technical indicators, including candlestick trend signals, risk management tools, and dynamic position adjustment methods, constructing a comprehensive operational system adaptable to different market environments. It is a trading strategy that balances flexibility and robustness, suitable for investors looking to achieve precise entries in band markets and effectively enhance trading efficiency.
Join our community to discuss and grow stronger together!
Official Telegram community: t.me/aicoincn
AiCoin Chinese Twitter: https://x.com/AiCoinzh
Group Chat - Wealth Group: https://www.aicoin.com/link/chat?cid=10013
免责声明:本文章仅代表作者个人观点,不代表本平台的立场和观点。本文章仅供信息分享,不构成对任何人的任何投资建议。用户与作者之间的任何争议,与本平台无关。如网页中刊载的文章或图片涉及侵权,请提供相关的权利证明和身份证明发送邮件到support@aicoin.com,本平台相关工作人员将会进行核查。


