The short-term momentum appears cautiously optimistic, as bitcoin has begun recovering from a recent drawdown. Price action across bitcoin‘s daily chart reveals a fall from the $124,517 region down to a local bottom near $107,270, followed by a modest bullish reversal. The presence of a falling wedge pattern and bullish engulfing candles near the base suggests that this rebound may have structural support. Key resistance is observed in the $113,500 to $114,000 range, while immediate support rests near $107,000. Any pullback into the $110,000–$111,000 zone may offer a tactical entry point, particularly if accompanied by declining volume, signaling a potential setup for a reattempt at higher resistance levels.
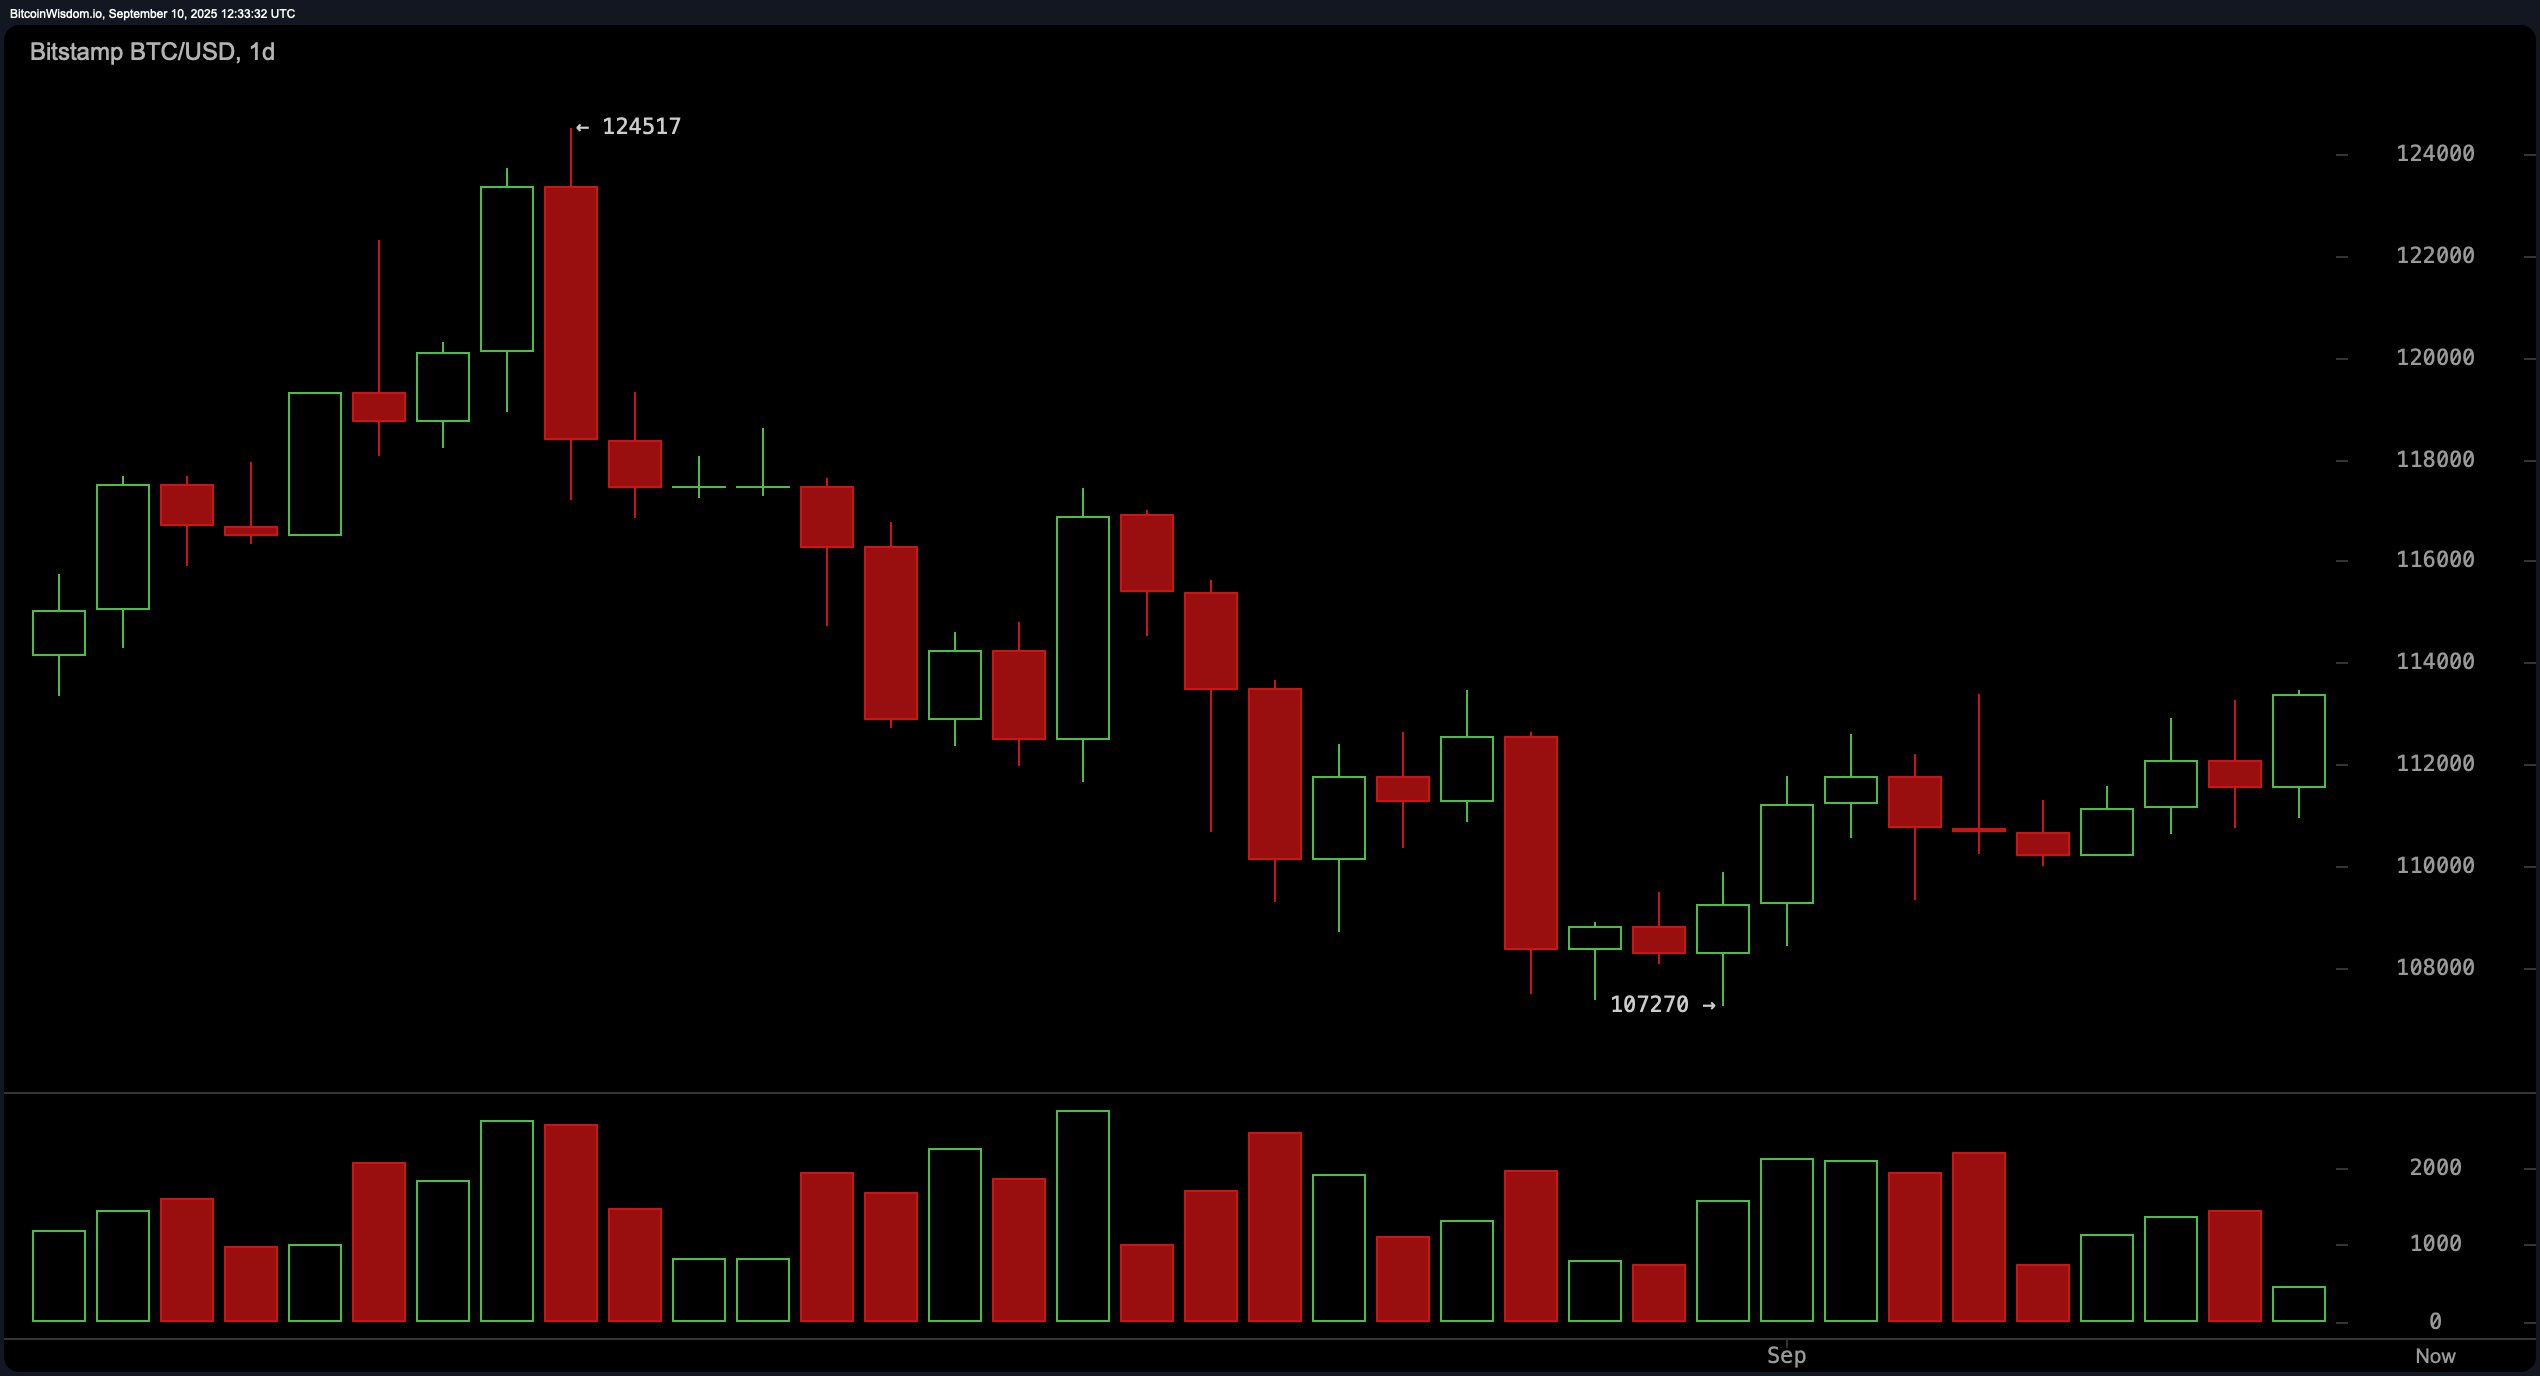
BTC/USD via Bitstamp 1-day chart on Sept. 10, 2025.
On the 4-hour chart, bitcoin shows signs of stabilization and accumulation. A double bottom near $109,500 and $110,000 marks a technical base, followed by a clean breakout through a descending price structure. Volume analysis indicates that bullish attempts were underpinned by healthy demand, strengthening the validity of the breakout. The price currently sits in a favorable entry zone around $111,800 to $112,200. However, the $113,500 to $114,000 levels remain a critical ceiling unless volume surges to confirm upward continuation.
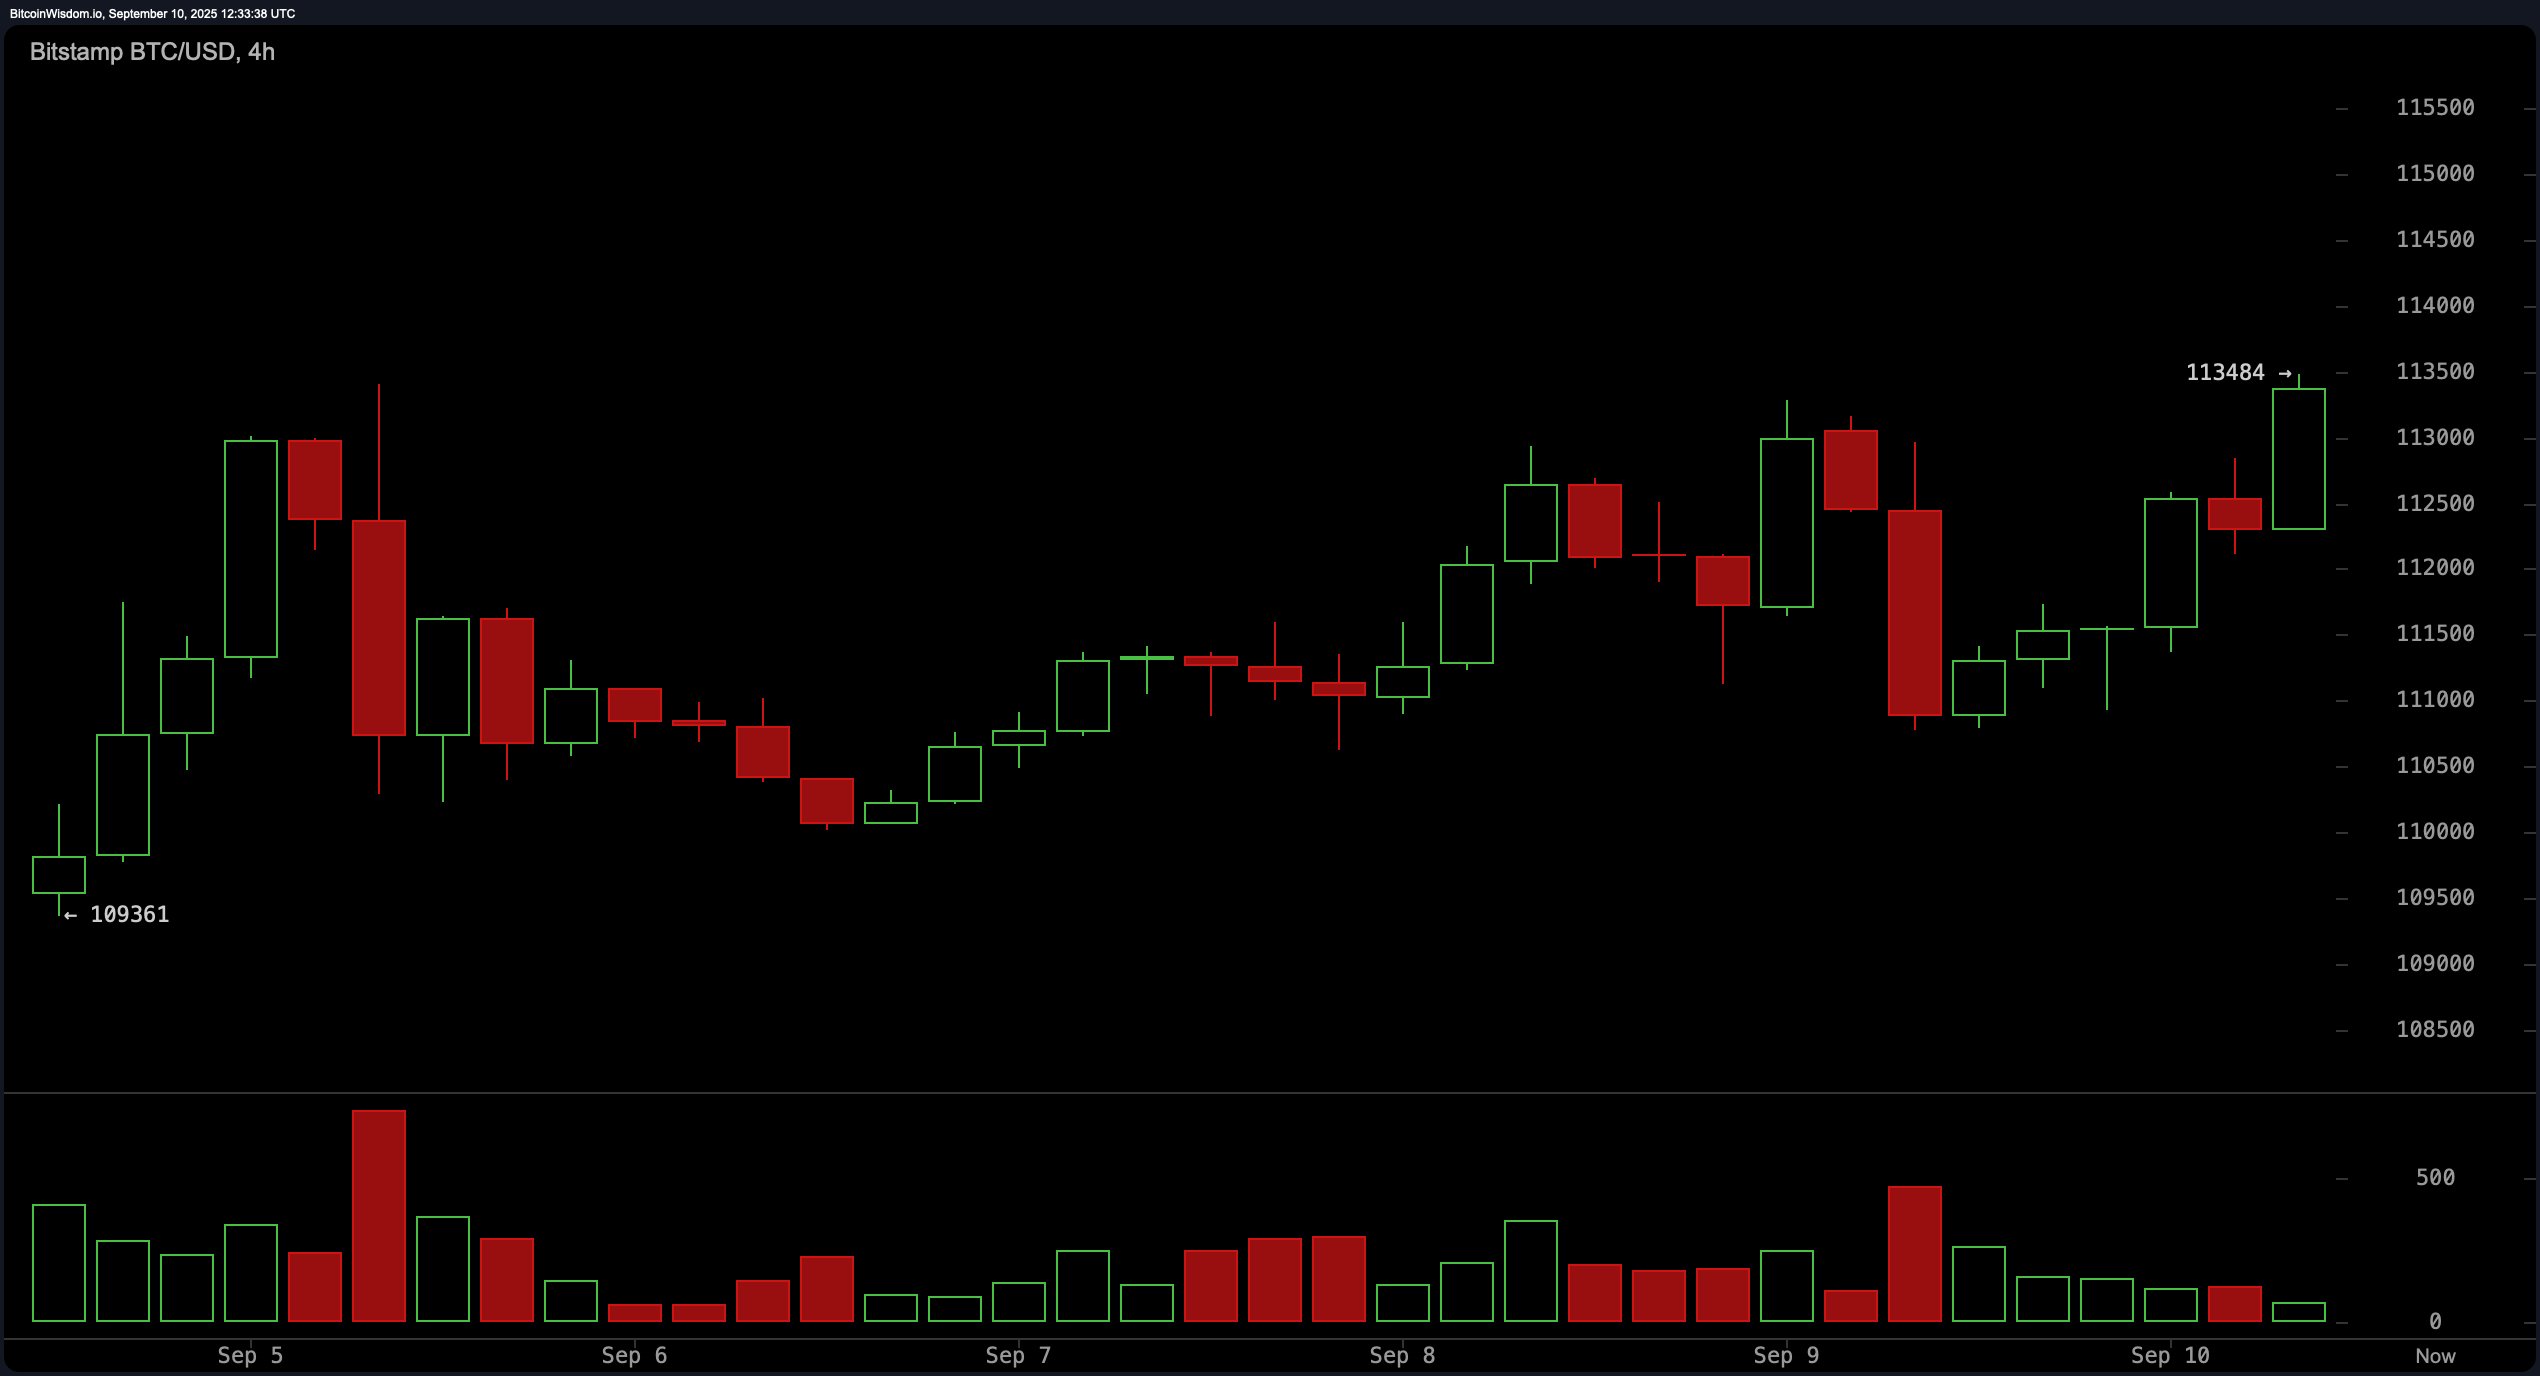
BTC/USD via Bitstamp 4-hour chart on Sept. 10, 2025.
The 1-hour bitcoin chart points to a consolidation phase following a minor rally. Bitcoin recently climbed from a dip near $110,768 and decisively broke above the $112,000 mark, forming a higher low structure—a common precursor to continuation patterns. Price action has since moved sideways around $112,500, with thinning volume suggesting traders are awaiting a catalyst. Breakout traders may consider entries above $112,600 if accompanied by a spike in volume, while conservative positioning could favor accumulation near $111,800 with tight risk controls. Profit-taking should be considered near $113,700 and up to $114,000, where sellers previously emerged.
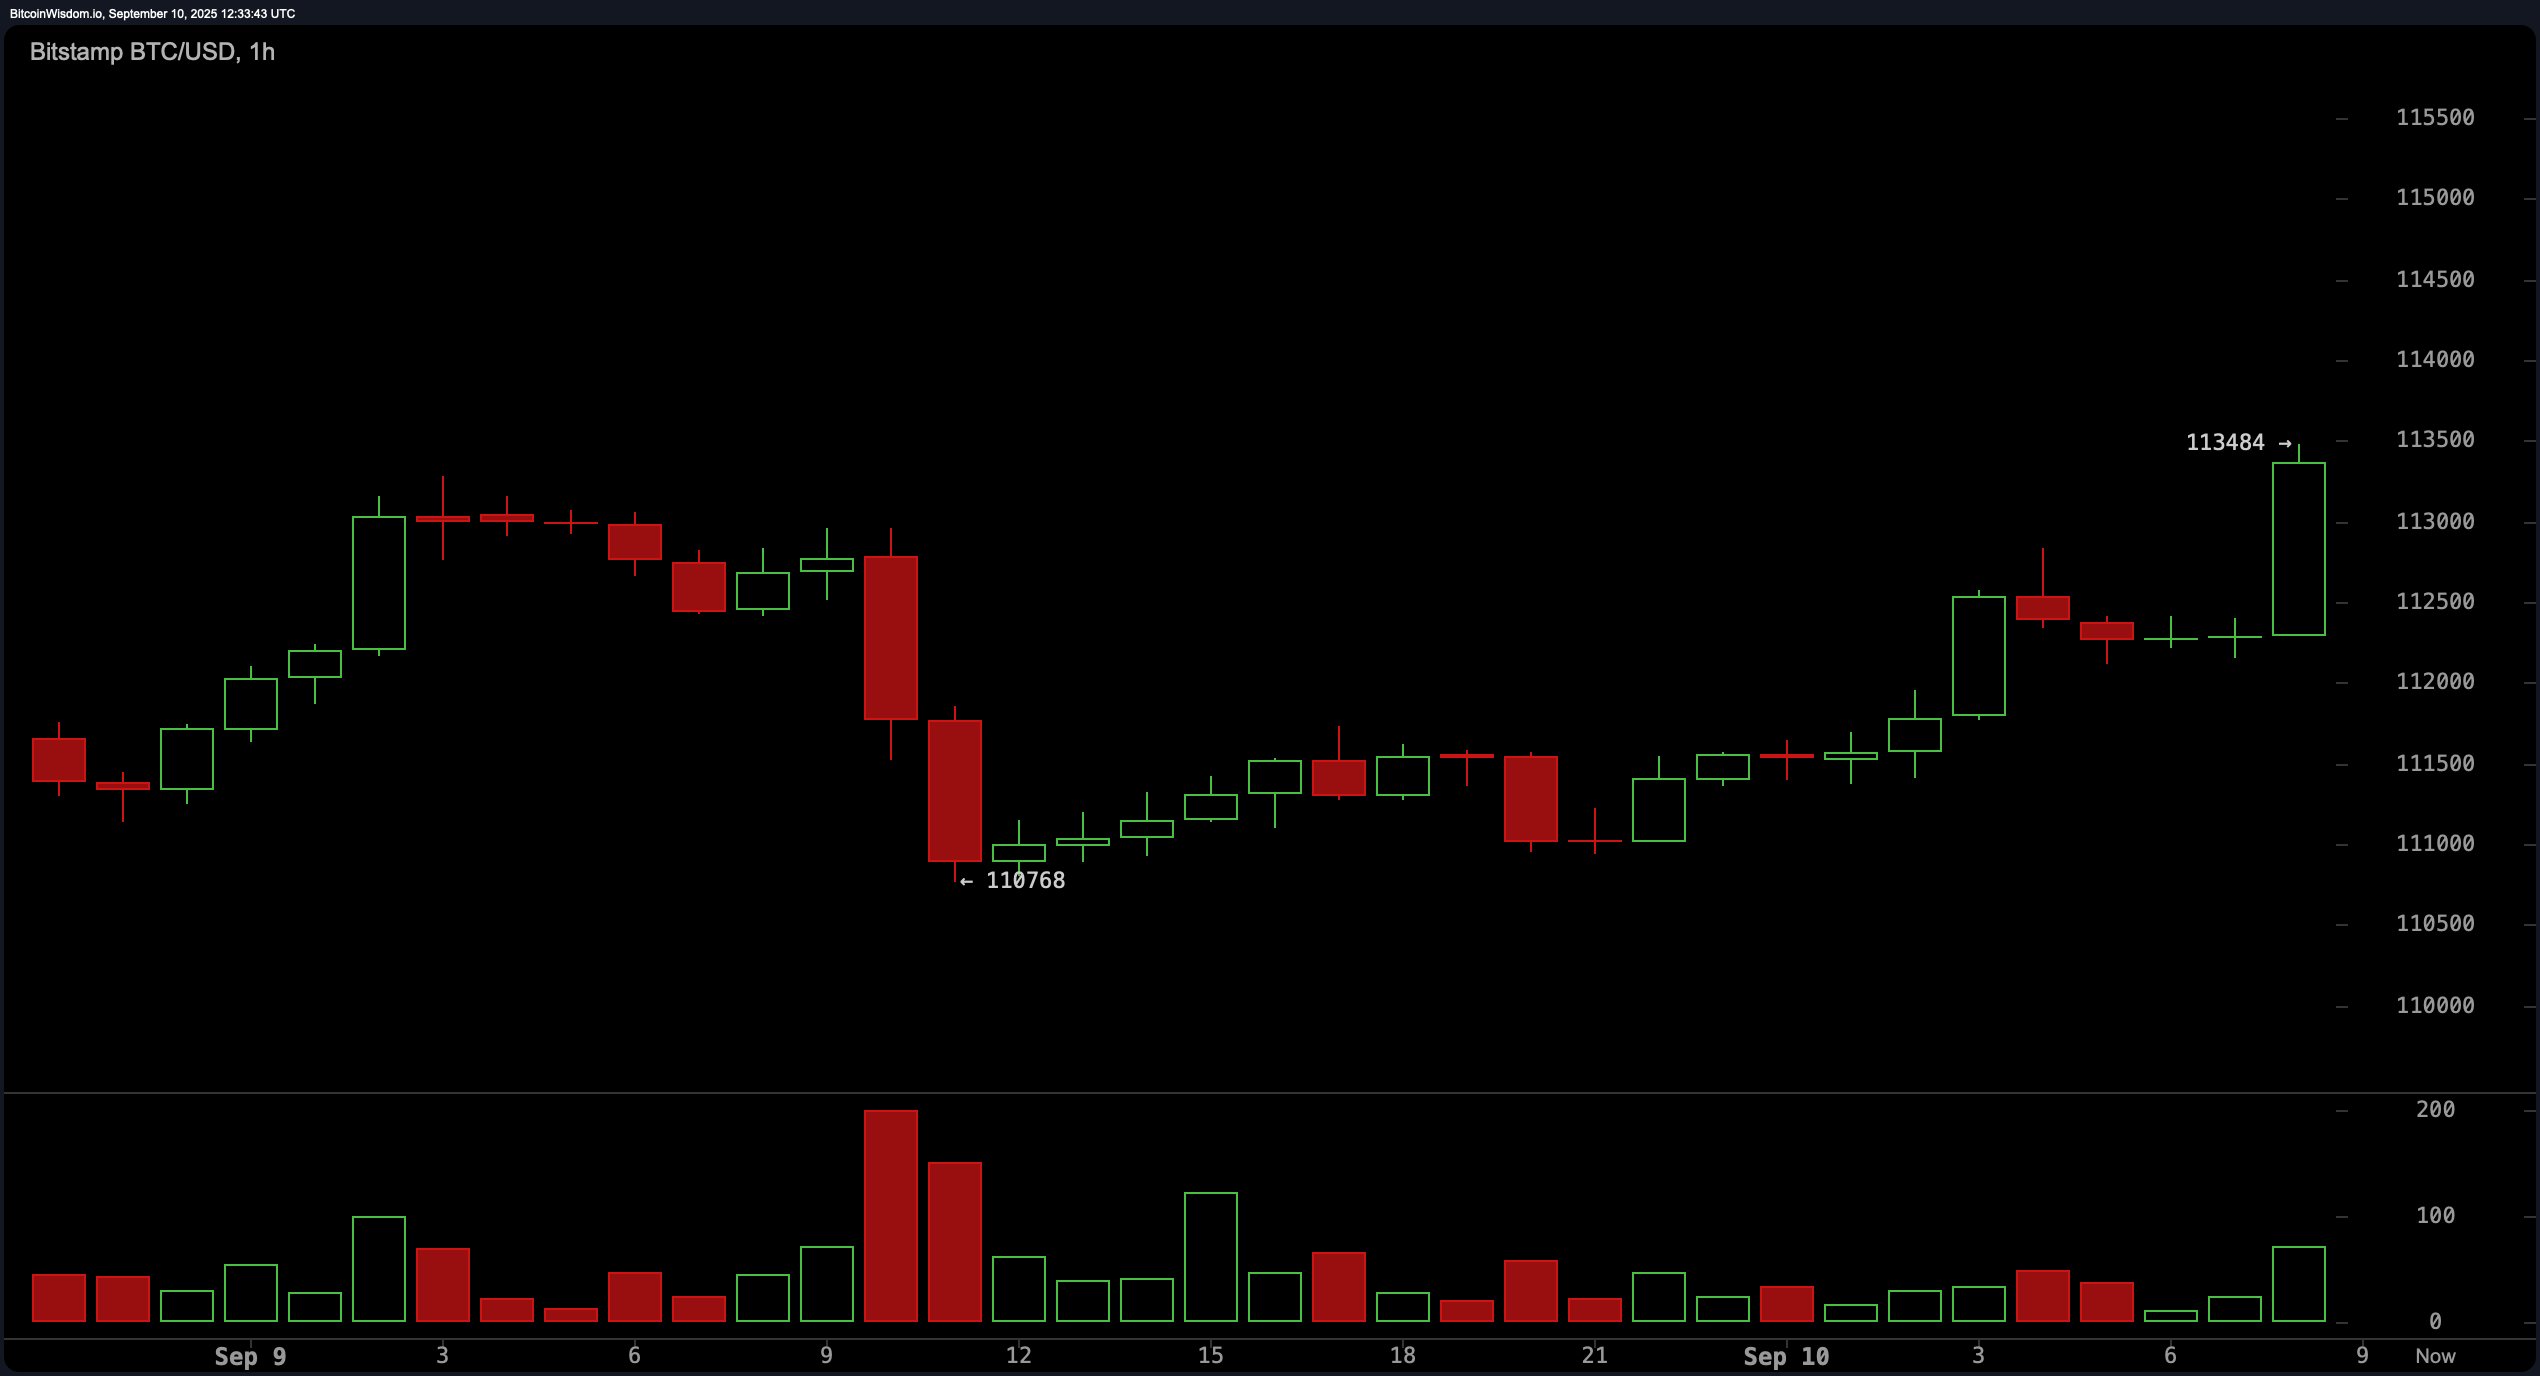
BTC/USD via Bitstamp 1-hour chart on Sept. 10, 2025.
From an indicator standpoint, oscillators remain largely neutral. The relative strength index (RSI) stands at 50, while the Stochastic oscillator reads 76, and the commodity channel index (CCI) registers at 35—all indicating indecision. The average directional index (ADX) is at 14, confirming the absence of a strong trend. However, the momentum oscillator shows a reading of 4,128 and the moving average convergence divergence (MACD) is at −879, both flashing bullish signals and implying latent upside potential.
A breakdown of moving averages reflects a market in the midst of transition. Short-term averages—such as the 10-day exponential moving average (EMA) at 111,384 and the 20-day EMA at 111,890—support bullish action, offering positive signals. However, intermediate-term averages like the 30-day and 50-day moving averages flash bearish signals, suggesting resistance remains overhead. Longer-term indicators, including the 100-day and 200-day simple and exponential moving averages, all signal a broader bullish structure, underlining the ongoing recovery.
As bitcoin consolidates beneath resistance, volume will be the critical variable determining whether the market breaks higher or faces rejection. Traders are advised to watch the $113,500 to $114,000 region closely—if bitcoin fails to pierce this level with conviction, a reversal may follow. Conversely, a confirmed breakout above could pave the way for a retest of prior highs above $114,500 to $115,000, reigniting bullish momentum.
Bull Verdict:
Bitcoin remains in a bullish recovery phase following a recent bottom, supported by favorable short-term and long-term moving averages, constructive chart patterns, and positive momentum indicators. If volume confirms a breakout above the $113,000–$113,500 resistance range, the path to retesting the $114,000 level and potentially higher remains open.
Bear Verdict:
Despite bitcoin’s recovery, key resistance near $113,500–$114,000 has yet to be breached with convincing volume. Oscillators remain neutral, and mid-range moving averages continue to flash sell signals. A failure to break higher may result in a rejection, exposing bitcoin to a retracement toward the $110,000–$107,000 support zone.
免责声明:本文章仅代表作者个人观点,不代表本平台的立场和观点。本文章仅供信息分享,不构成对任何人的任何投资建议。用户与作者之间的任何争议,与本平台无关。如网页中刊载的文章或图片涉及侵权,请提供相关的权利证明和身份证明发送邮件到support@aicoin.com,本平台相关工作人员将会进行核查。


