This week's pattern is basically a one-sided continuation with a strong upward surge. Starting from Monday until today, it has entered a phase of strong horizontal consolidation at high levels, alternating between bullish and bearish movements to delay the one-sided rise, resulting in some stagnation. However, this high-level consolidation is also a form of strong one-sided correction, and ultimately, it will continue to rise unilaterally to create new historical highs; it just needs some time to wait. In the coming days, continue to pay attention to the support and stabilization of the 5-day and 10-day moving averages, and remain bullish, or there may also be stabilization between the 5-day and 10-day moving averages. It is expected that before the announcement of interest rate cuts next Thursday, there may be another wave of upward movement to brush against historical highs. After the announcement of the interest rate cut, a wave of profit-taking and pullback is expected, but generally, it will stop falling that night, and the next day will return to a strong one-sided trend, as the market will speculate on the next interest rate cut. Maintaining this mindset for execution should not be a problem.
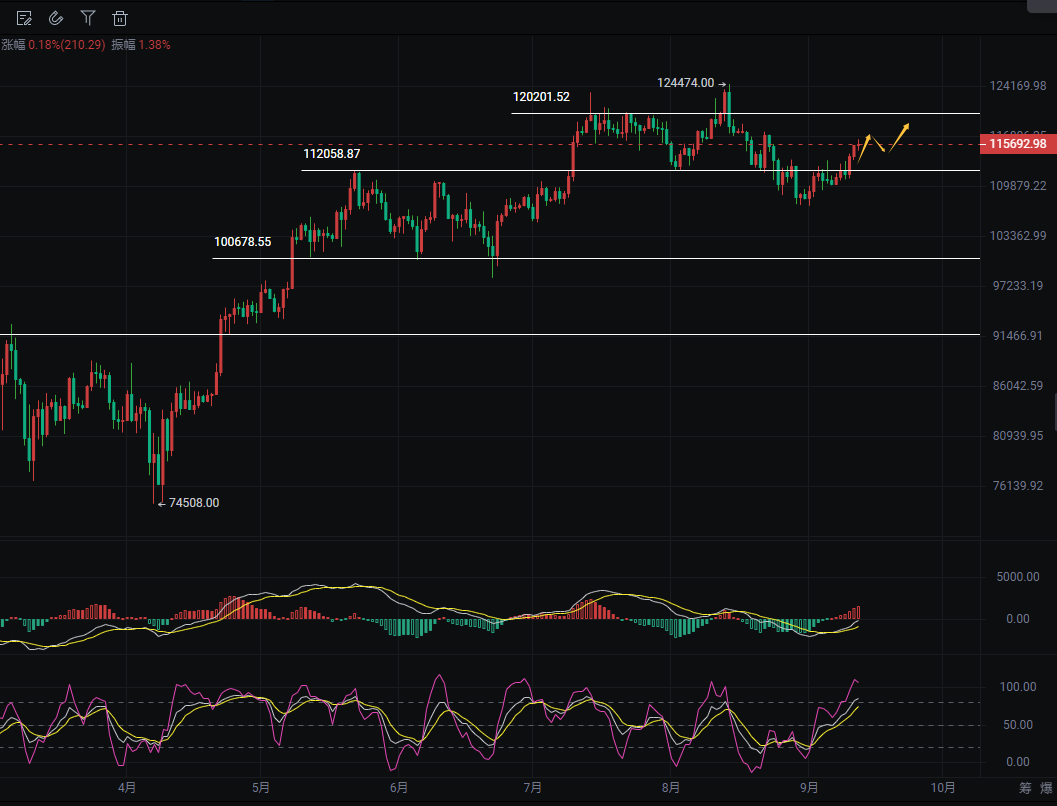
Currently, from a technical perspective, the daily chart shows that prices have been rising continuously, forming multiple bullish candles, and overall presenting a strong oscillating trend. On the hourly chart, support appeared around 114500, leading to a rebound. The technical indicator MACD on the hourly chart shows that DIF and DEA are close to convergence, with the histogram turning from green to red, indicating weakening momentum; the daily chart remains above the zero axis, maintaining a bullish trend. The hourly RSI is at 67.35, close to the overbought zone but not fully entered, indicating potential short-term pullback risks; the daily RSI remains above 60, indicating a bullish market sentiment. The hourly EMA7 has broken above EMA30 and is well above EMA120, showing a bullish arrangement in the short-term moving averages; the daily EMA also shows a bullish pattern with strong support, so in terms of operations, continue to look for short-term pullbacks to go long.
Zhou Yanling's 9.13 Bitcoin Trading Strategy:
Long at 114500-115300, stop loss below 113500, target 117000-118000, continue to look for 119000 nearby.
Short at 118500-117700, stop loss above 119500, target 116500-115500.
Zhou Yanling's 9.13 Ethereum Trading Strategy:
Long at 4530-4570, stop loss below 4480, target 4640-4680, continue to look for 4780 nearby.
Short at 4790-4750, stop loss above 4840, target 4680-4640.
【The above analysis and strategies are for reference only. Please bear the risks yourself. The article's review and publication may have delays, and the strategies may not be timely. Specific operations should follow Yanling's real-time strategies.】

The content of this article is exclusively shared by senior analyst Zhou Yanling (WeChat public account: Zhou Yanling). The author has been engaged in financial market investment research for over ten years, currently mainly analyzing and guiding BTC, ETH, DOT, DOGE, LTC, FIL, EOS, XRP, BCH, ETC, BSV, and other cryptocurrency contracts/spot operations. He has a solid theoretical foundation and practical experience, excels in combining technical and news-based operations, emphasizes capital management and risk control, and is recognized by many investment friends for his steady and decisive trading style, along with a friendly and responsible character.
免责声明:本文章仅代表作者个人观点,不代表本平台的立场和观点。本文章仅供信息分享,不构成对任何人的任何投资建议。用户与作者之间的任何争议,与本平台无关。如网页中刊载的文章或图片涉及侵权,请提供相关的权利证明和身份证明发送邮件到support@aicoin.com,本平台相关工作人员将会进行核查。


