The crypto market continues its dance of consolidation, with Bitcoin and Ethereum more or less trading sideways as traders and investors await the Federal Reserve’s next move.
But while the crypto majors tread water ahead of Wednesday’s eagerly anticipated decision on interest rates, one token is stealing the show with a face-melting 77% weekly rally: Pump.fun’s PUMP.
Defying both its own doomers and the typical seasonal market slump in September, the Solana-based Pump is proving the naysayers wrong and rewarding its diamond hands. It's gone from July’s worst-performing token to September’s comeback king.
Here’s what’s going on, and what the charts have to say about it:
Pump.fun’s PUMP price: The buy signal was real
Pump.fun might as well have told its bagholders: “If you can’t handle me at my worst, you don’t deserve me at my best.”
Those who had the stomach to handle PUMP's nearly 70% dip after its July launch are now all in the green—the coin is 63% up from its ICO price and up nearly 270% from the bottom.
PUMP's remarkable turnaround validates our analysis from July, when we called the bottom near $0.0023. The actual bottom turned out to be $0.00227—so, very close.
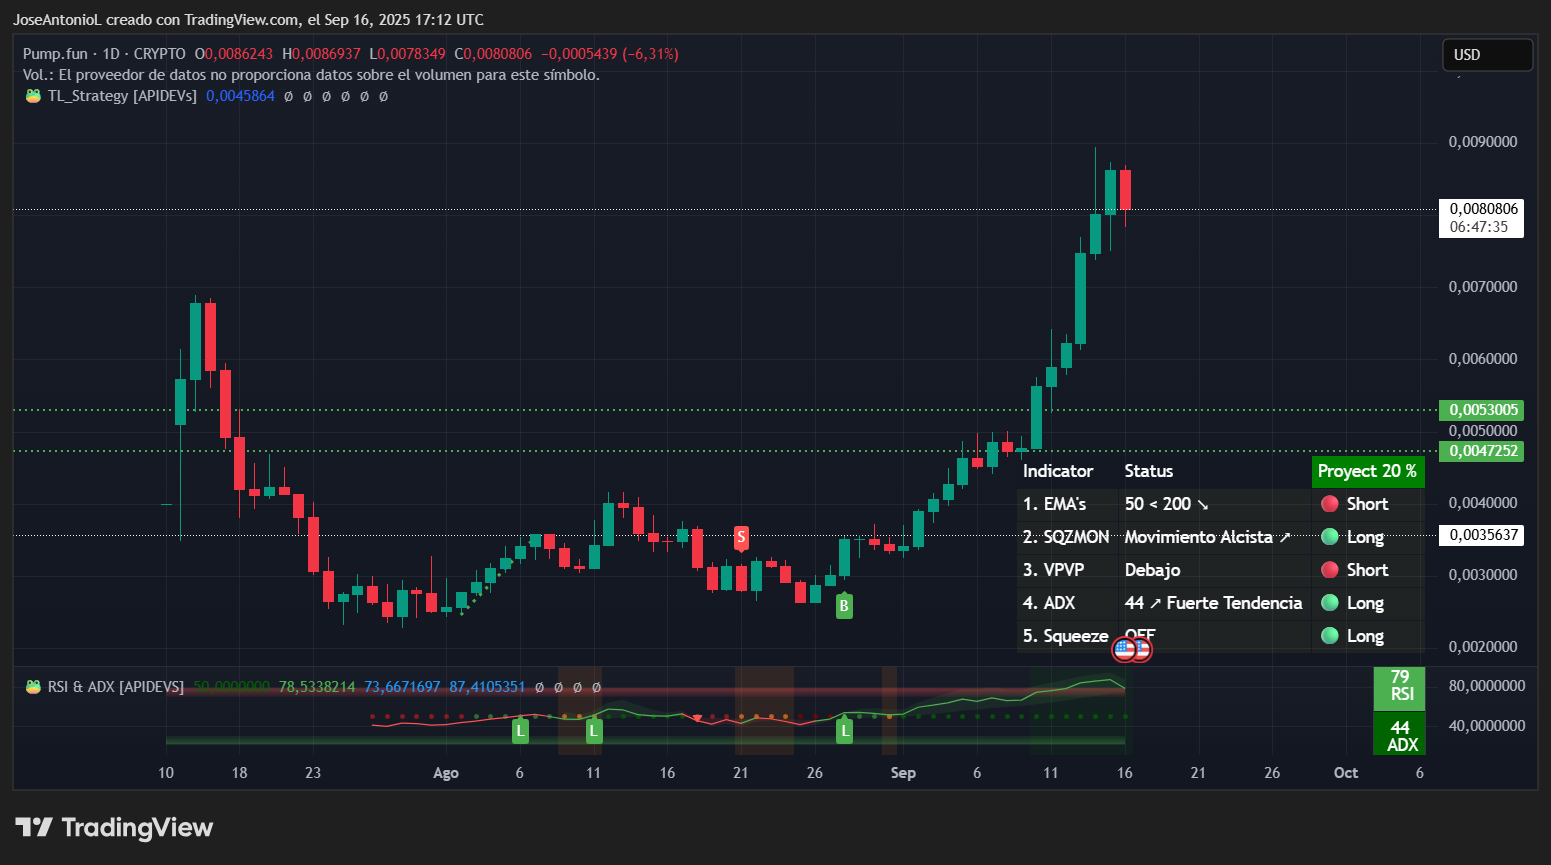
Pump.fun (PUMP) price data. Image: Tradingview
How did this happen? It can be summed up like this:
Pump.fun, the Solana meme coin launchpad responsible for millions upon millions of tokens entering the trenches, launched its own PUMP token in an ICO in July—back when competing token launchpads were nipping at its heels.
The PUMP token sold out in seconds at a $4 billion valuation, generating $600 million in fresh capital for the company. The price of PUMP soared in the immediate aftermath, then cratered almost as quickly. Throughout July and early August, Pump.fun lost ground to competing launchpads—namely Bonk.fun—and the price of PUMP suffered as a result. Then, things changed.
In late July, Pump.fun initiated token buybacks (similar to stock buybacks, for you normies out there), taking profits generated from its launchpad and putting them directly back into the chart, pumping PUMP. The company then introduced “creator rewards” (fees similar to NFT royalties) and other incentives for livestreamers, and it’s been good times for Pump ever since. The platform has regained the ground lost to competitors in July, trading volumes are up, and Pump.fun is back to generating over $1 million in revenue per day.
So, naturally, PUMP is now up 4X from its July bottom. Now, onto the charts:
The Pump token opened today at $0.0086, above an $8.6 billion fully diluted valuation, and since settled at $0.0082. It’s up slightly in the last 24 hours, testing the psychological resistance level of $0.009 marked by its all-time high.
The technical indicators most traders who study charts look at all point to a powerful uptrend, though it is approaching some significant inflection points.
The Relative Strength Index, or RSI, for PUMP is at 79 at the moment, which is deeply overbought. RSI measure measures momentum on a 0-100 scale, where readings above 70 signal overbought conditions. At 79 points, PUMP is flashing some warning signs. This is typically where profit-taking emerges as algorithmic trading systems trigger automatic sales.
Traders would read this as bearish in the immediate term, because most often lock in gains at these extreme levels, potentially triggering a pullback to the $0.007-$0.0075 range before the next leg higher.
This might be why predictors on Myriad—a prediction market built by Decrypt’s parent company, Dastan—are slightly bearish on PUMP at the moment. With PUMP currently at a $2.9 billion market cap, Myriad users believe it’s more likely PUMP dips below $2 billion than spikes above $4 billion, placing odds at 54.3% vs 45.7%.
Another common indicator for technical-analysis-minded traders is the Average Directional Index, or ADX. PUMP’s ADX is at 44, which screams "strong trend in progress." ADX measures trend strength regardless of direction, with readings above 25 confirming established trends and above 40 indicating extremely powerful momentum.
At 44, PUMP’s ADX gives traders a sense that a long-term bullish trend is in place. In other words, despite a possible correction, there is a reasonable chance of a cup and handle pattern emerging in the chart—the sort that’s formed from a big crash (in July) and recovery (now) followed by a smaller crash and recovery shortly after.
Since the coin is still so young, there is still not enough data to do an exponential moving average comparison. But in shorter timeframes, the coin entered into “golden cross” territory in early September.
A golden cross is when the average price of an asset over short term crosses above the average price over the long term, and it’s widely interpreted by traders as a strong bullish signal.
This is important because price action in shorter timeframes is often noisier than in longer timeframes, but price movements appear on those noisy charts sooner. In other words, extrapolating data, it’s easy to see why traders would conclude a bullish move is in play when short-term averages are moving above slower long-term averages.
Also, the coin has done a 4X in seven weeks. So there’s that, too.
Key levels to watch:
- Immediate support: $0.0074 (recent consolidation zone)
- Strong support: $0.0066
- Immediate resistance: $0.0090 (psychological level near all-time high)
- Strong resistance: $0.0105 (next Fibonacci extension and potential breakout target)
The views and opinions expressed by the author are for informational purposes only and do not constitute financial, investment, or other advice.
免责声明:本文章仅代表作者个人观点,不代表本平台的立场和观点。本文章仅供信息分享,不构成对任何人的任何投资建议。用户与作者之间的任何争议,与本平台无关。如网页中刊载的文章或图片涉及侵权,请提供相关的权利证明和身份证明发送邮件到support@aicoin.com,本平台相关工作人员将会进行核查。


