This recent crash was primarily triggered by excessive leverage and the overheated rise of altcoins, leading to a series of forced liquidations. The liquidation and margin call notifications triggered automatic sell orders, accelerating the decline of Bitcoin. This chain reaction resulted in massive liquidations in a short period, causing the total market capitalization of digital assets to fall below the $4 trillion mark. The current pullback is within the normal volatility range of the crypto market. Historically, "altcoin season" tends to be relatively short-lived, often lasting only a few weeks. On a positive note, lending protocols in the DeFi space have not faced the threat of large-scale liquidations, as most loan positions remain conservative, with large-scale liquidation levels far below current prices. In fact, prior to this drop, Yan Ling had predicted that after the interest rate cut, it would be bearish, and one should not blindly follow the trend to go long; this wave of selling serves as a typical lesson for bulls.
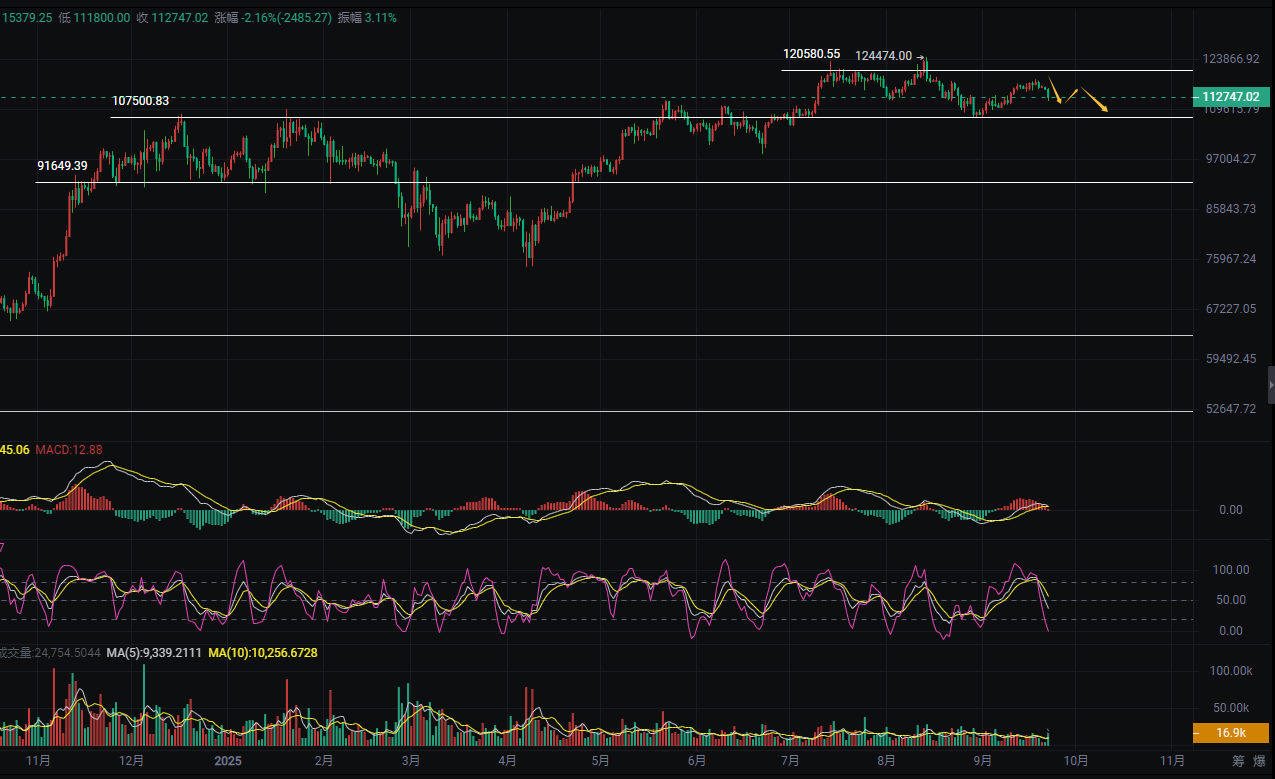
Returning to the technical aspect, Bitcoin's recent price trend on the daily chart has shown a continuous decline, with a large bearish candle formed yesterday, indicating a weak pattern. On the hourly chart, the price has gradually decreased after oscillating at high levels, with most recent hourly candles being small bearish candles or doji, reflecting a bearish market sentiment. The technical indicator MACD on the hourly chart remains in the negative territory, and the histogram is expanding, indicating that bearish forces dominate in the short term. The daily MACD is also in a death cross state, with a bearish trend. The hourly RSI is at 32.3, close to the oversold zone, but has not yet entered an extreme position; the daily RSI remains below 40, showing insufficient overall market momentum. The hourly EMA7, EMA30, and EMA120 are all in a bearish arrangement, with the price currently running below all moving averages, indicating that the short-term, medium-term, and long-term trends are all leaning towards a downward direction.
Zhou Yanling's 9.23 Bitcoin Trading Strategy:
Short at 113800-113000, stop loss above 114800, target 111500-110600
Long at 110000-110800, stop loss below 109000, target 112000-112800
Zhou Yanling's 9.23 Ethereum Trading Strategy:
Short at 4320-4280, stop loss above 4370, target 4000-3950, continue to look for a decline towards around 3850
Long at 3930-3970, stop loss below 3880, target 4080-4120
【The above analysis and strategies are for reference only. Please bear the risks yourself. The article review and publication may have delays, and the strategies may not be timely. Specific operations should follow Yan Ling's real-time strategies.】

The content of this article is exclusively shared by senior analyst Zhou Yanling (WeChat public account: Zhou Yanling). The author has been engaged in financial market investment research for over ten years, currently mainly analyzing and guiding BTC, ETH, DOT, DOGE, LTC, FIL, EOS, XRP, BCH, ETC, BSV, and other cryptocurrency contracts/spot operations. He has a solid theoretical foundation and practical experience, excels in combining technical and news-based operations, emphasizes capital management and risk control, and is recognized by many investment friends for his steady and decisive trading style, along with his easygoing and responsible personality.
免责声明:本文章仅代表作者个人观点,不代表本平台的立场和观点。本文章仅供信息分享,不构成对任何人的任何投资建议。用户与作者之间的任何争议,与本平台无关。如网页中刊载的文章或图片涉及侵权,请提供相关的权利证明和身份证明发送邮件到support@aicoin.com,本平台相关工作人员将会进行核查。


