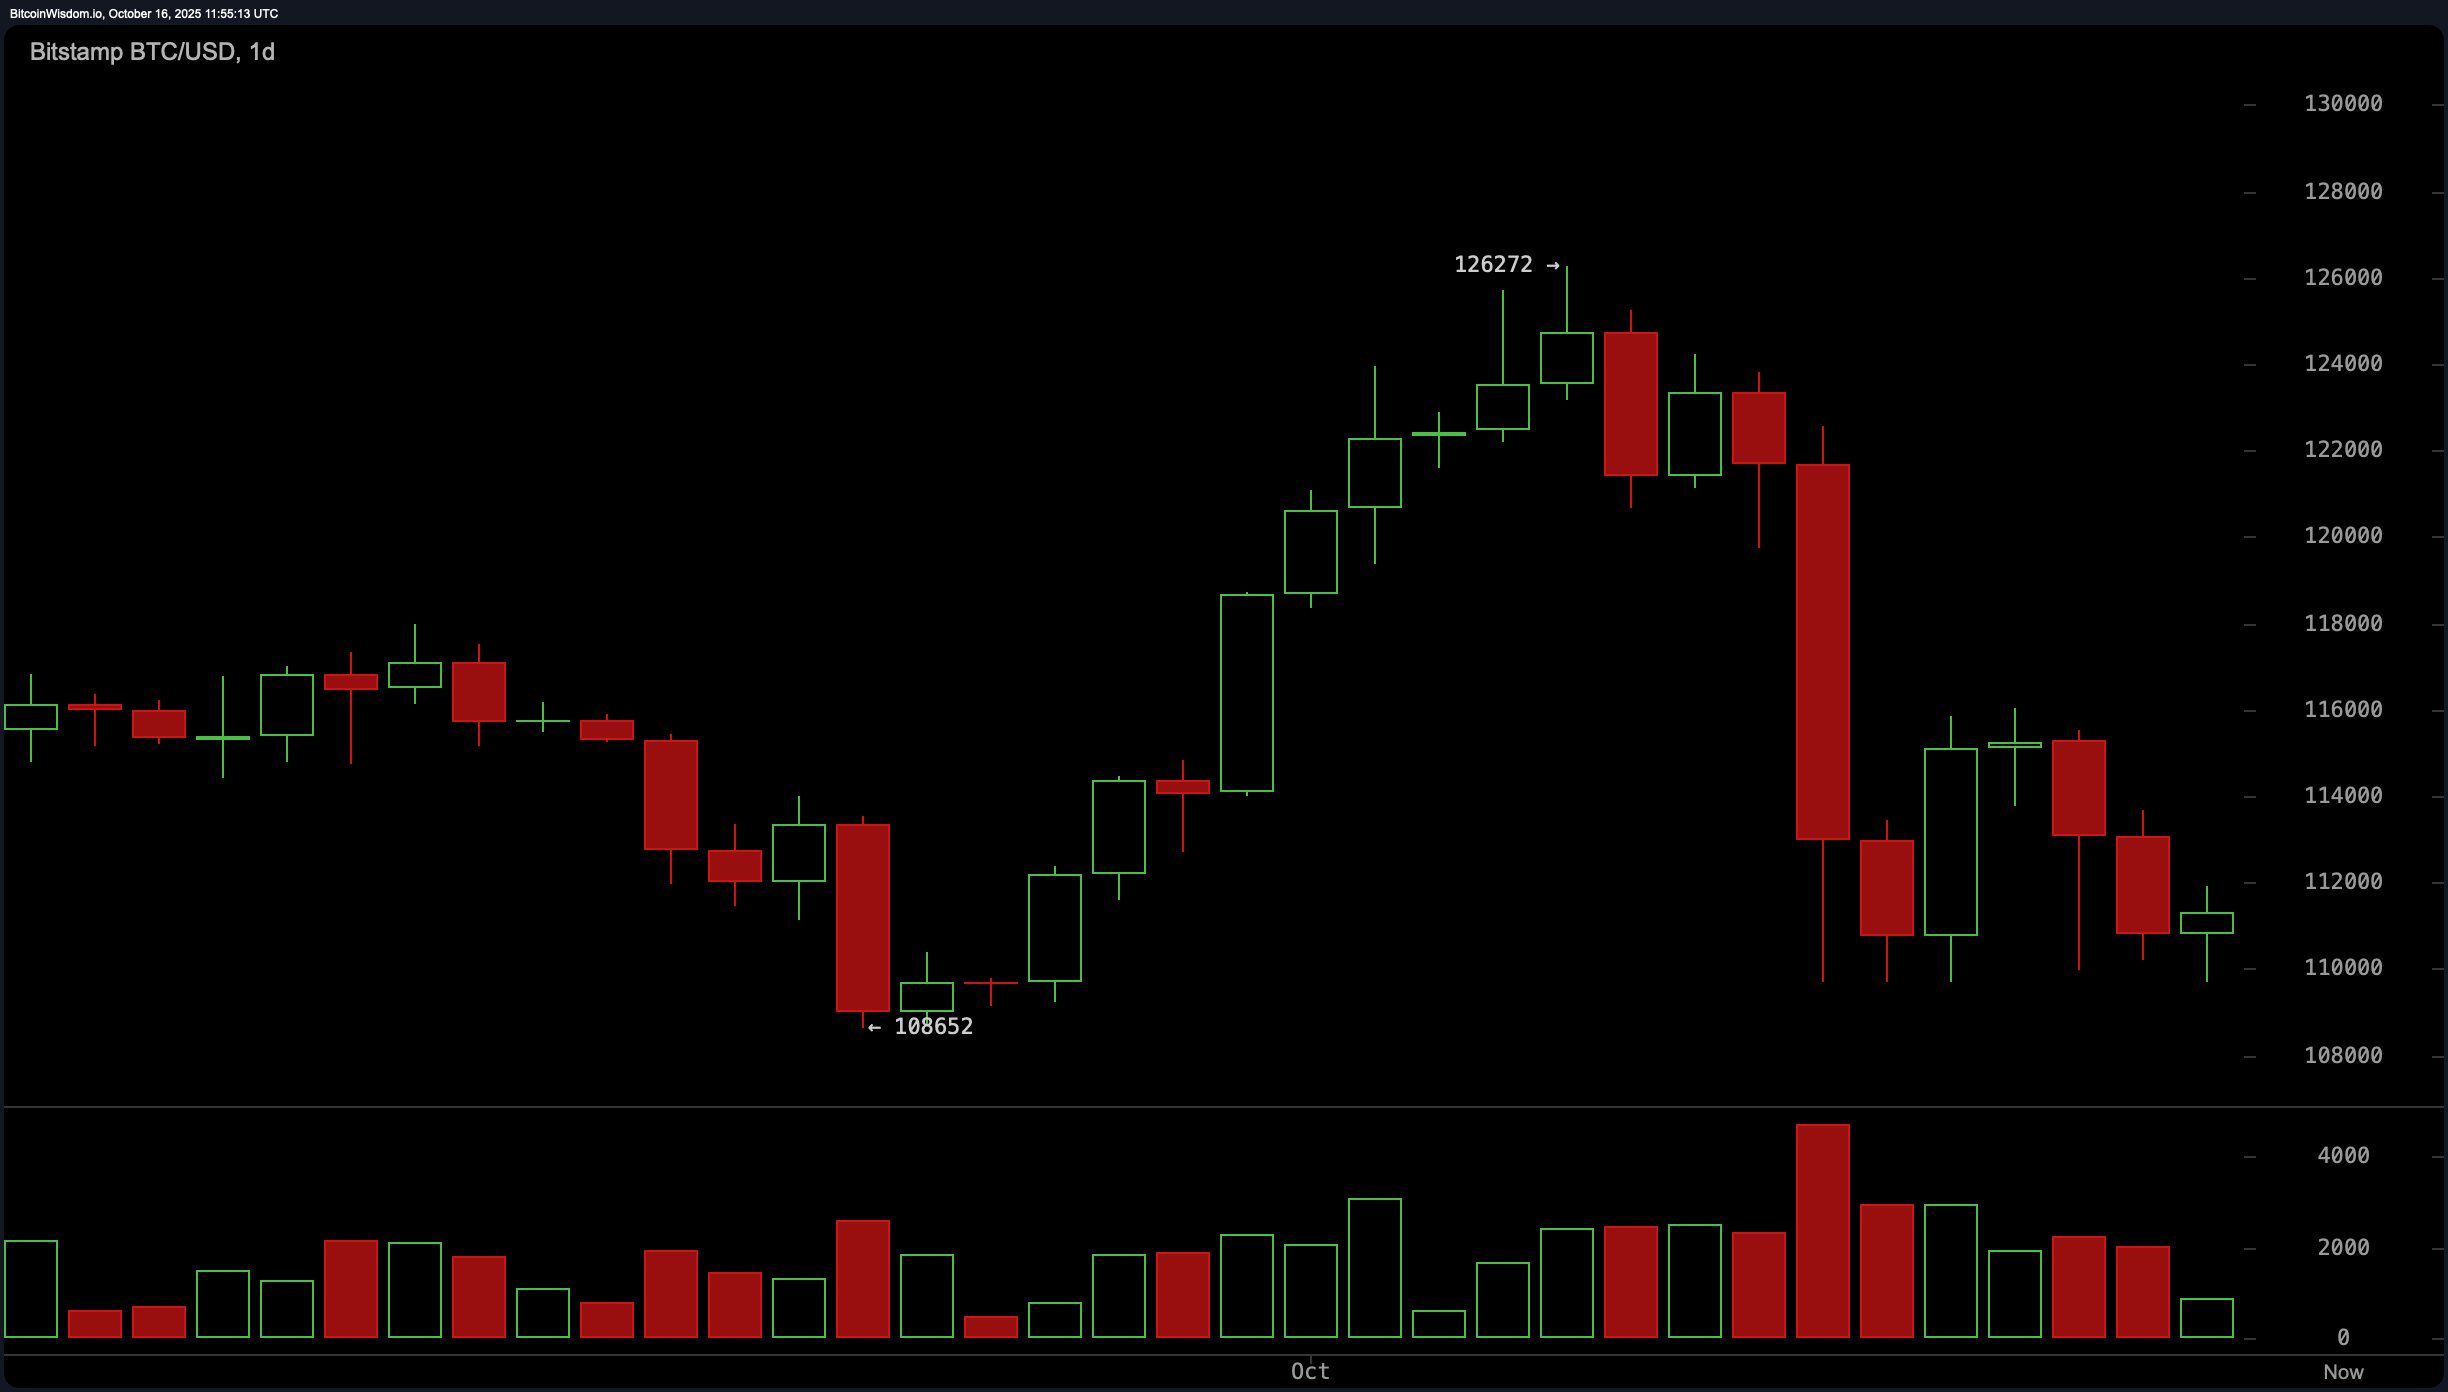
Let’s start with the daily chart, where the grand stage reveals a classic post-rally reversal. Bitcoin punched in an all-time high (ATH) near $126,272 before slipping off that pedestal and tumbling back toward the $111K range. The break below the uptrend from September wasn’t exactly graceful, triggered by a heavy-volume cascade that flipped the script to a short-term bearish bias.
The current floor is clinging around $108,500–$110,000—a familiar consolidation zone that must hold if bitcoin wants to avoid a more brutal correction. Resistance looms between $118,000–$120,000, making it clear this market isn’t giving out second chances for free.

BTC/USD 1-day chart via Bitstamp on Oct. 16, 2025.
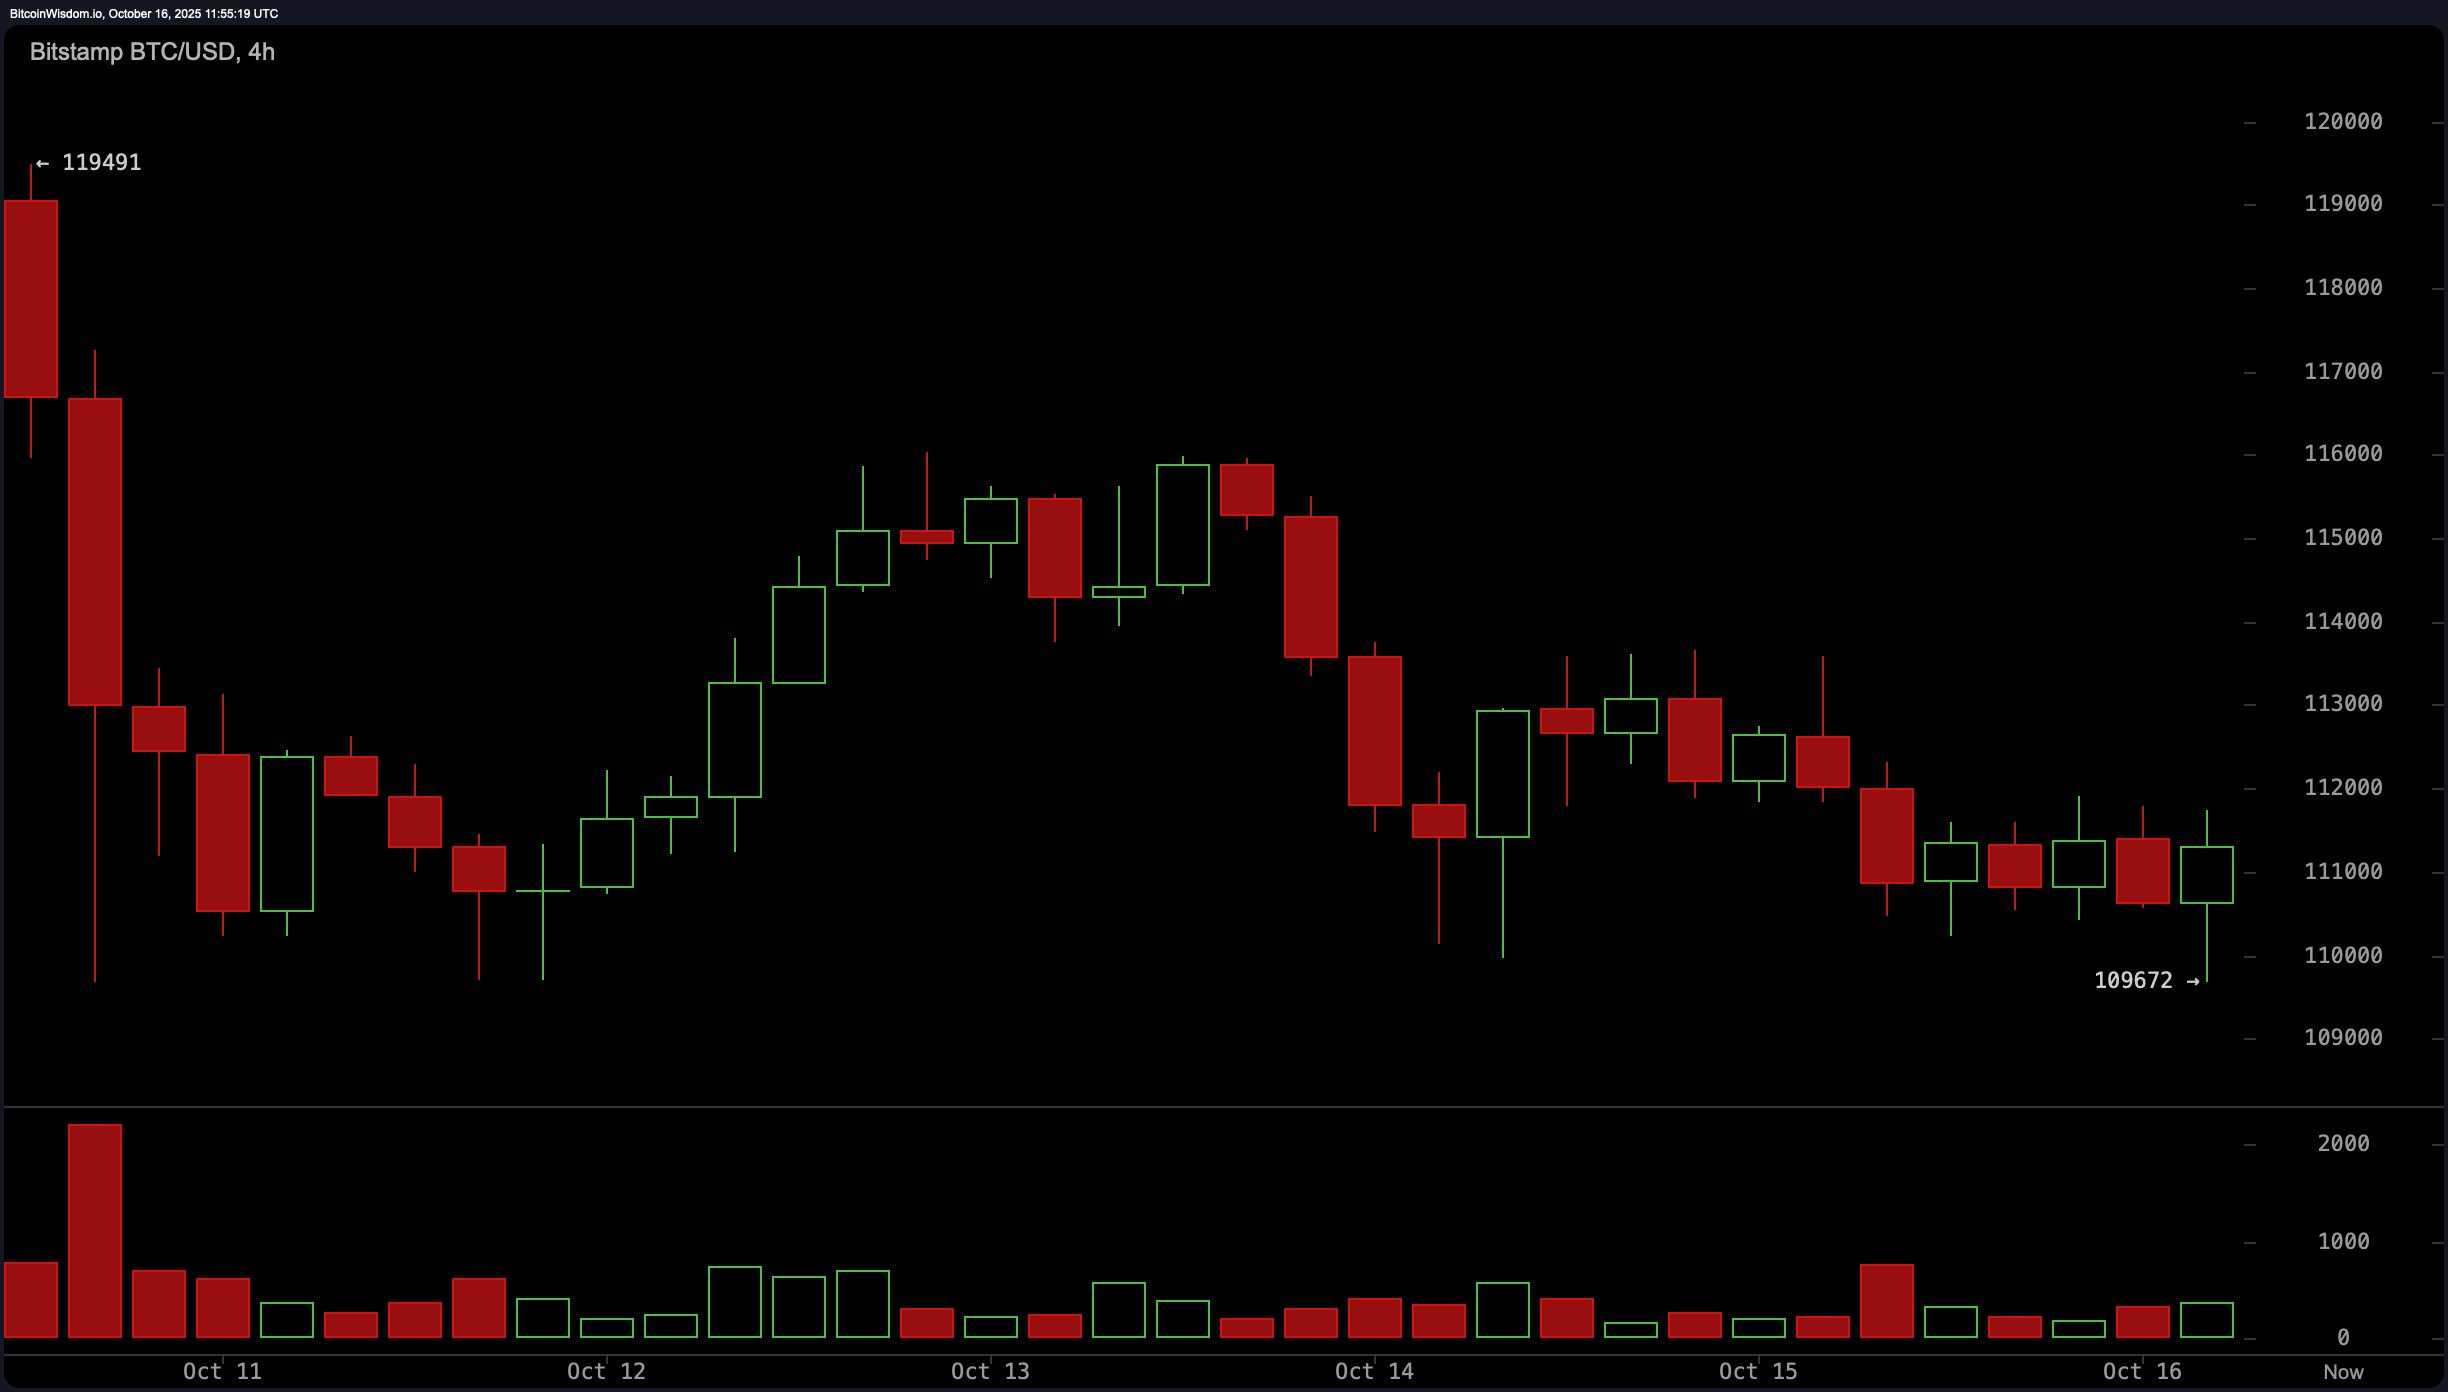
Zooming into the 4-hour chart, things aren’t looking much brighter. Since October 13, bitcoin has been forming lower highs like a cautious toddler walking down the stairs. Each bounce off support comes with weaker volume—translation: buyers are showing up without much muscle. The price appears stuck in a bearish-to-neutral loop, trying to gather strength near $110,000. While some short-term setups might tempt scalpers around this level, any run toward $113,000–$114,000 has been met with resistance stiff enough to snap a candlewick.

BTC/USD 4-hour chart via Bitstamp on Oct. 16, 2025.
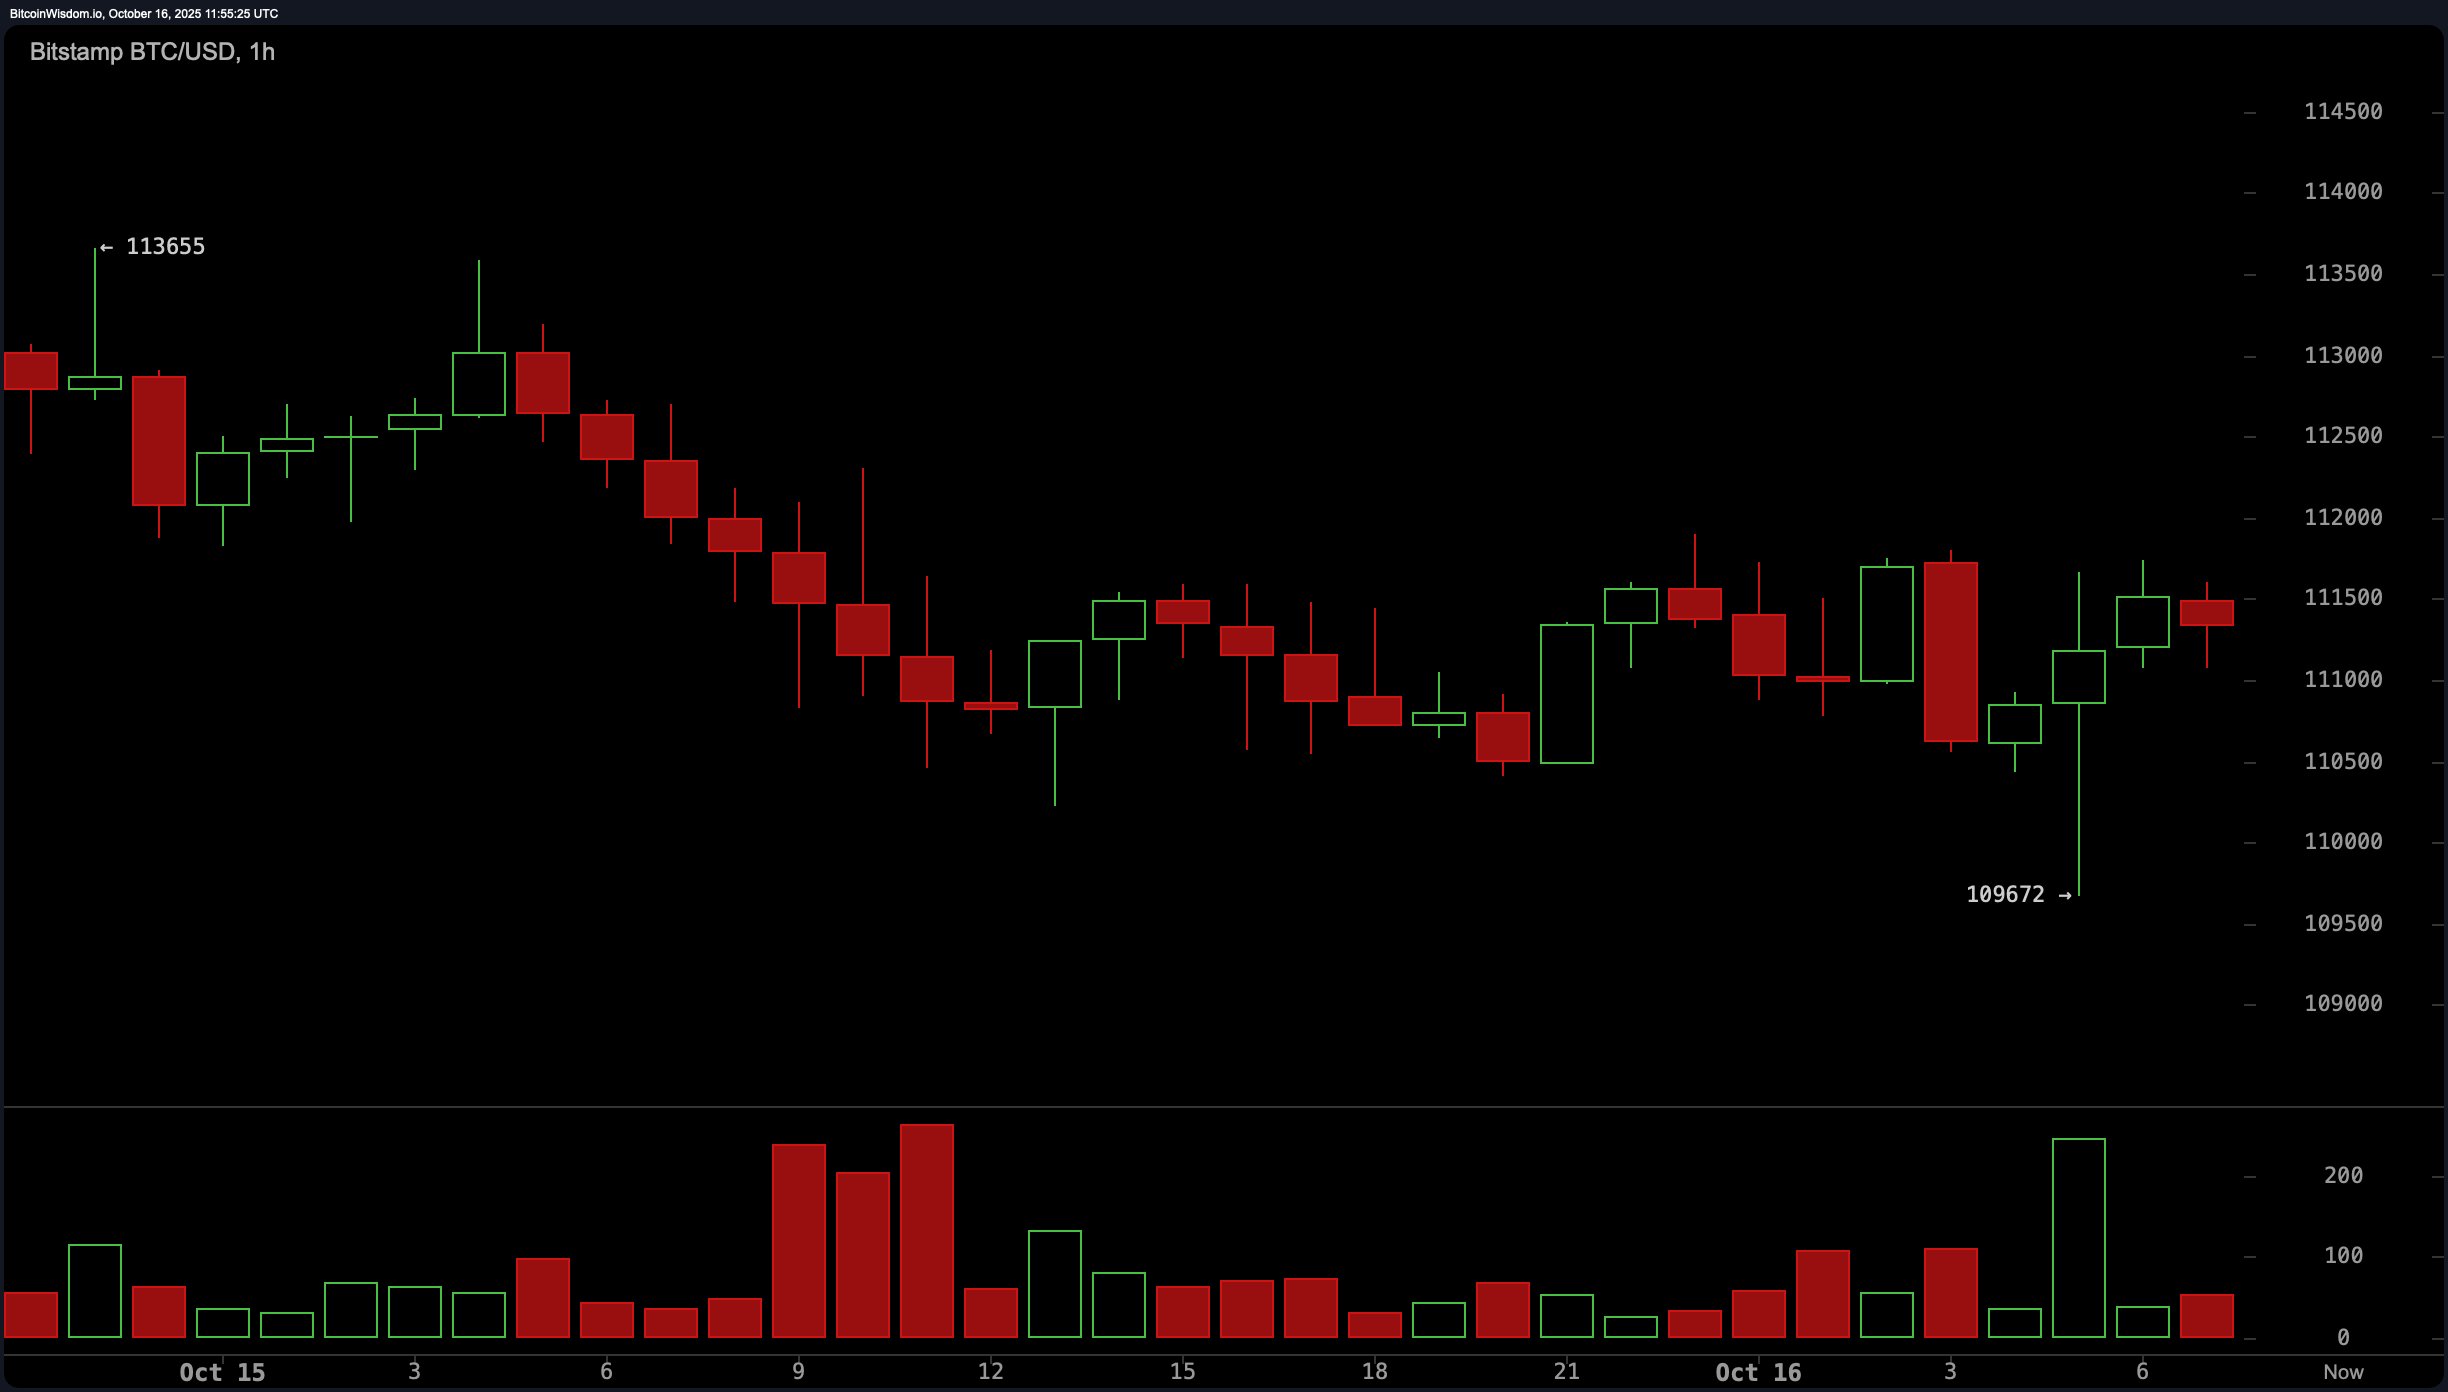
On the 1-hour bitcoin chart, it’s a choppy mess of sideways motion. The intraday pattern drifts between $109,672 and $113,655, like it can’t decide whether to snooze or sprint. Momentum indicators are throwing mixed signals, with tiny upward nudges that hint at base-building—though nothing that screams conviction. A sustained push would need rising volume and clean breaks above $112,500, but for now, the movement looks more like indecision than accumulation. In short: it’s spinning its wheels, and the tires aren’t gripping.

BTC/USD 1-hour chart via Bitstamp on Oct. 16, 2025.
Now for the real talk—oscillators and moving averages are sounding the alarm with zero subtlety. Among oscillators, the relative strength index (RSI) sits at 42, Stochastic at 12, and the commodity channel index (CCI) at −85—all in neutral territory, waiting for a reason to care. The average directional index (ADX) at 25 and the Awesome oscillator at −3,168 aren’t adding much optimism either. Momentum and the moving average convergence divergence (MACD) both flash bearish vibes, with values at −13,505 and −690, respectively.
The moving averages lineup is a wall of resistance: all short- and mid-term exponential moving averages (EMAs) and simple moving averages (SMAs)—from the 10 to the 100-period—are pointing lower. Only the 200-period EMA and SMA hint at underlying strength, acting as long-term safety nets around $108K. Overall, bitcoin is dancing through a tightrope of short-term consolidation while lugging the weight of a broader correction. Unless it snaps back above $115,000 with strong volume, the bias remains tilted toward downside risks. That said, there’s potential for a bounce near the $110K region—just don’t blink, or you might miss it.
Bull Verdict:
If bitcoin can hold the $110,000 support zone and rally with volume confirmation, a push toward $118,000–$120,000 is within reach. The long-term trend remains structurally intact, and with the 200-period moving averages offering support, this could be a healthy consolidation before the next leg higher—assuming the bulls don’t hit snooze again.
Bear Verdict:
Failure to defend $108,000 per bitcoin would likely unravel what’s left of short-term bullish momentum, exposing downside risk toward $104,000 or lower. With every major short- to mid-term moving average leaning negative and oscillators lacking direction, the bears have the upper hand—for now.
- Where is bitcoin trading right now?
bitcoin is trading at $111,226 as of October 16, 2025. - What is the current market cap of bitcoin?
The market capitalization of bitcoin stands at $2.21 trillion. - What’s the key support level to watch?
The $108,000–$110,000 range is the critical support zone. - Are technical indicators bullish or bearish?
Most oscillators and moving averages are flashing bearish signals.
免责声明:本文章仅代表作者个人观点,不代表本平台的立场和观点。本文章仅供信息分享,不构成对任何人的任何投资建议。用户与作者之间的任何争议,与本平台无关。如网页中刊载的文章或图片涉及侵权,请提供相关的权利证明和身份证明发送邮件到support@aicoin.com,本平台相关工作人员将会进行核查。


