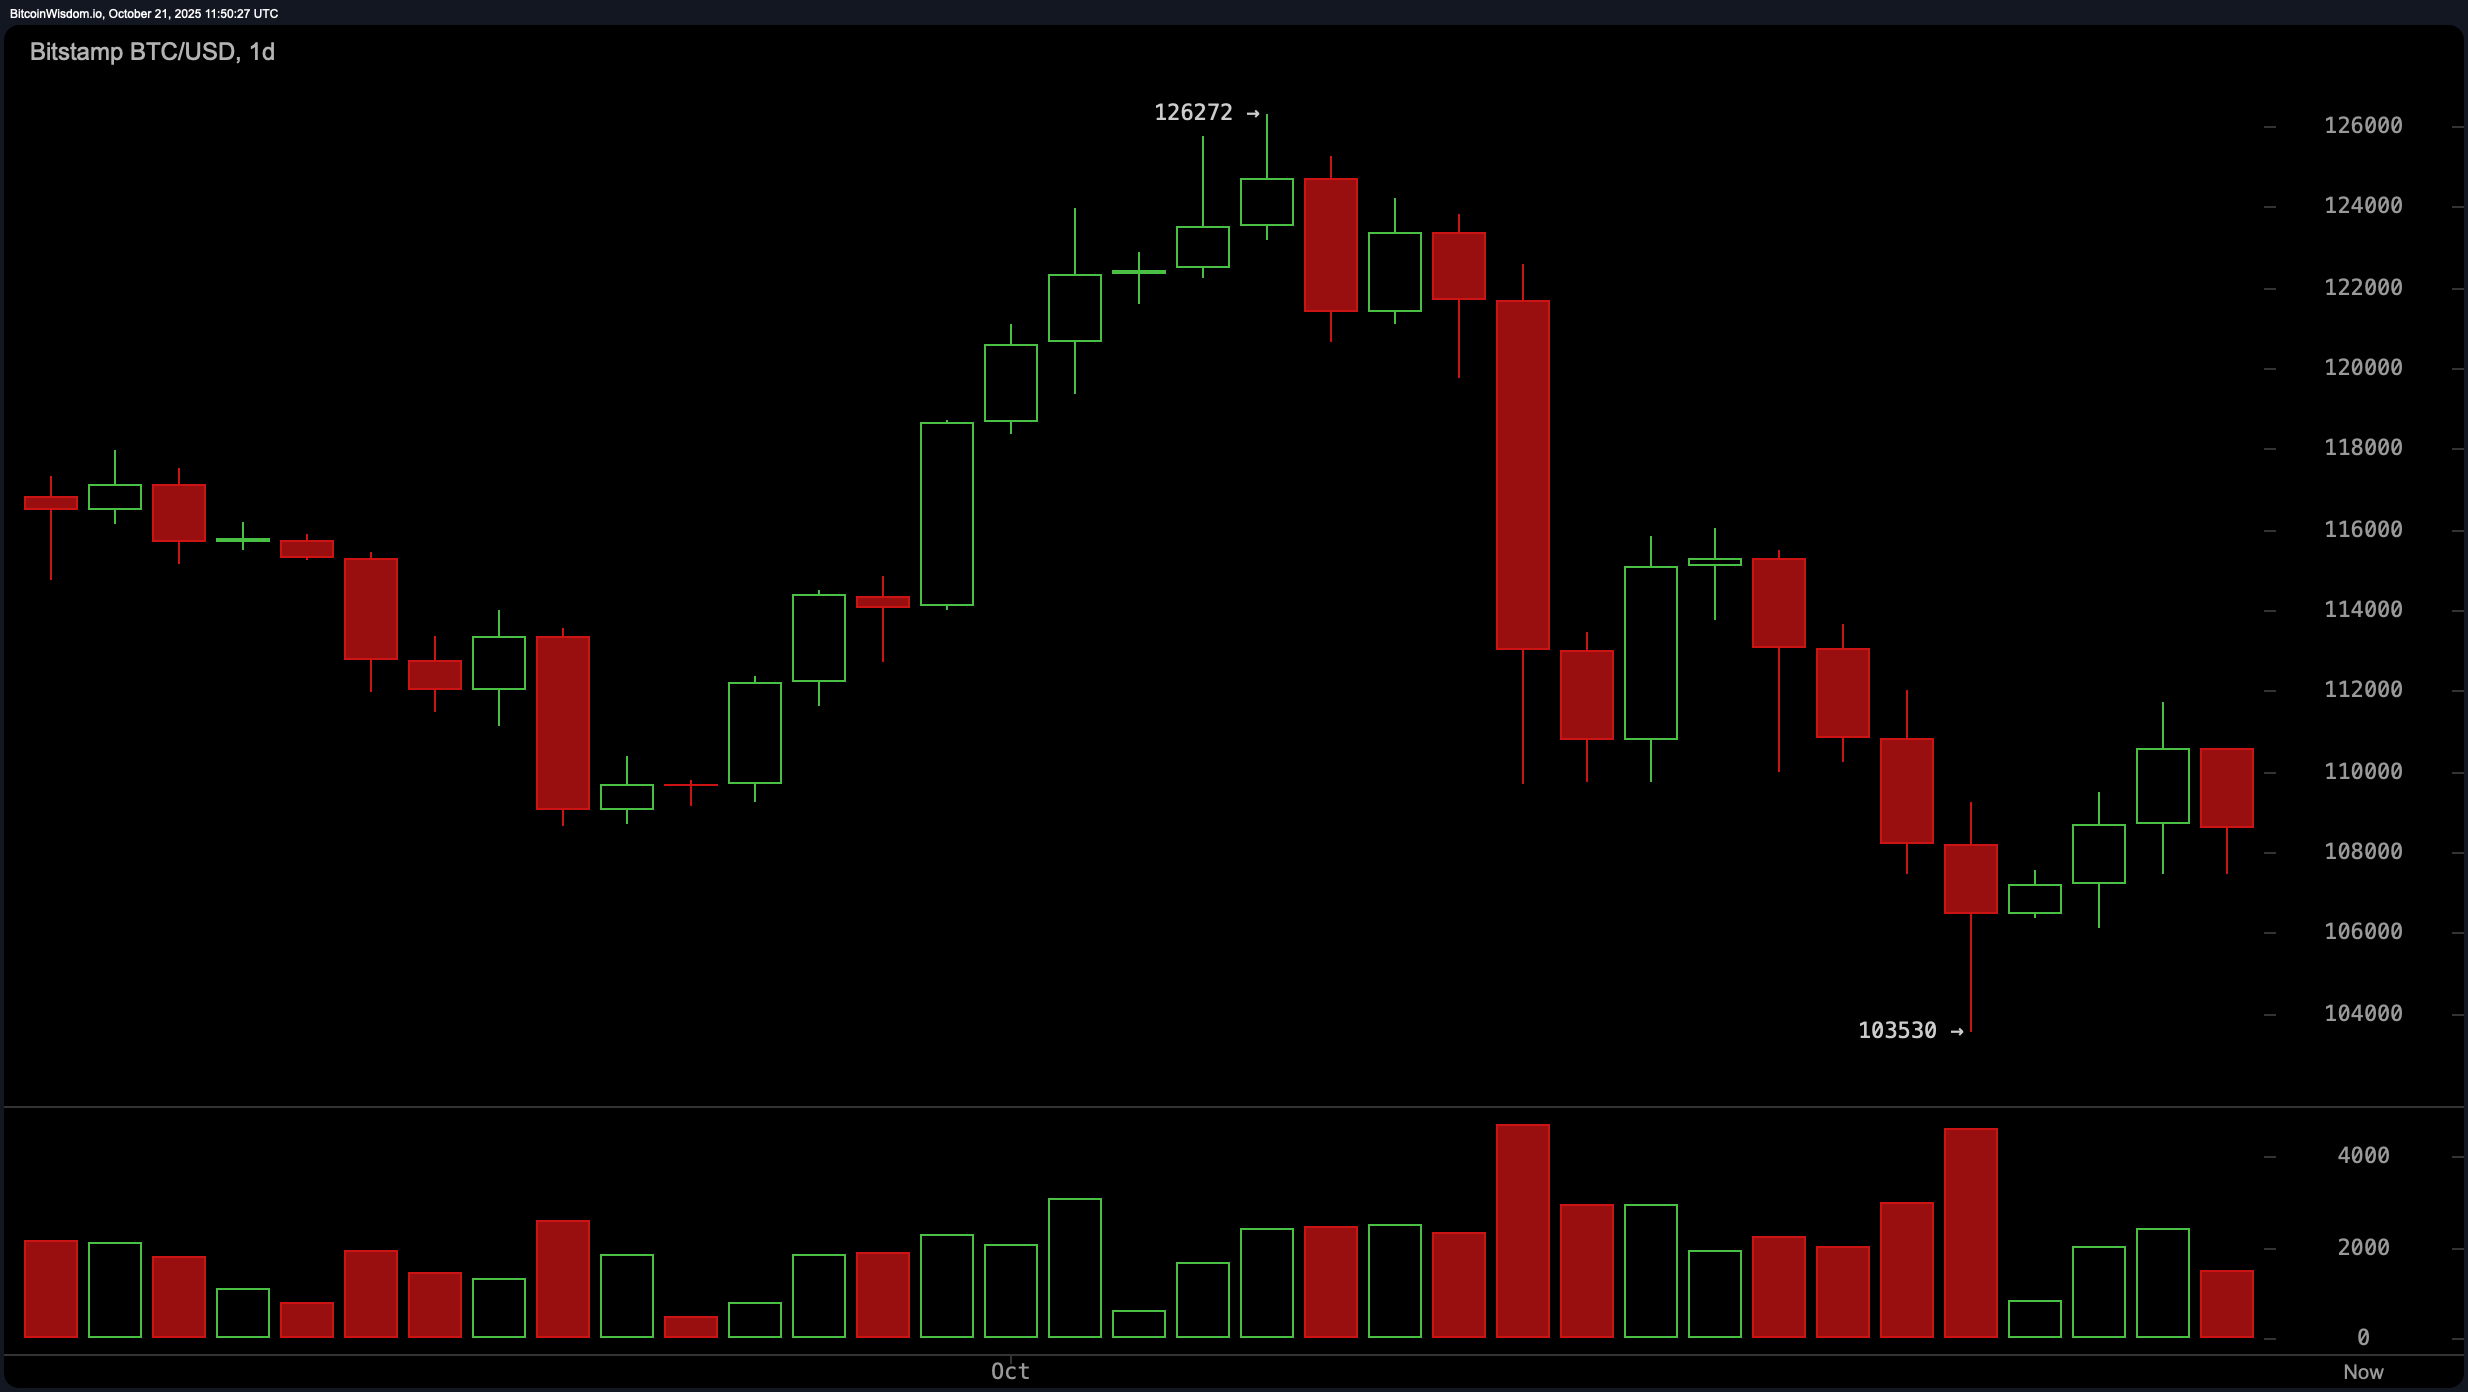
A review of the daily chart indicates that bitcoin remains in a clear bearish trend following a local peak near $126,272. Heavy red candles and a spike in trading volume confirmed significant capitulation, with a recent low forming around $103,530. Although a hammer-type candlestick has emerged, suggesting a possible short-term reversal, there has not been a convincing follow-through to affirm a sustained recovery.
The decrease in volume following the selloff may imply seller exhaustion, yet without a decisive move above the $112,000 resistance, caution remains warranted. Current price action hovers near a potential inflection point.

BTC/USD daily chart on Oct. 21, 2025, via Bitstamp.
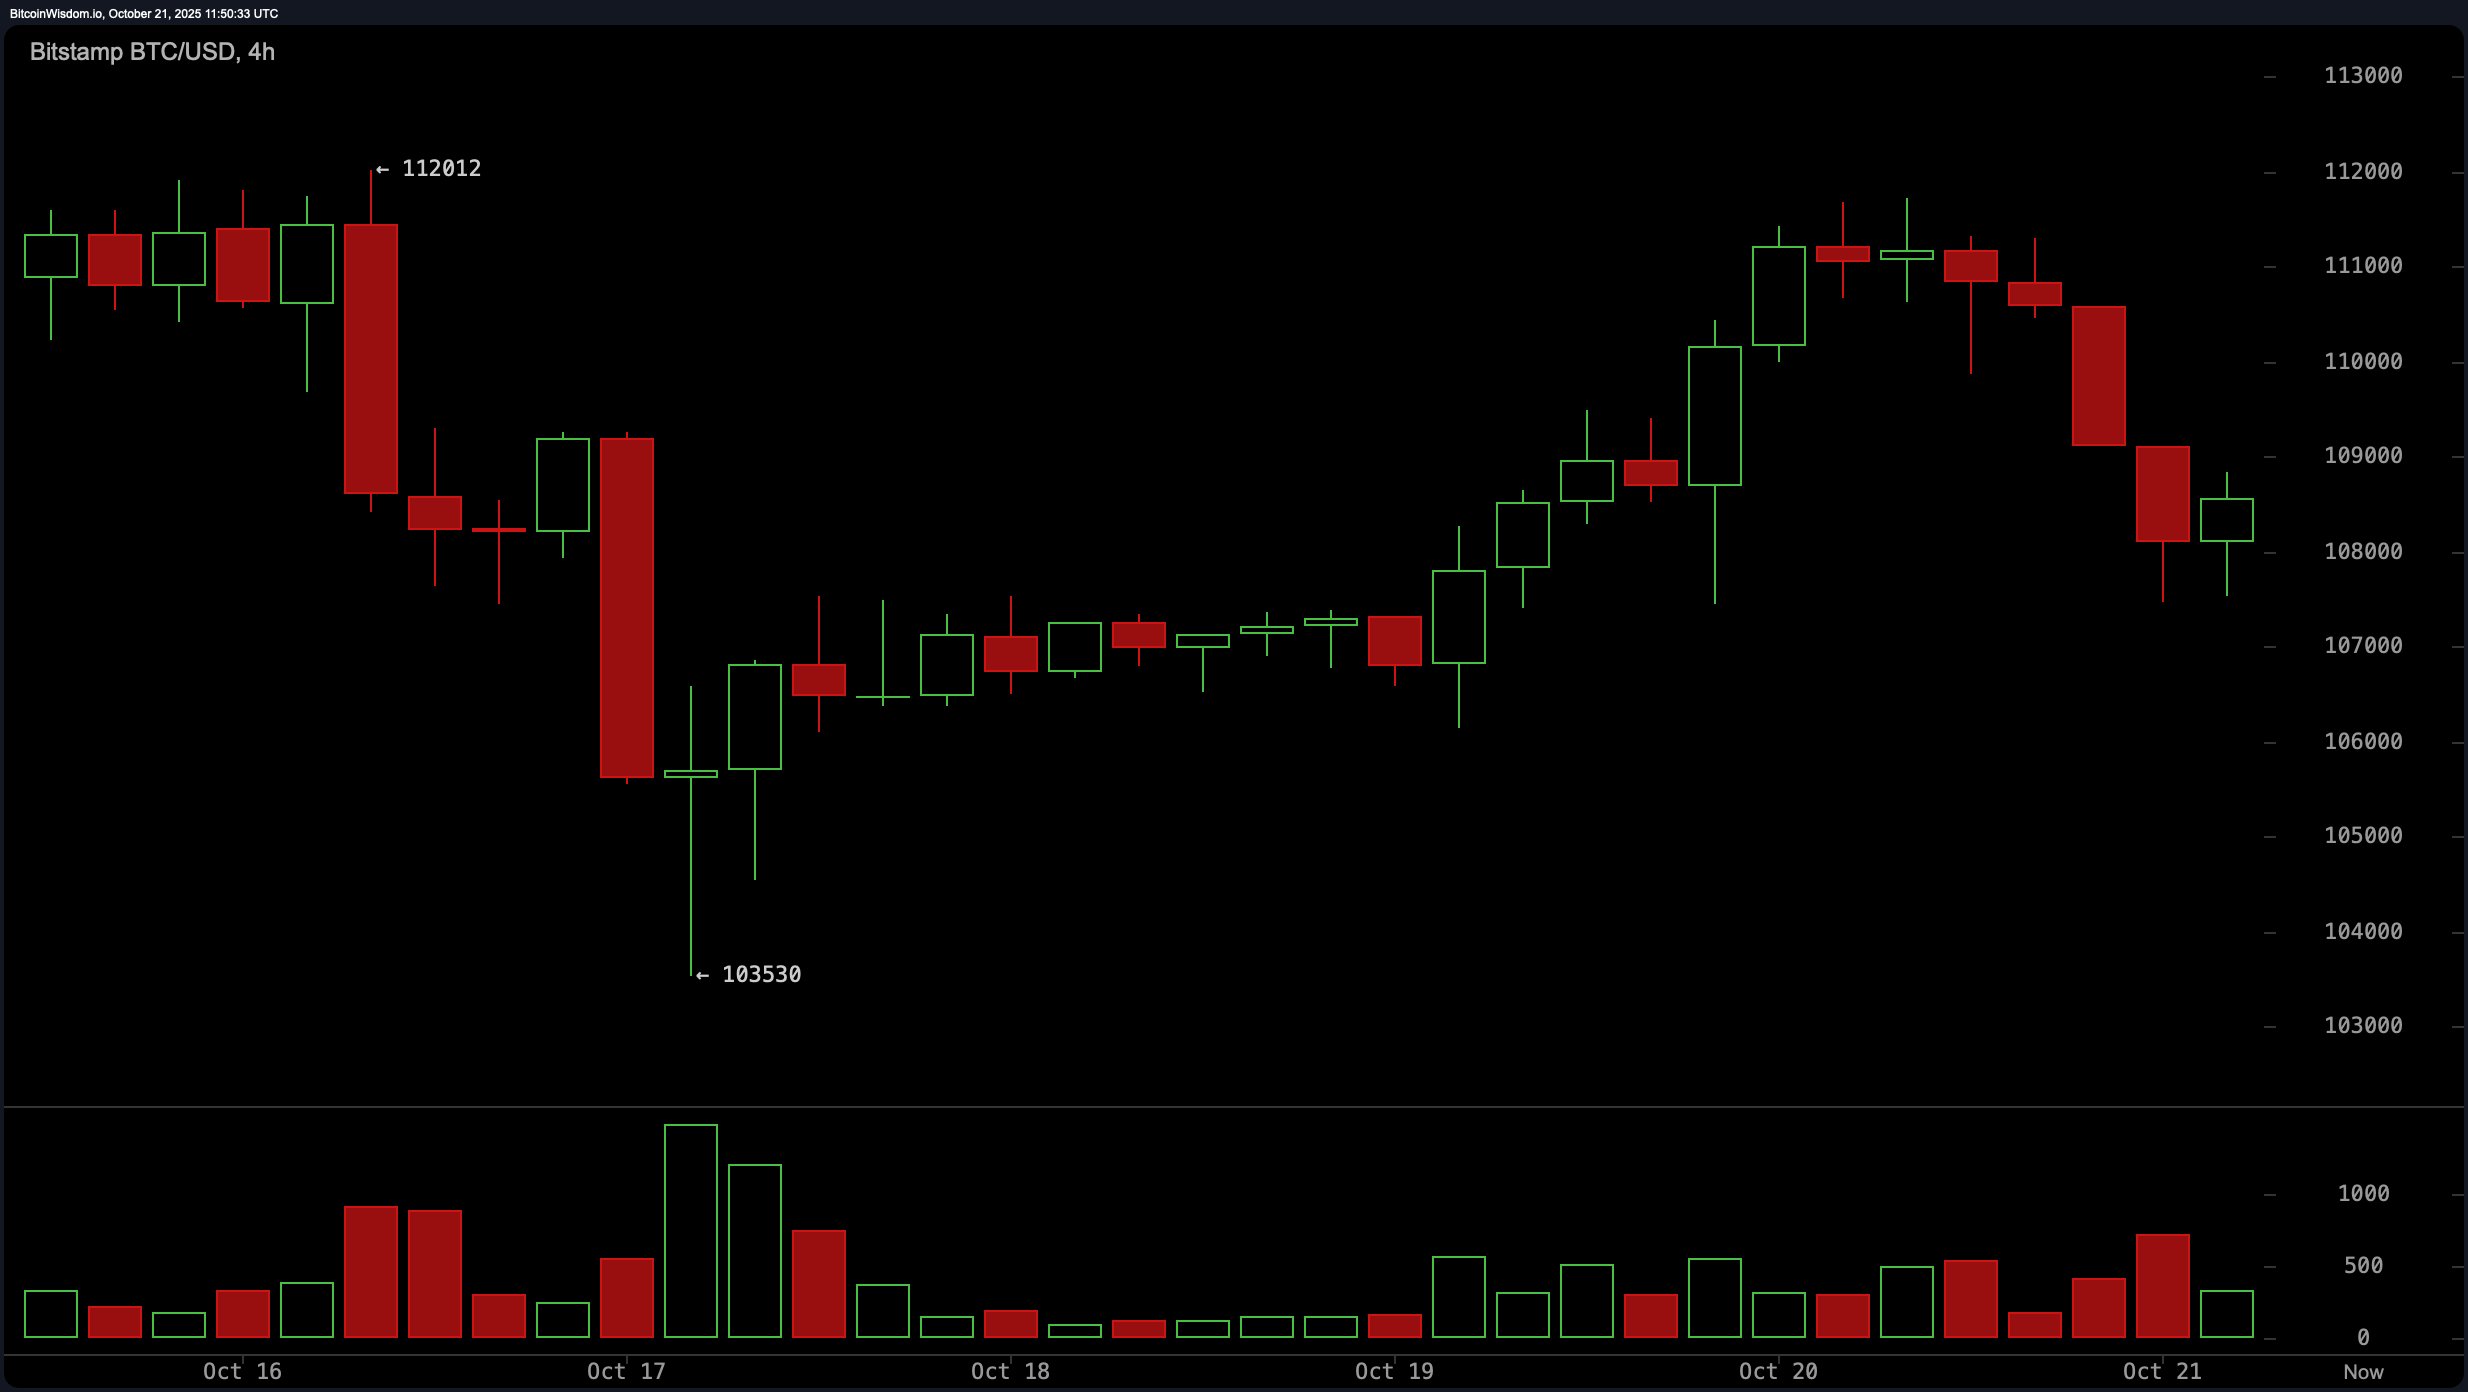
The 4-hour chart reveals a rapid decline from $112,212 to $103,530, followed by sideways consolidation. This behavior suggests a developing accumulation zone, but renewed downward pressure and increased red candle volume indicate persistent distribution. Resistance continues to hold firm near $112,000, and a failure to breach this level confirms the possibility of a bear flag structure. A continued rejection in this zone could prompt another leg lower, with downside pressure intensifying on elevated volume. Sustained momentum above this ceiling would be needed to challenge prior highs near $116,000.

BTC/USD 4-hour chart on Oct. 21, 2025, via Bitstamp.
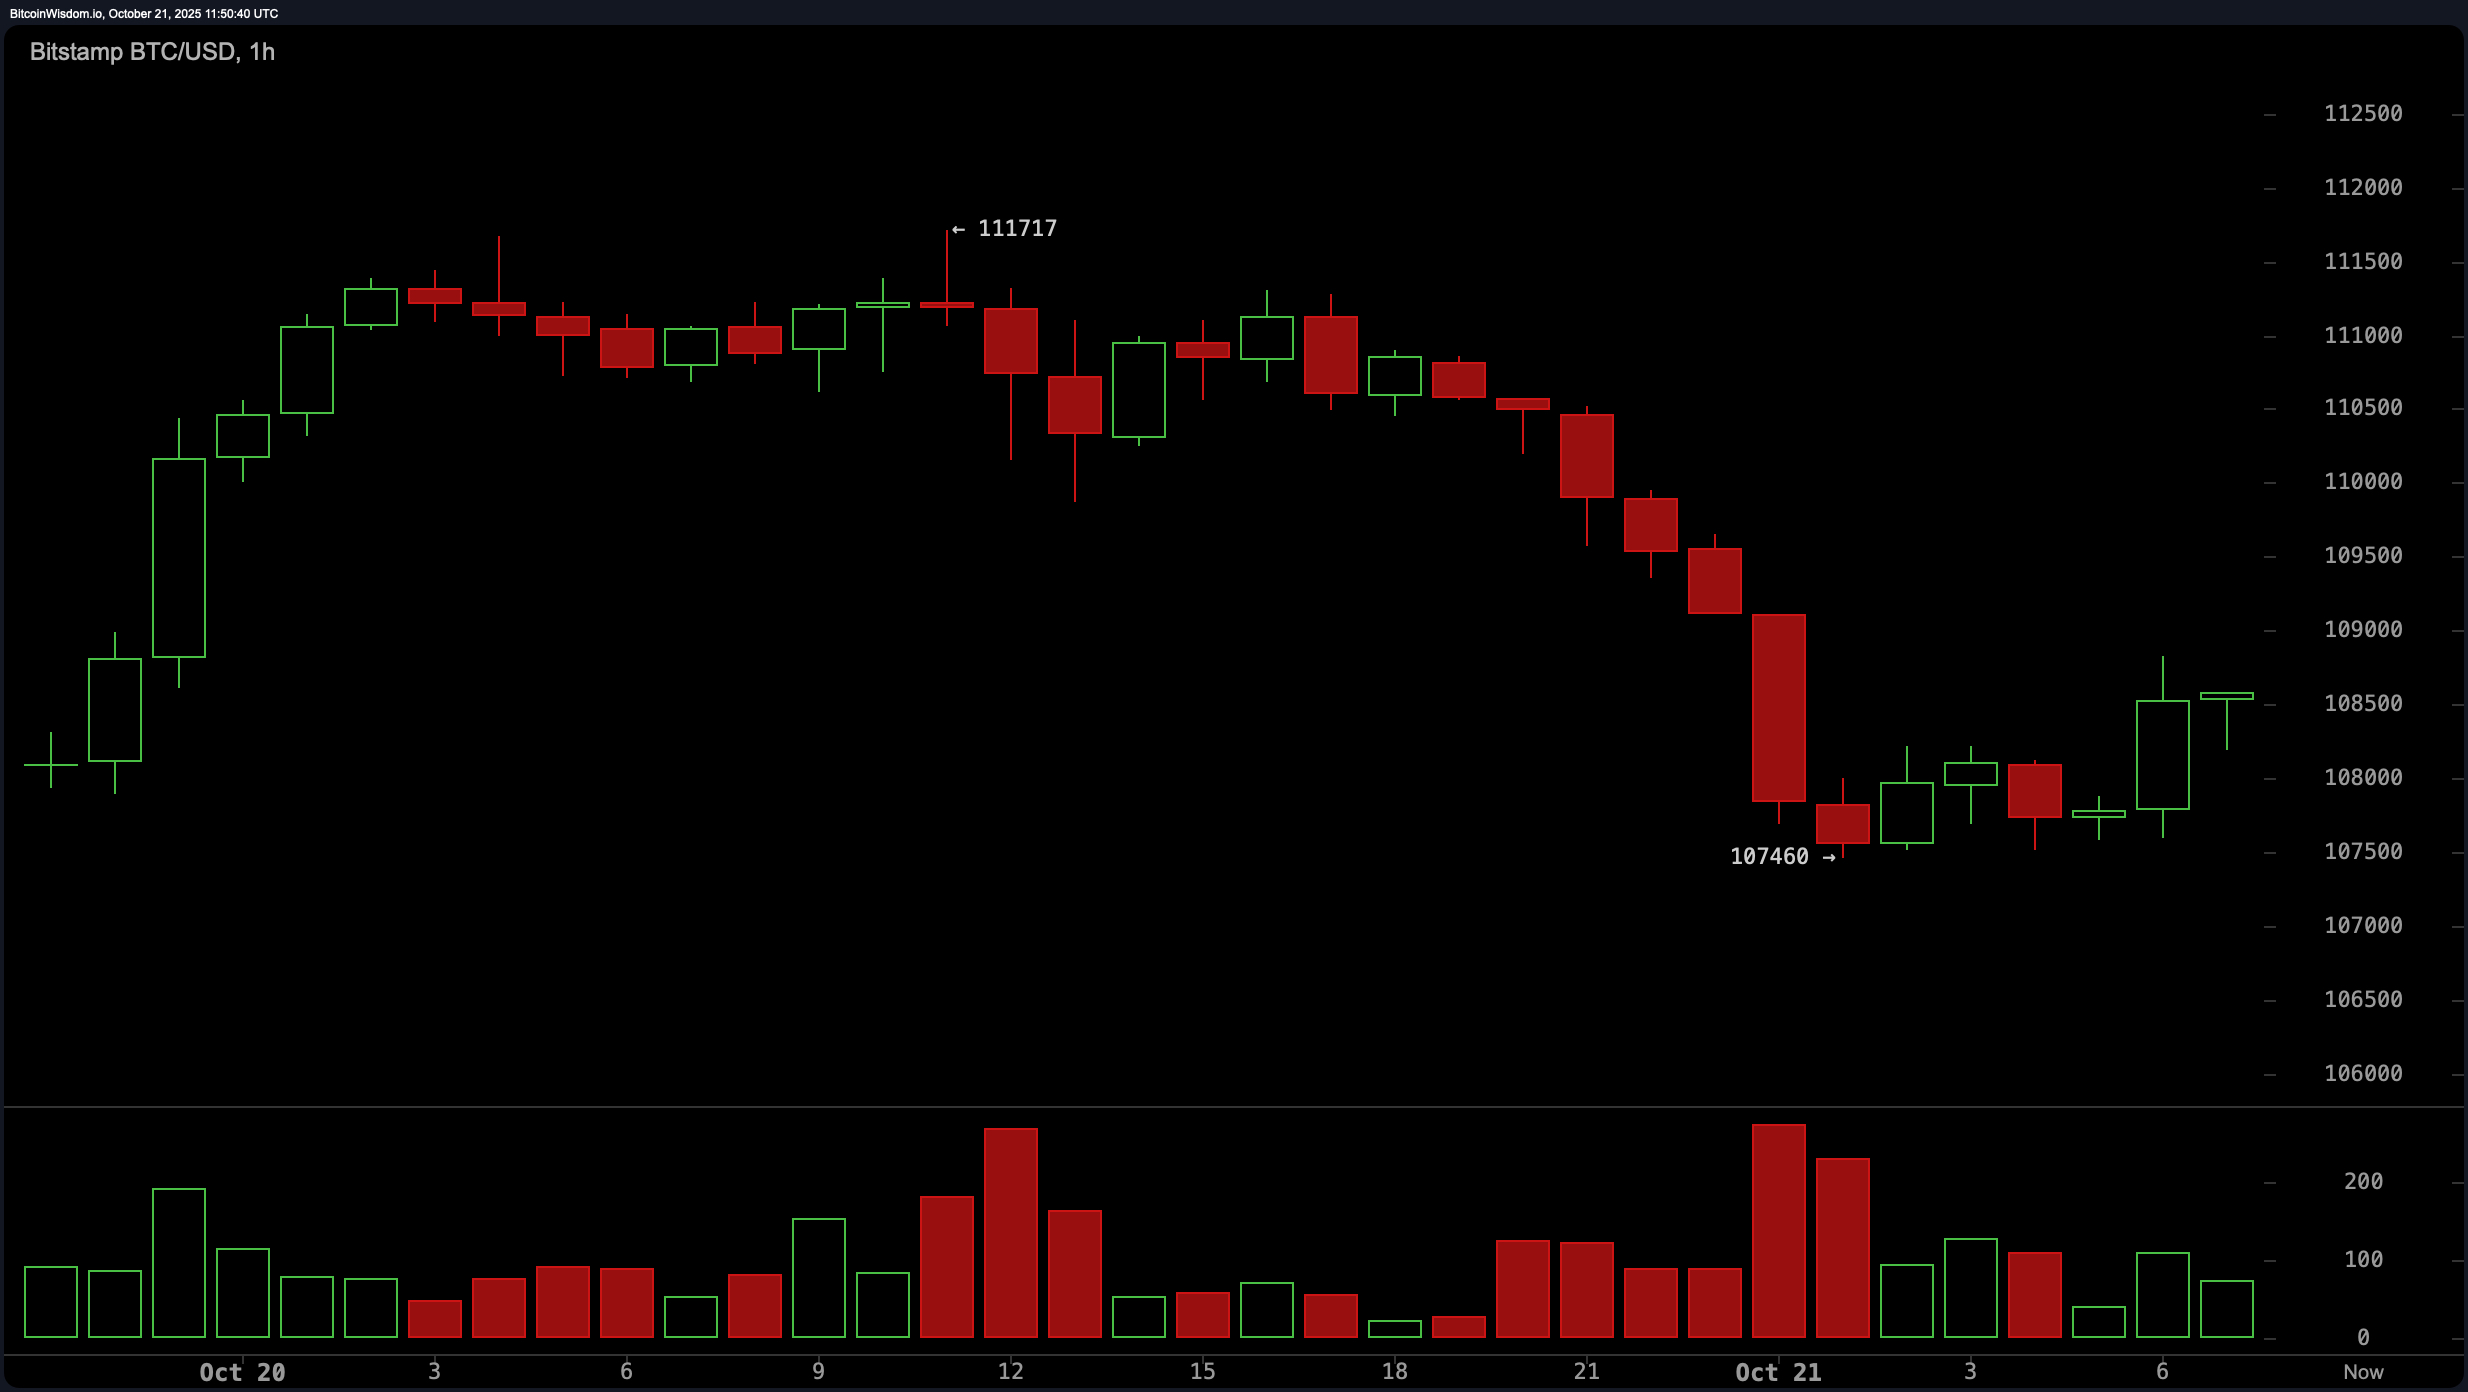
The hourly chart underscores the fragile state of bitcoin’s current recovery, as a clear pattern of lower highs and lower lows persists. While the price has rebounded modestly from $107,460, weakening volume suggests a lack of conviction. For a shift in momentum, bitcoin would need to hold above $109,500 and begin forming higher lows. The immediate resistance is observed around $110,000 to $110,500, and price failure at this level on increasing sell volume would strengthen the case for continued weakness. Short-term scalping opportunities exist between the $107,460 and $110,500 range.

BTC/USD 1-hour chart on Oct. 21, 2025, via Bitstamp.
Technical indicators offer a largely neutral picture. The relative strength index (RSI) stands at 41, while the stochastic oscillator reads 27—both neutral levels. The commodity channel index (CCI) at −78 and the average directional index (ADX) at 26 also suggest the absence of a strong directional trend. The awesome oscillator at −6,658 echoes a similarly muted outlook. While the momentum indicator registers at −2,197, implying a slight positive bias, the moving average convergence divergence (MACD) level at −2,055 signals bearish divergence. Together, these oscillators point to indecision with a mild downside bias unless trend confirmation occurs.
Moving averages (MAs) reinforce the overarching bearish context. All short- to mid-term moving averages—exponential moving average (EMA) and simple moving average (SMA) for 10, 20, 30, 50, and 100 periods—remain above the current price, confirming downward momentum. Only the 200-period exponential and simple moving averages, located at $108,104 and $108,030, respectively, offer minimal support, and these too are being tested. Until bitcoin reclaims and sustains levels above key short-term averages, upside continuation remains speculative.
In summary, bitcoin’s technical posture on Tuesday reflects a market in post-capitulation flux. The presence of possible bottoming formations is counterbalanced by subdued momentum and persistent resistance at critical levels. Traders are likely to observe key thresholds at $103,500 on the downside and $112,000 on the upside, with volume acting as a pivotal confirming factor. As volatility compresses within a tightening range, directional clarity may soon emerge, potentially reshaping short-term sentiment.
Bull Verdict:
Should bitcoin sustain levels above $109,500 and break past the $112,000 resistance with volume confirmation, the current consolidation may evolve into a recovery phase. A retest of previous highs near $116,000 could follow, signaling that the market is absorbing the recent correction and setting the stage for renewed upward momentum.
Bear Verdict:
If bitcoin fails to hold the $107,000 and $108,000 levels and breaches support at $103,500 on heightened volume, the bearish trend is likely to intensify. This would confirm a breakdown from the current structure, increasing the probability of a deeper retracement toward lower support zones, and signaling continued market weakness.
- Where is bitcoin trading now?
Bitcoin is priced at values between $108,463 and $109,421 as of October 21, 2025. - What is the current market cap of bitcoin?
Bitcoin’s market capitalization stands at $2.16 trillion. - What’s the key resistance level to watch?
The $112,000 level is acting as major resistance across all timeframes. - Is bitcoin showing signs of recovery?
Charts suggest a possible short-term bounce, but momentum remains weak.
免责声明:本文章仅代表作者个人观点,不代表本平台的立场和观点。本文章仅供信息分享,不构成对任何人的任何投资建议。用户与作者之间的任何争议,与本平台无关。如网页中刊载的文章或图片涉及侵权,请提供相关的权利证明和身份证明发送邮件到support@aicoin.com,本平台相关工作人员将会进行核查。


