Author: Frank, PANews
More than ten days have passed, but the flash crash on October 11 still leaves the market in shock. On that day, many token prices approached "zero" in a very short time, followed by violent rebounds of thousands or even tens of thousands of times, creating extreme panic in the market.
How severe was this epic crash? Which categories of tokens (Narrative) were hit the hardest? Behind the astonishing rebound data, has the market's "real" trauma recovered?
More importantly, is the widely speculated "liquidity exhaustion" the real culprit of this crisis? To clarify the truth, PANews conducted a detailed data analysis of 430 spot trading pairs on Binance from October 10 to October 20. This article will unveil the facts behind this extreme market situation through multi-dimensional data.
This data analysis uses the market conditions of 430 spot trading pairs on Binance between October 10 and October 20.
Crash and "False" Rebound: Average Instant Drop of 66%, What is the Real Market Recovery?
From the actual situation, the drastic changes in token prices on October 11 were indeed shocking. On that day, the average drop of all tokens reached 66%, with seven tokens experiencing a maximum drop of over 99%, and 32 tokens dropping more than 90%. The number of tokens with a drop exceeding 50% reached 344, accounting for 80%.
In terms of distribution, the number of tokens with a drop between 60% and 90% was the highest, totaling 272, accounting for 63.2%.
After the massive instant drop, many tokens created extremely low records in a short time, making the subsequent rebounds appear particularly exaggerated. For example, IOTX's low point rebound reached 1,230,900% (with a low point of 0.000001). Additionally, several tokens like ENJ, ATOM, and ANKR saw maximum rebounds exceeding a thousand times. There were also 22 tokens that rebounded more than ten times, making the lowest point rebound data seem somewhat detached from reality. According to PANews statistics, from the low point on October 11 to the closing on October 20, the average rebound strength of all tokens reached 5,509%.
Clearly, looking at this data alone does not represent the actual situation. Therefore, PANews further compiled another set of data, comparing the price data on October 20 with the opening data before the crash on October 11. This reflects the true decline in the market. From this real drop perspective, currently, the average drop of all tokens after rebounding compared to the price before the crash is about 17.22%, indicating that the rebound strength is still quite significant compared to the previously mentioned maximum drop of 66%. Notably, many tokens' prices even exceeded their levels before the crash after rebounding, with data showing that 26 tokens' prices surpassed the opening price on October 11.
Sector Performance Review: MEME Becomes "Disaster Zone," Indiscriminate Drop Points to Liquidity Issues
From the perspective of token categories, are there different results?
First, let's focus on the performance of public chains.
Layer 1 public chains had an average maximum drop of about 63% on October 11, which does not show a significant advantage compared to the overall drop. In the comparison of prices after the rebound on October 20 with the opening data before the crash on October 11, the overall drop level of Layer 1 tokens was 19%, clearly underperforming the overall level. This indicates that Layer 1 public chains did not remain resilient in this round of decline as they have in the past, but instead experienced a larger drop.
Layer 2's performance was similar to Layer 1, with an average maximum drop of 65.8%, and the drop from the opening on October 11 to October 20 was about 17.98%, also below the average level.
Overall, DeFi and AI category tokens performed better than the average level. First, in terms of average maximum drop, these two categories were roughly on par with the overall level, with AI category tokens having an average maximum drop of about 63%, better than the overall level. In terms of the drop from the opening on October 11 to October 20, DeFi tokens showed a data drop of 14%, indicating that DeFi tokens had a stronger rebound effect than the overall level.
Among all categories, MEME tokens performed the worst, with an average maximum drop of 78%, becoming the most volatile token category at that time. Additionally, compared to the opening price on October 11, the price level as of October 20 also saw a drop of 20%, indicating insufficient rebound energy. Considering the historical performance of previous extreme market situations, MEME tokens consistently carry a high risk factor, and their market fragility is amplified whenever they encounter such volatile conditions.
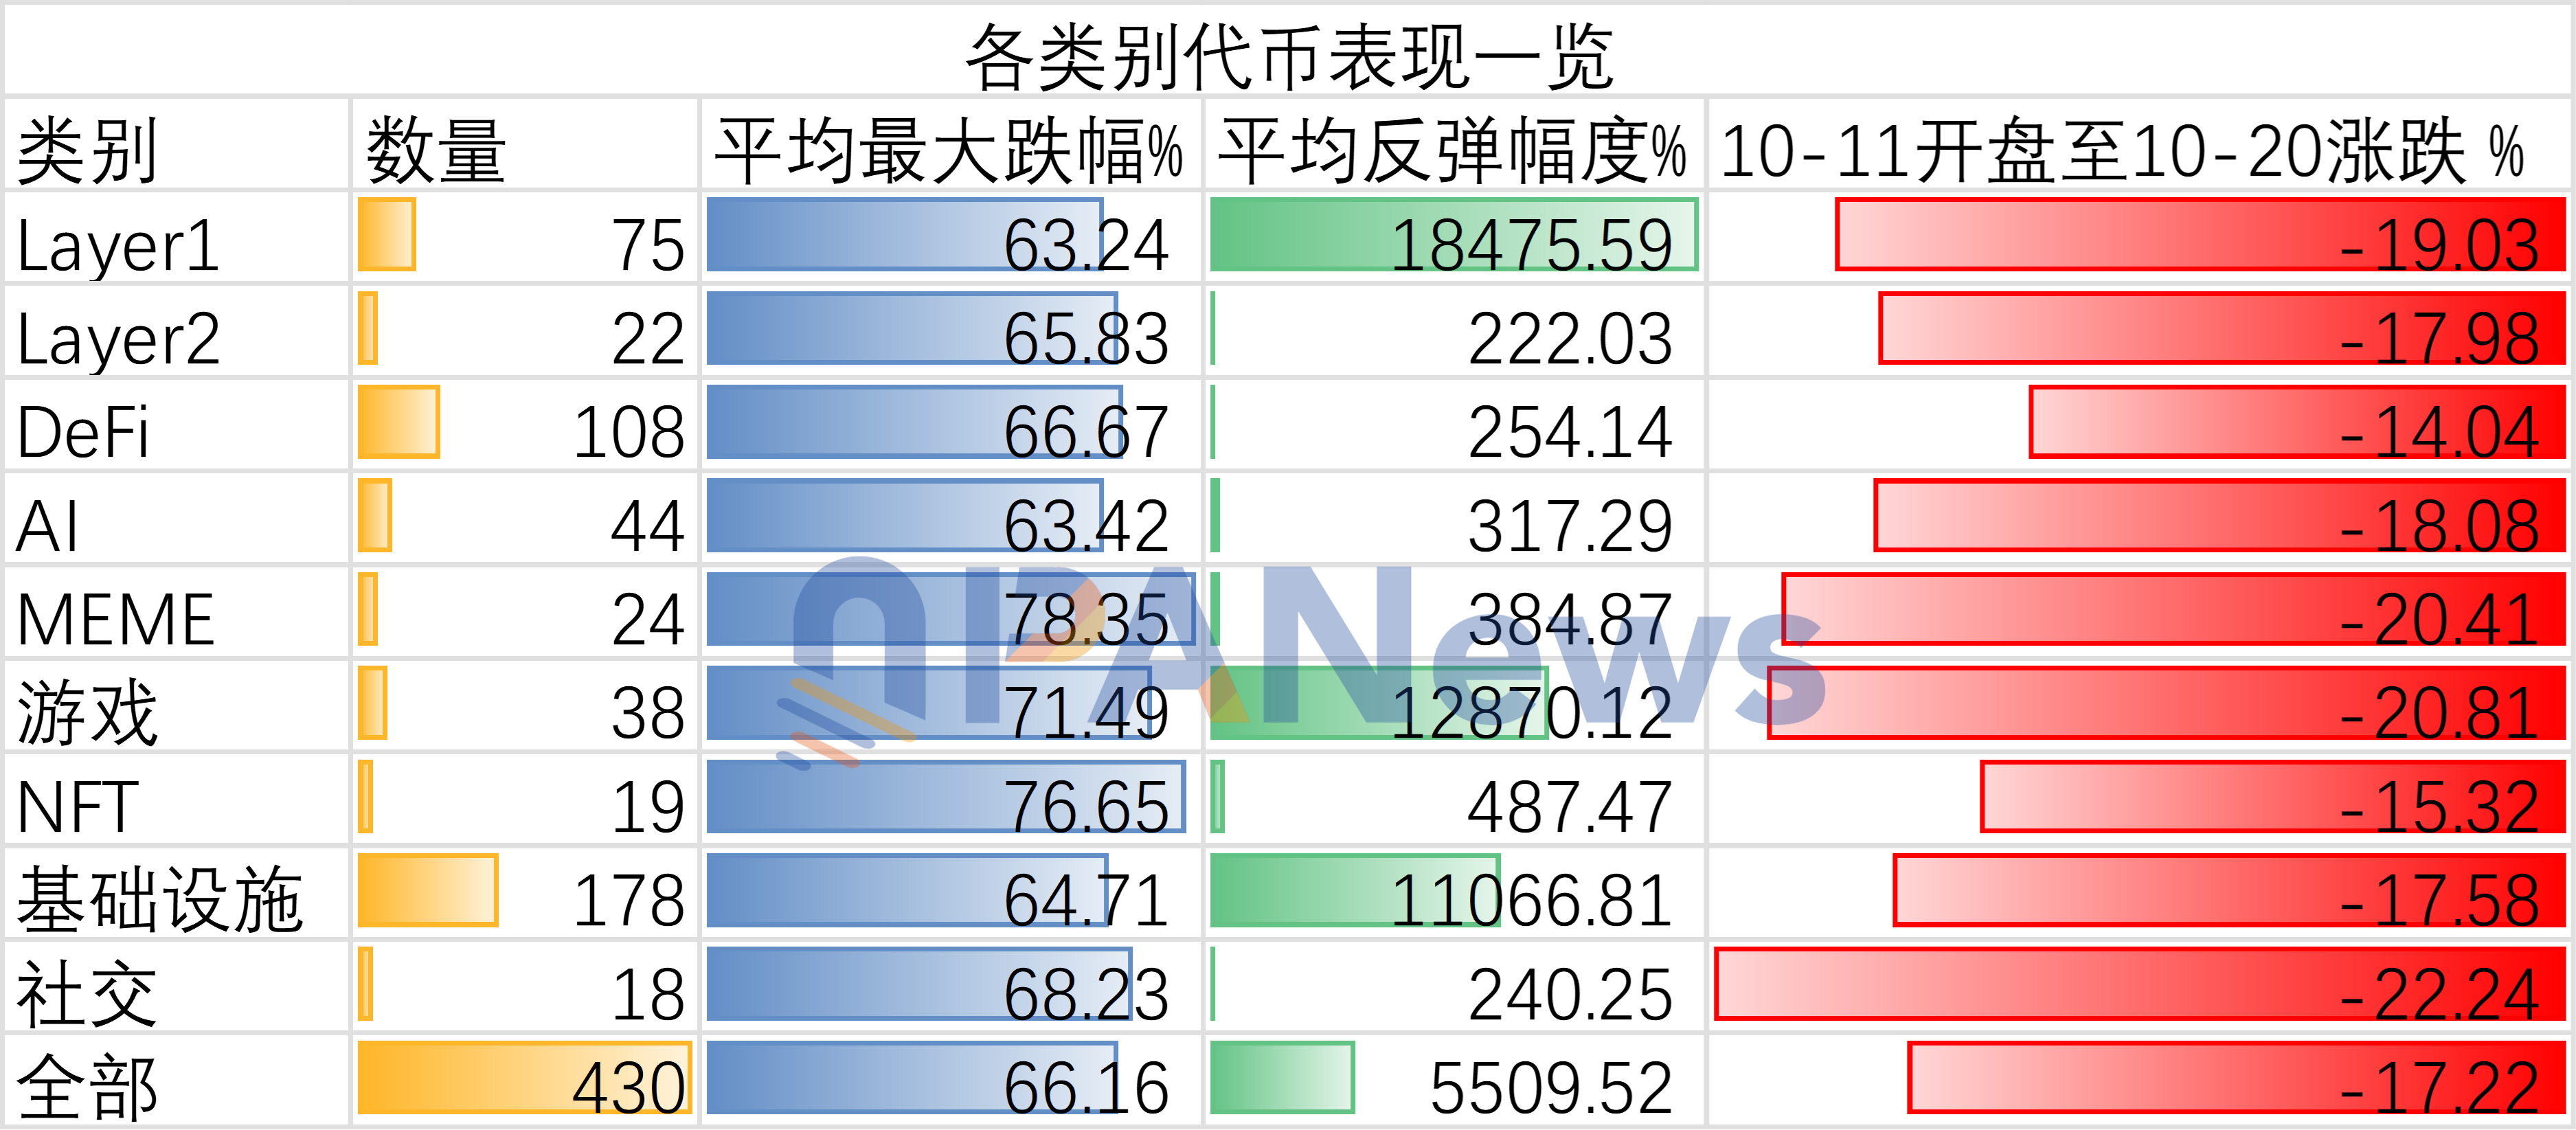
Overall, from the perspective of categories, this crash exhibited almost indiscriminate results, with no category standing out during this round of decline, and the subsequent rebounds also remained at relatively similar levels. From this point of view, the previous market speculation that this crash was triggered by liquidity issues seems to have some basis.
Seeking the "True Culprit": Trading Volume Reveals Strong Correlation Between Liquidity and Decline
To verify whether there is a direct correlation between liquidity and the crash on October 11, PANews conducted further analysis of the liquidity data of these tokens. Taking the bid-ask spread as an example, tokens with a drop of less than 20% on October 11 had an average bid-ask spread of about 0.11%, while tokens with a maximum drop between 70% and 80% had an average bid-ask spread of about 0.13%.
However, this data seems to have limitations, as among tokens with drops exceeding 90%, the bid-ask spread was as low as 0.07%. The reason for this phenomenon may be that after the crash, exchanges actively increased liquidity for these tokens that experienced greater volatility that day. (Bid-ask spread data is sourced from October 20 data)
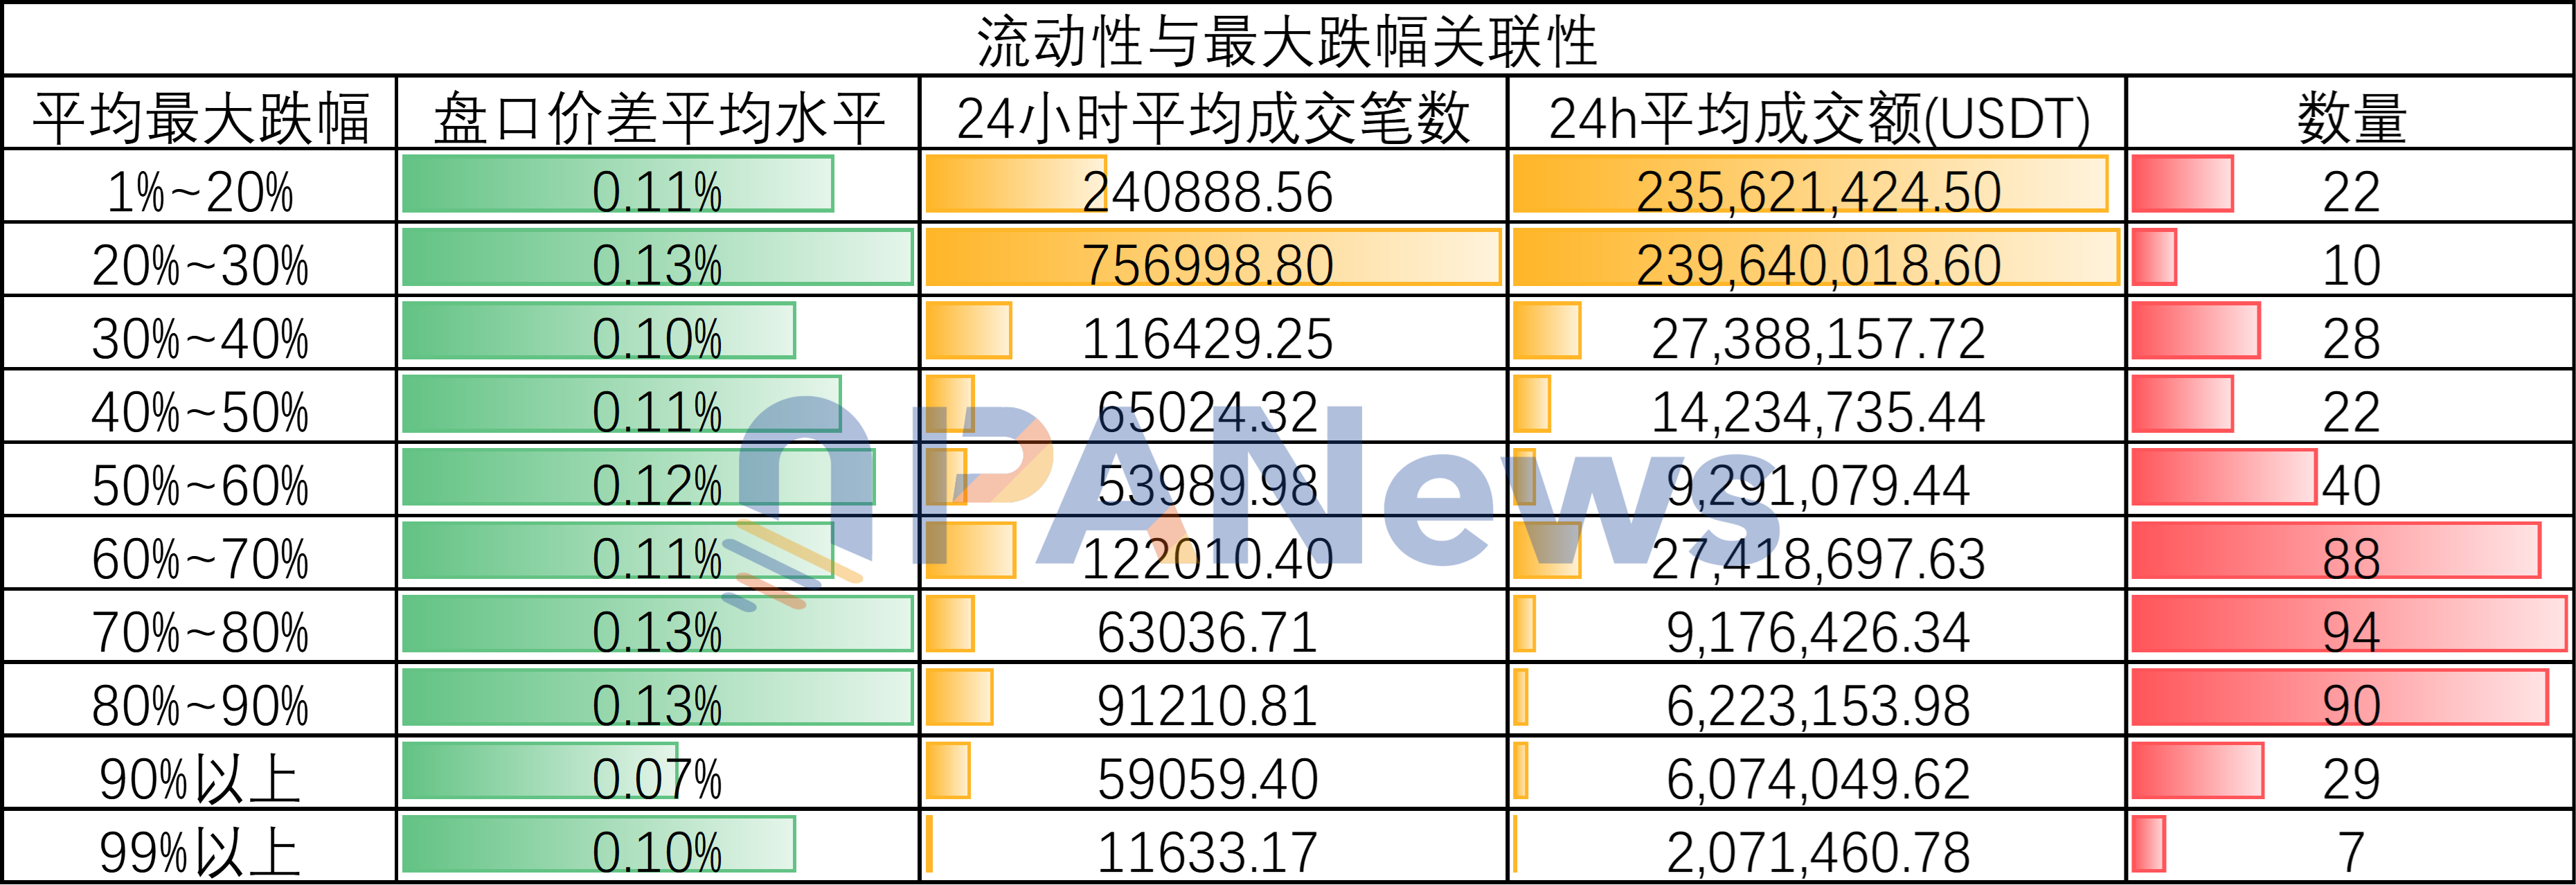
In another set of data, the correlation between liquidity and this crash was still revealed. According to PANews statistics on average transaction counts and average trading volumes, tokens with higher average transaction counts and trading volumes experienced smaller fluctuations during the crash on October 11.
In particular, tokens with a drop between 20% and 30% had an average of 757,000 transactions in 24 hours, with an average trading volume reaching $239 million. In contrast, tokens with drops exceeding 90% had an average of only 59,000 transactions in 24 hours, with an average daily trading volume of only about $6 million. Tokens with drops exceeding 99% showed even more pronounced performance in this regard, with an average daily transaction count of only 11,600 and a daily trading volume of only about $2 million. Compared to tokens with drops of less than 30%, the trading volumes of these tokens differed by a hundredfold.
In contrast, transaction counts and trading volume data can better reflect market demand. Thus, it appears that this epic crash is directly related to liquidity issues.
How is the Market's Vitality Recovering?
After the crash, exploring the subsequent direction may be more worthy of attention.
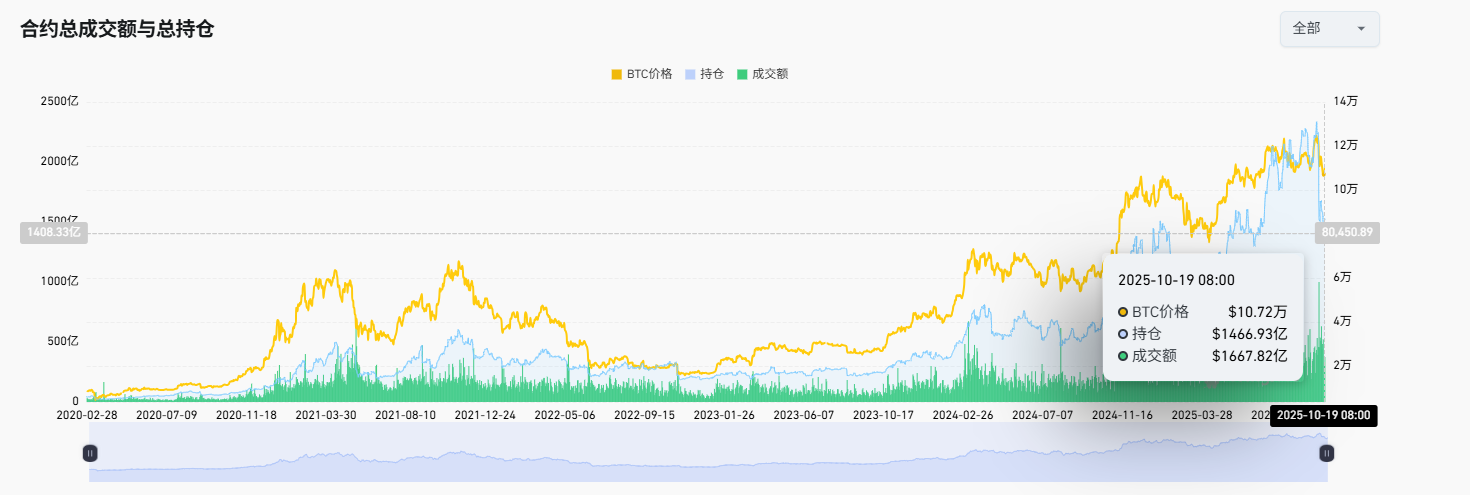
First, from the perspective of contract open interest, the overall contract open interest in the market saw a significant decline following the crash. According to Coinglass data, on October 8, the total amount of open contracts in the market reached a historical high of $233.5 billion, but by October 19, this figure had dropped to $146.6 billion, a decrease of 37%.
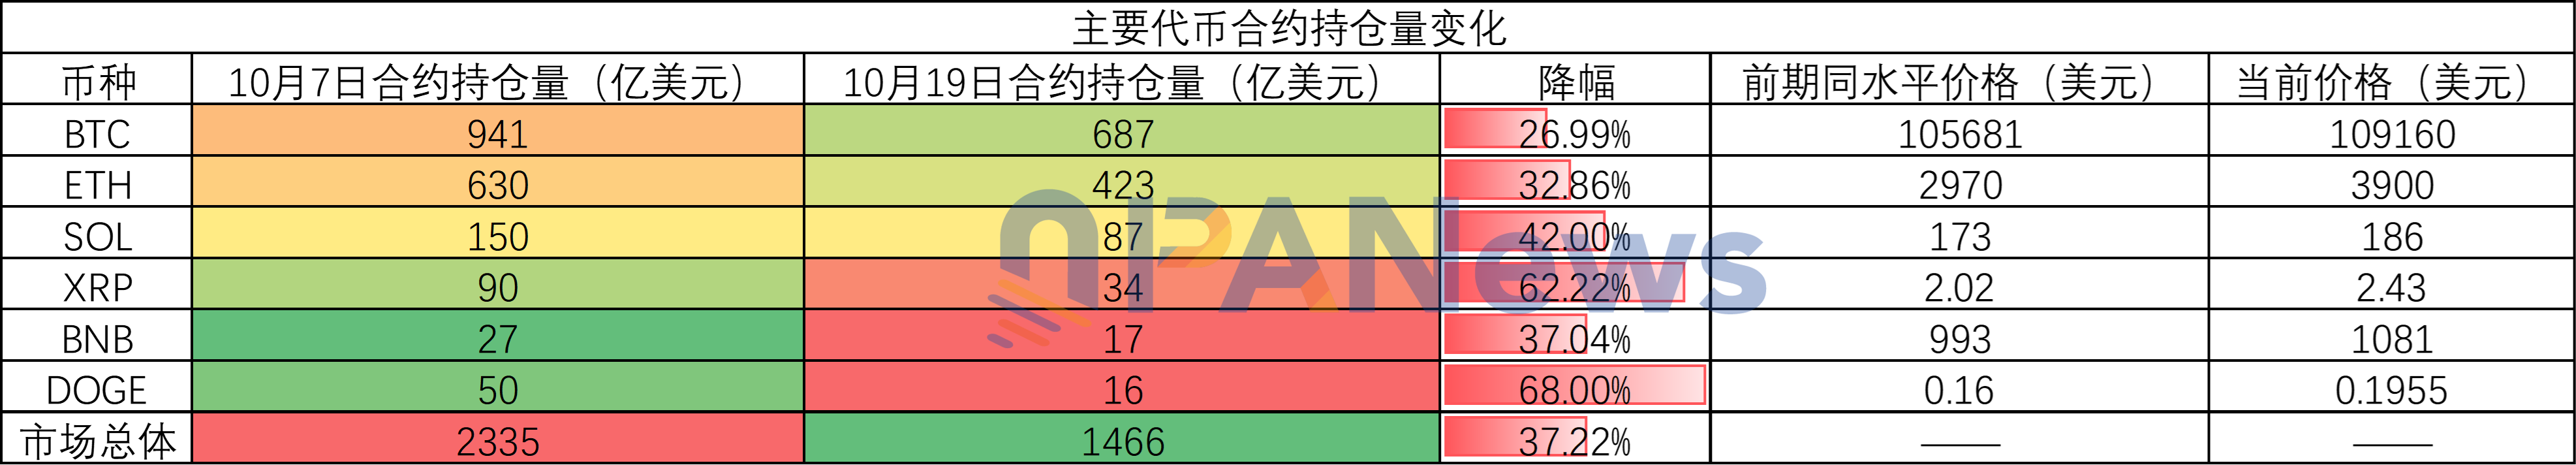
This change in open interest was even more pronounced in some mainstream altcoins. For example, the open interest for XRP and DOGE both fell by over 65%. On one hand, this decline in open interest indicates that the market has resolved the issue of excessive leverage in a short time following this major cleanup. On the other hand, the significant drop in contract open interest also reflects the market's uncertainty about future trends and a state of wait-and-see. If this state persists for a long time, it may indicate that the market is entering a period of calm.
Additionally, regarding the fear index, the fear index during this period fell below 40 again but remained above 20, indicating that the market has not completely entered extreme fear.
In terms of stablecoin data, the issuance has not been interrupted by market panic, reaching $307.6 billion as of October 21, continuing to set new highs. According to CoinDesk, Citigroup is optimistic about stablecoins driving the next round of growth in cryptocurrencies.
In summary, the market crash on October 11 was both an indiscriminate slaughter of the market and an inevitable result of prior market overheating. Through in-depth research on this unusual crash, we may gain several insights. On one hand, the ultimate culprit of this flash crash is indeed insufficient liquidity. On the other hand, it is also closely related to the market's excessive leverage.
On the positive side after the crash, this high leverage has been forcibly unwound, reducing resistance to future upward movements (if a bull market continues). On the pessimistic side, the market may suffer severe damage and struggle to recover or require a long time to mend. However, regardless of the situation, the greatest warning we can take from this is that choosing assets with better liquidity is always the best choice to mitigate risk.
免责声明:本文章仅代表作者个人观点,不代表本平台的立场和观点。本文章仅供信息分享,不构成对任何人的任何投资建议。用户与作者之间的任何争议,与本平台无关。如网页中刊载的文章或图片涉及侵权,请提供相关的权利证明和身份证明发送邮件到support@aicoin.com,本平台相关工作人员将会进行核查。