Yesterday we mentioned that the market surged and then retreated, with the bulls missing the last opportunity for an upward attack. Today the market is in an upward state, but we see signs of a potential trap for the bulls, so we should approach this with caution.
From the MACD perspective, the energy bars continue to retract, and the fast line is turning upward. However, it is best to wait for the fast line and slow line to complete a golden cross before being bullish.
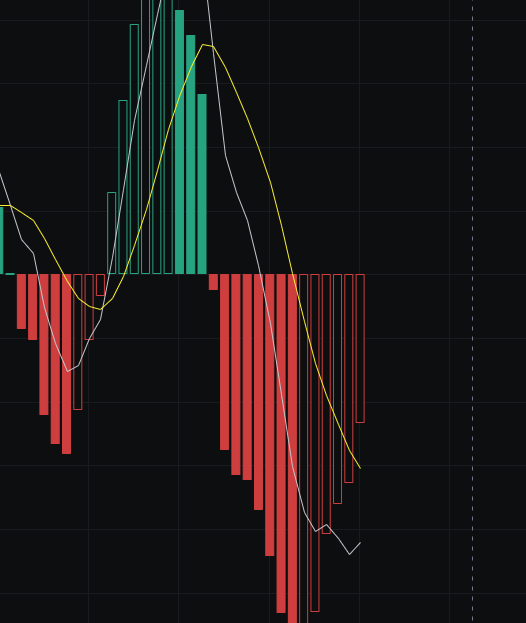
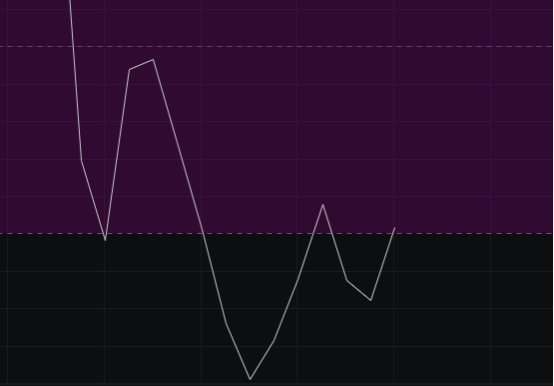
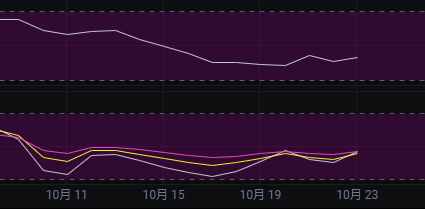
From the CCI perspective, although the CCI has rebounded, it is still a bit far from the zero line. If the market cannot maintain consecutive positive candles or a large bullish candle, the CCI will not return to the zero line in the short term.
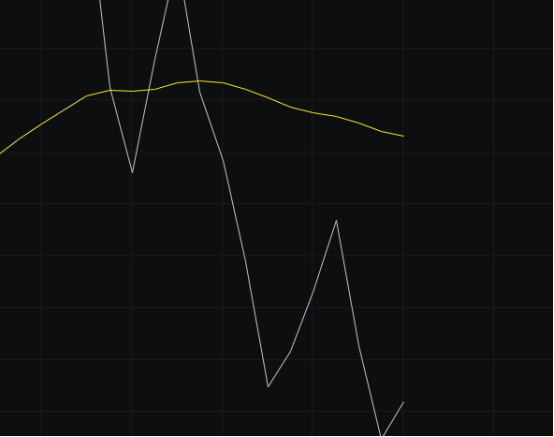
From the OBV perspective, the volume continues to decline, and the slow line is also pressing down, so we still maintain a bearish outlook here.
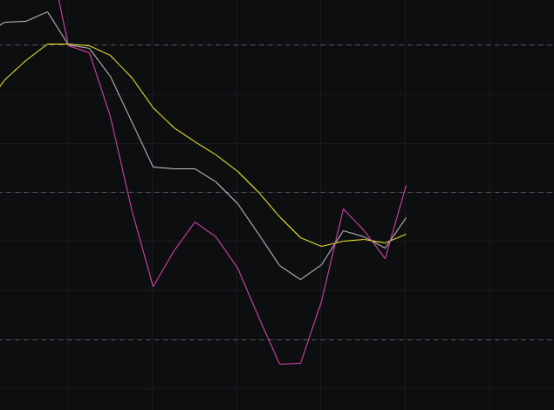
From the KDJ perspective, the KDJ has formed two consecutive golden crosses and is diverging upward. The KDJ is favorable for the bulls, so those shorting here should set appropriate stop losses.
From the MFI and RSI perspectives, both indicators are consolidating in a weak zone and have not made a directional choice, so we continue to wait for a direction to be chosen.
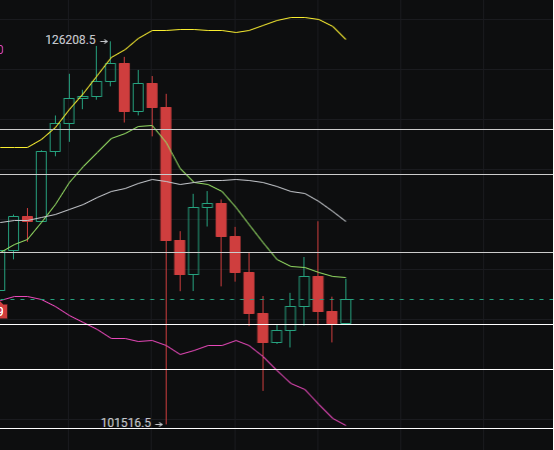
From the moving averages perspective, the 30-line and 120-line have completed a death cross, indicating a bearish outlook in the larger cycle. Additionally, today the price surged to the BBI but did not stay above it, so we suspect there may be a trap for the bulls.
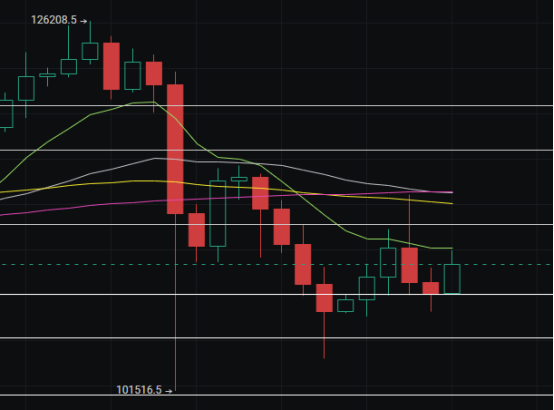
From the Bollinger Bands perspective, it is currently still operating within a downward channel. Since the downward channel has just formed, it would be best if today also closes with a bearish candle to solidify the downward channel. If this happens, the likelihood of a decline will increase.
In summary: Although the market is rising, we see signs of a potential trap for the bulls. If you want to chase the bullish trend, make sure to set a stop loss. The resistance is seen at 110500-112000, and support is at 107500-105000.
免责声明:本文章仅代表作者个人观点,不代表本平台的立场和观点。本文章仅供信息分享,不构成对任何人的任何投资建议。用户与作者之间的任何争议,与本平台无关。如网页中刊载的文章或图片涉及侵权,请提供相关的权利证明和身份证明发送邮件到support@aicoin.com,本平台相关工作人员将会进行核查。