Master Discusses Hot Topics:
The focus these past few days has undoubtedly been on the negotiations between Dongda and the Americans. With the news coming out, it can basically be confirmed that the 155% tariff set for November 1st will be postponed, allowing the market to finally catch its breath.
The capital's instinct is always faster than its words; Bitcoin surged by two thousand dollars over the weekend and continued to rise overnight. The current situation can be summarized as the bad news has been fully priced in, and good news is starting to materialize.
What remains is to wait for the pile of data to be released on October 30th and see how the market reacts. URPD data shows that the chip structure is very healthy, providing solid support. In other words, the probability of Bitcoin dropping in the short term is low.
More importantly, this week is not a calm one. The FOMC interest rate decision and MSTR's Q3 financial report are both set to be released, and together they are definitely major events. Personally, I believe Bitcoin is very likely to make a statement around 116K in the next couple of days; it's just a matter of time.
The surge early this morning has already formed an almost equal height double top structure near 116K, which has completely turned 116K into a liquidity magnet. Here, it will either break through and accelerate or be washed out and hammered down.
If it can break through decisively, the upper space will be completely opened up. However, if there are signs of stop-loss hunting around 116K, the probability of a subsequent pullback will increase.
The target range for the previous market was at 116K, with the main support still at 107K. A drop below that would lead to a look at 102K, but currently, the market is moving upward. Many people ask what to look for next; my view is straightforward: I do not expect a direct breakthrough of 120K, as the probability is very low.
The main theme of the market remains oscillation, not a major upward wave. The range from 116K to 120K is a key resistance area; it may spike up, but it is difficult to break through in one go. If 120K is indeed breached, I will admit I was wrong. I neither catch falling knives nor chase after prices.
Currently, there are three to five days of upward space on the daily chart. After reaching a peak, if it coincides with a rate cut, there is expected to be a few days of slight adjustments before continuing to rise.
Looking at Ethereum, it is indeed quite strong. A single bullish candle has pierced through three levels, showing immense strength. As soon as the talks ended yesterday, it broke through 4000 directly from 3950. Today, it has reached above 4200 almost without a pause. Shorts around 4100 have been cleared out, and now we are looking at the range of 4300 to 4350.
The movement is very standard; after the golden cross in the Vegas tunnel, there have been three retests, a typical precursor to an explosion. The short-term 4-hour chart has already broken through, with upper pressure around 4255, which is the 0.382 retracement resistance.
As long as the pullback does not drop below 4100, continuing to look bullish is reasonable. Personally, I judge that Ethereum should at least push up to 4380 to 4400; going against the trend now is purely asking for trouble, except for ultra-short-term trades.
Master Looks at Trends:
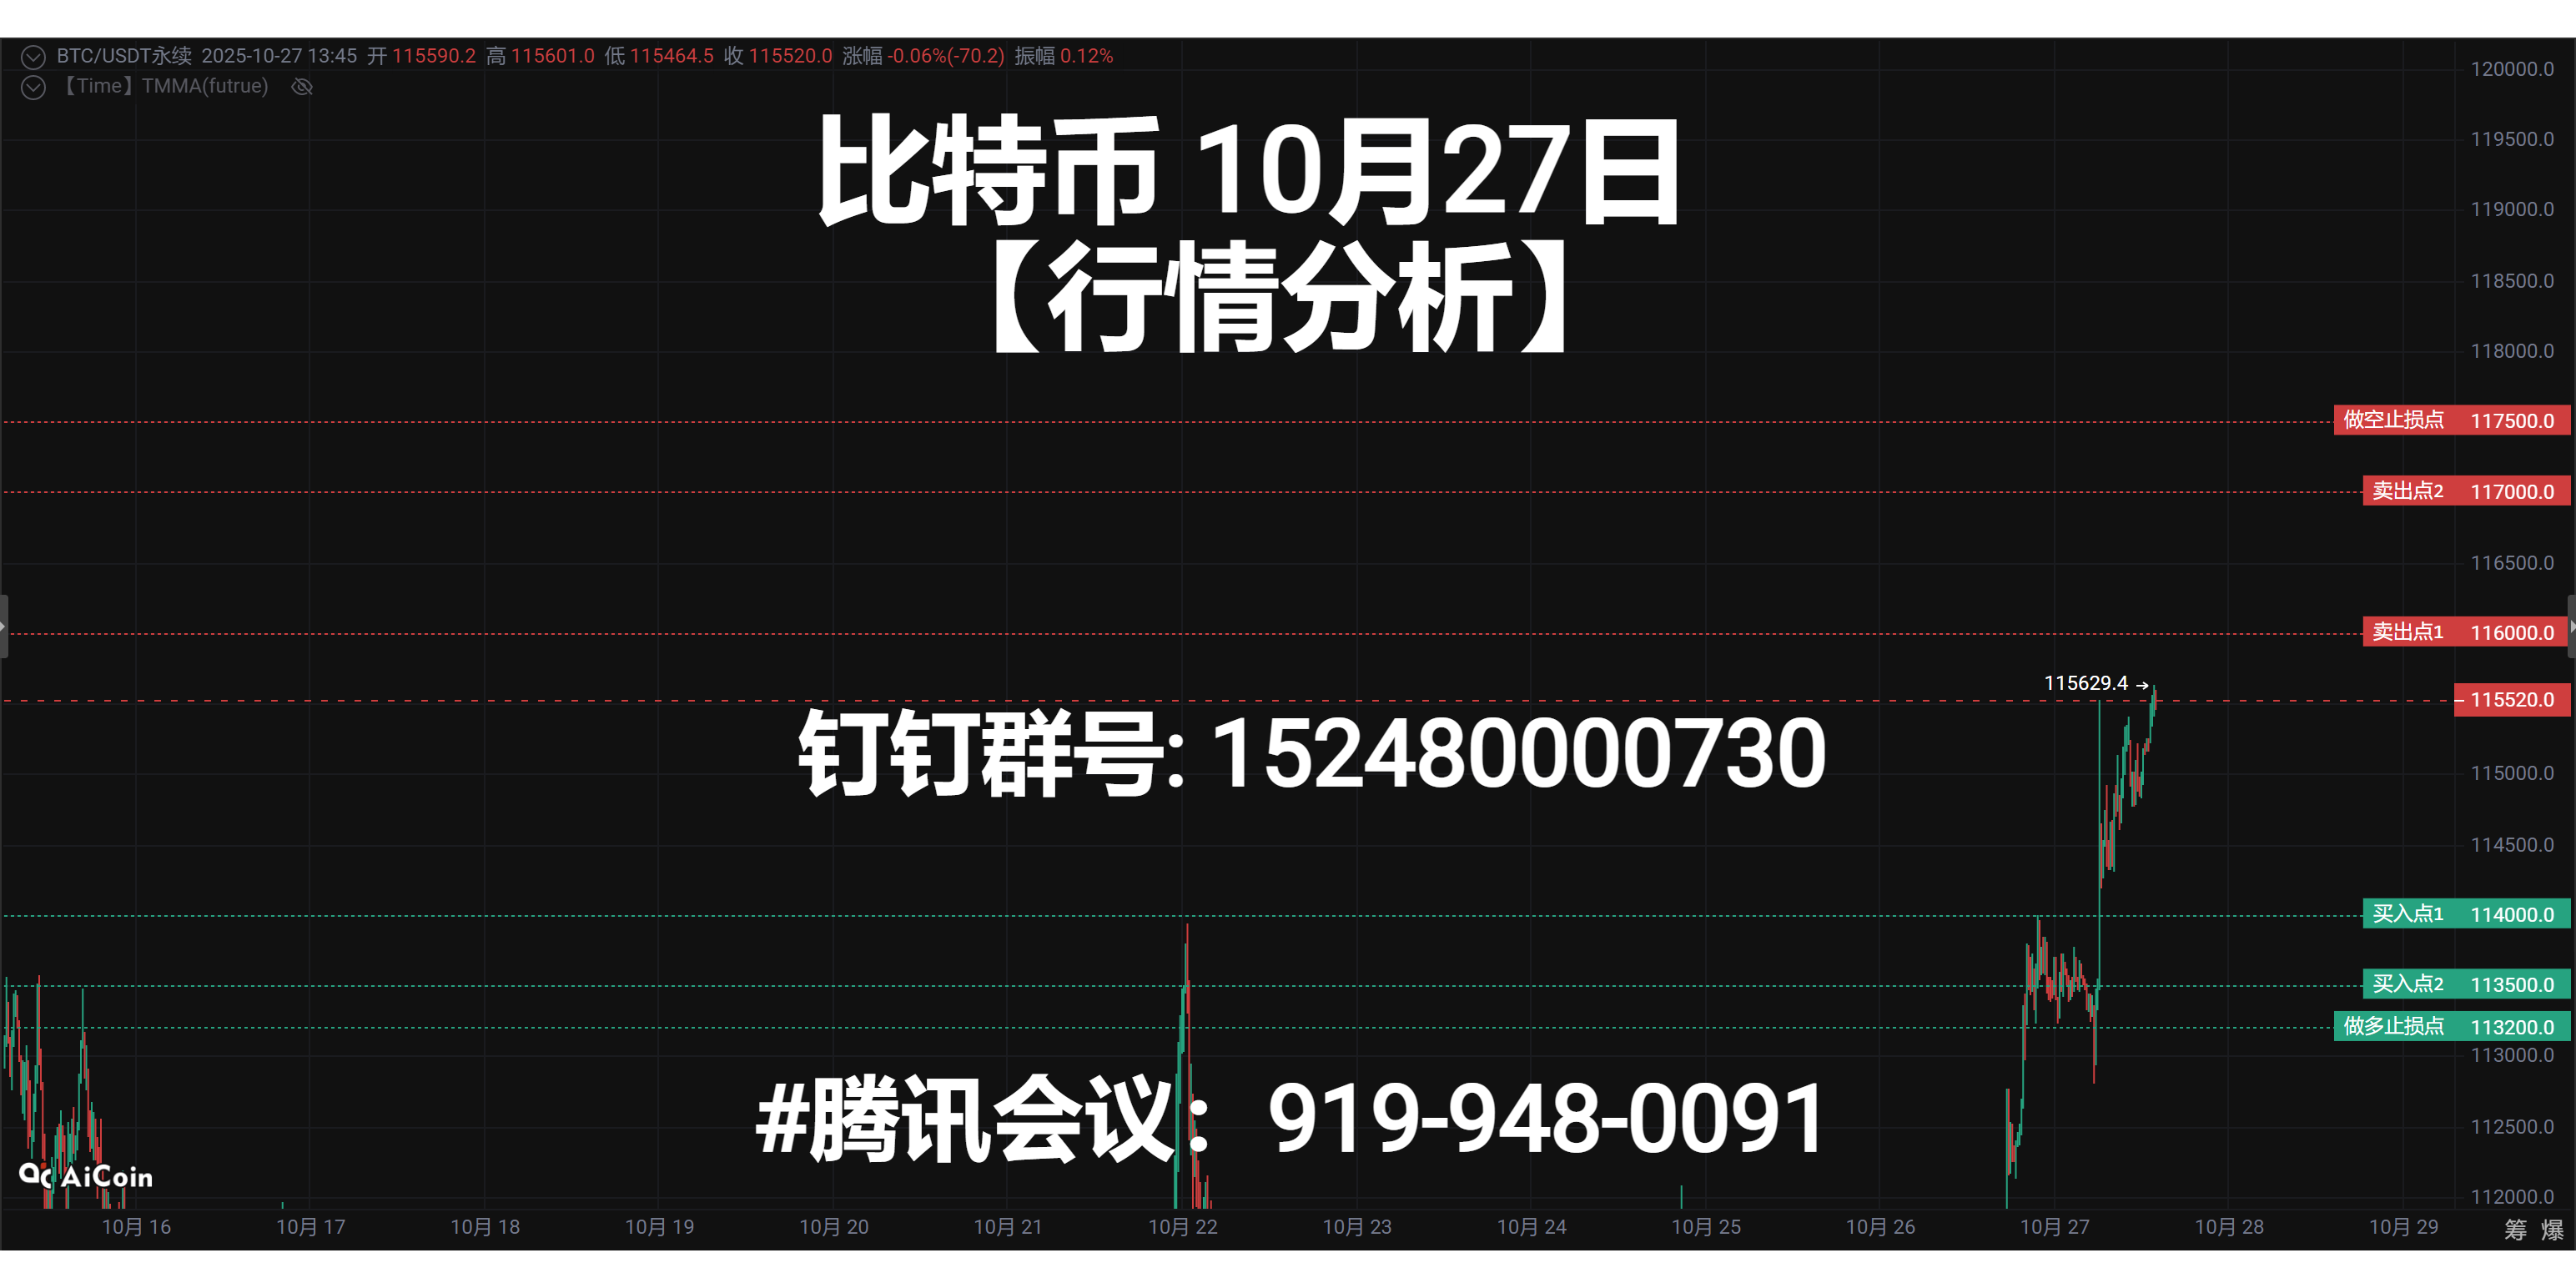
Resistance Level Reference:
Second Resistance Level: 116400
First Resistance Level: 115400
Support Level Reference:
First Support Level: 114300
Second Support Level: 113400
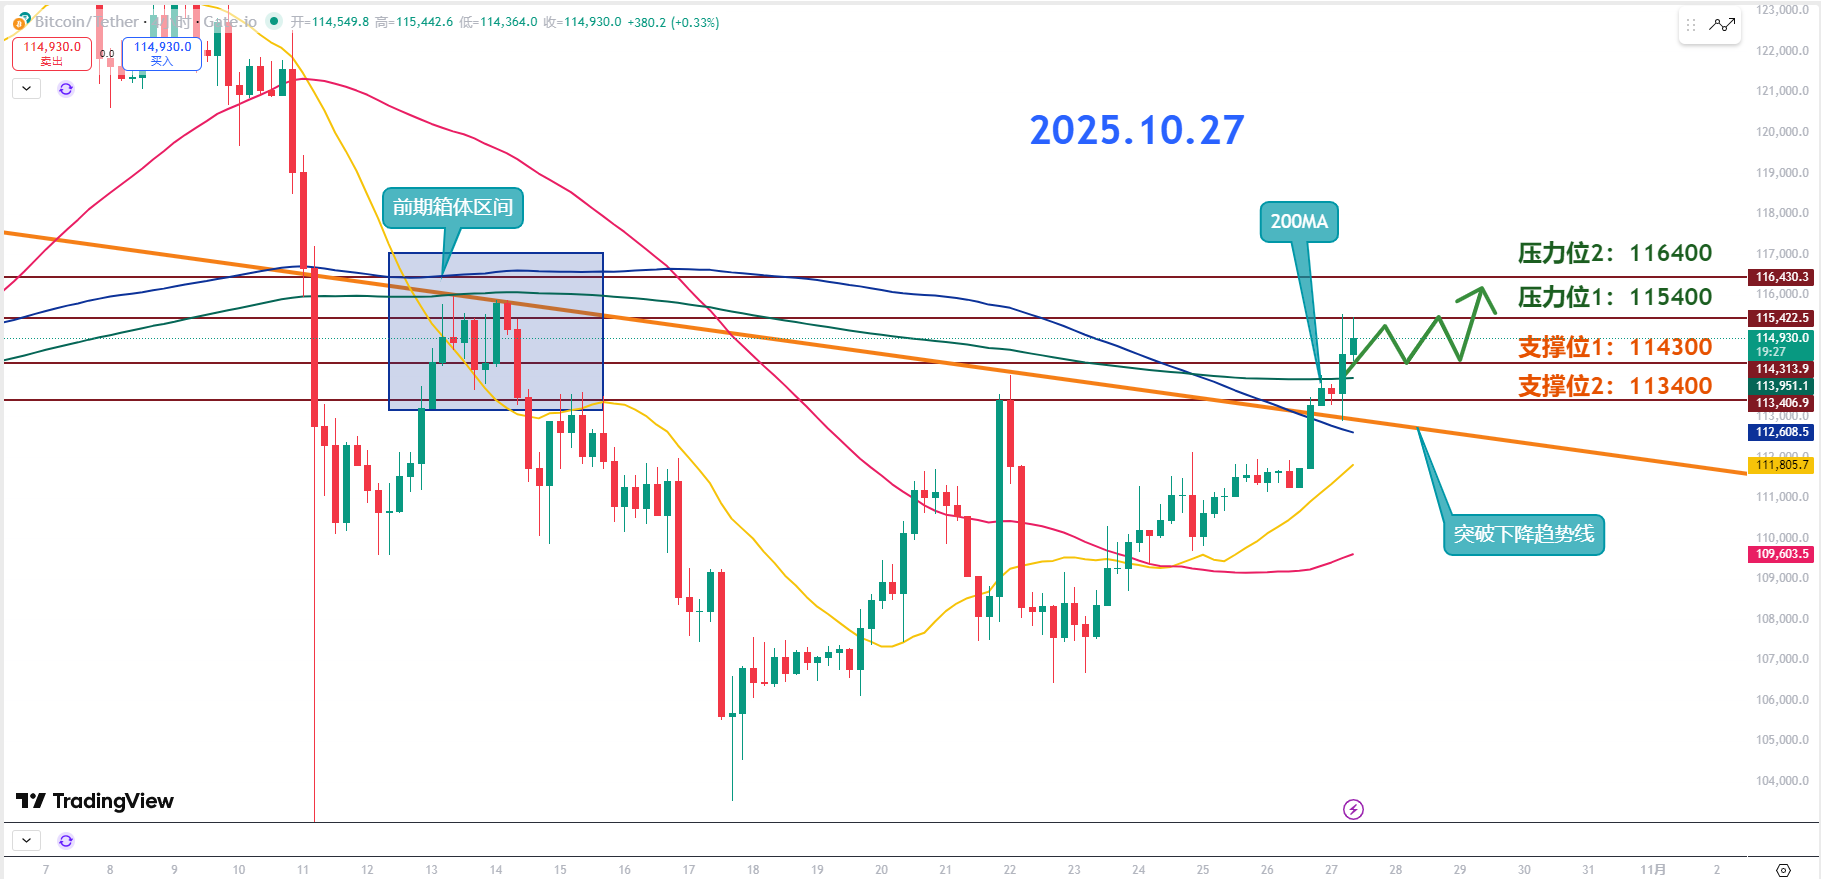
The downward trend line on the 4-hour level has been completely broken, which means the market has officially entered a trend reversal phase. The bearish trend has temporarily ended, and the bulls have regained control.
The current focus is on the 200MA at the 4-hour level; as long as it is not broken, this rebound will be stable. 115K is a key retest confirmation area; only if it effectively holds above 115.2 to 115.3K can the market have a chance to continue rising.
Short-term support is at 114.3K; if it stabilizes around that area, the bullish pattern will remain unchanged. The strong resistance above at 116.4K is the previous high; if it rushes up to that level, there may be a brief pullback. A conservative approach would be to wait for a retest before entering.
If it can consolidate in the range of 114.3K to 115.4K before rising again, that would be a truly healthy upward movement. The first resistance at 115.4K, once broken, will need to see if 115.2 to 115.3K can hold. As long as it stabilizes, it indicates that the support at 115K is officially established, and the market will then enter a step-up phase.
The second resistance at 116.4K is a high-risk area for short-term trades; do not fantasize about a massive surge. When rebounding to this area, taking profits in batches is the rational operation. Don’t think about capturing the entire move; learn to secure profits while climbing, as controlling risk is key.
The first support level at 114.3K is the bulls' bottom line; as long as this position holds, the market remains bullish. If it can successfully break through 115K next, stop-loss and position ranges can be gradually adjusted to form a good risk-reward structure.
The second support level at 113.4K, if the price falls back to this level, indicates that the bears are regaining strength. At this point, one should not push against it; observe whether the 200MA can still provide support. If the moving average holds, the bullish pattern is still intact. If it breaks, do not fight against it.
Since the downward trend has been broken, it means the market has completed its reversal. The rebound logic is still maintained, but there is still resistance above, so it is not advisable to blindly chase after bullish positions. Wait for a retest instead of buying at high levels.
10.27 Master’s Band Strategy:
Long Entry Reference: Accumulate in the range of 113400-114000, Target: 115400
Short Entry Reference: Not currently applicable
If you truly want to learn something from a blogger, you need to keep following them, rather than making hasty conclusions after just a few market observations. This market is filled with performers; today they screenshot long positions, and tomorrow they summarize short positions, making it seem like they "catch every top and bottom," but in reality, it’s all hindsight. A truly worthy blogger will have a trading logic that is consistent, coherent, and withstands scrutiny, rather than jumping in only when the market moves. Don’t be blinded by flashy data and out-of-context screenshots; long-term observation and deep understanding are necessary to discern who is a thinker and who is a dreamer!
This content is exclusively planned and published by Master Chen (WeChat public account: Coin God Master Chen). For more real-time investment strategies, solutions, spot trading, short, medium, and long-term contract trading techniques, and knowledge about candlesticks, you can join Master Chen for learning and communication. A free experience group for fans has been opened, along with community live broadcasts and other quality experience projects!

Warm reminder: This article is only written by Master Chen on the official account (as shown above); other advertisements at the end of the article and in the comments section are unrelated to the author! Please be cautious in distinguishing between true and false, and thank you for reading.
免责声明:本文章仅代表作者个人观点,不代表本平台的立场和观点。本文章仅供信息分享,不构成对任何人的任何投资建议。用户与作者之间的任何争议,与本平台无关。如网页中刊载的文章或图片涉及侵权,请提供相关的权利证明和身份证明发送邮件到support@aicoin.com,本平台相关工作人员将会进行核查。