The monthly closing of Bitcoin has reached an all-time high, while it has also plummeted near 100,000. It has been oscillating above 100,000 for four consecutive months. If we consider the time since it first touched 100,000, it has been a year. The US stock market, gold, the Nikkei index, and the Korean composite index have all reached historical highs, while Bitcoin has been moving sideways for a year. Therefore, many people in the market are bearish. My view remains the same: if it falls below 100,000 and fails to rebound, then we can consider it a bear market. For now, it continues to oscillate at high levels.
In 2024, it has also taken nearly a year to break through the previous bull market's high. If the current market can create a new historical high, then structurally, Bitcoin's setup is very solid, and reaching 200,000 or 300,000 cannot be ruled out. However, if 100,000 is broken by a large bearish candle, then whether on a weekly or monthly basis, an M-top will appear, increasing the chances of a bear market.
From the naked K chart perspective, this week is likely to close with a bearish candle, forming an engulfing pattern at the historical high along with a double bearish and single bullish pattern, which is bearish; Ethereum is similar, having formed a double bearish and single bullish pattern for six consecutive weeks.
Bitcoin's weekly MACD continues to stay below the zero axis, with the fast and slow lines continuing to decline, and the K-line has not yet regained the MA20.
The daily line is still testing the support near MA200 and has formed a triangular structure.
Currently, the rebound at 116,000 has not broken through the neckline resistance, and the 100,000 level has long been considered the dividing line between bulls and bears by seasoned investors. A break below this level would significantly increase the probability of a bear market; if it can break through 116,000, there is still a chance for a rebound.
● Support: 101516—103000—106000

● Resistance: 116000—118600—121000

Ethereum
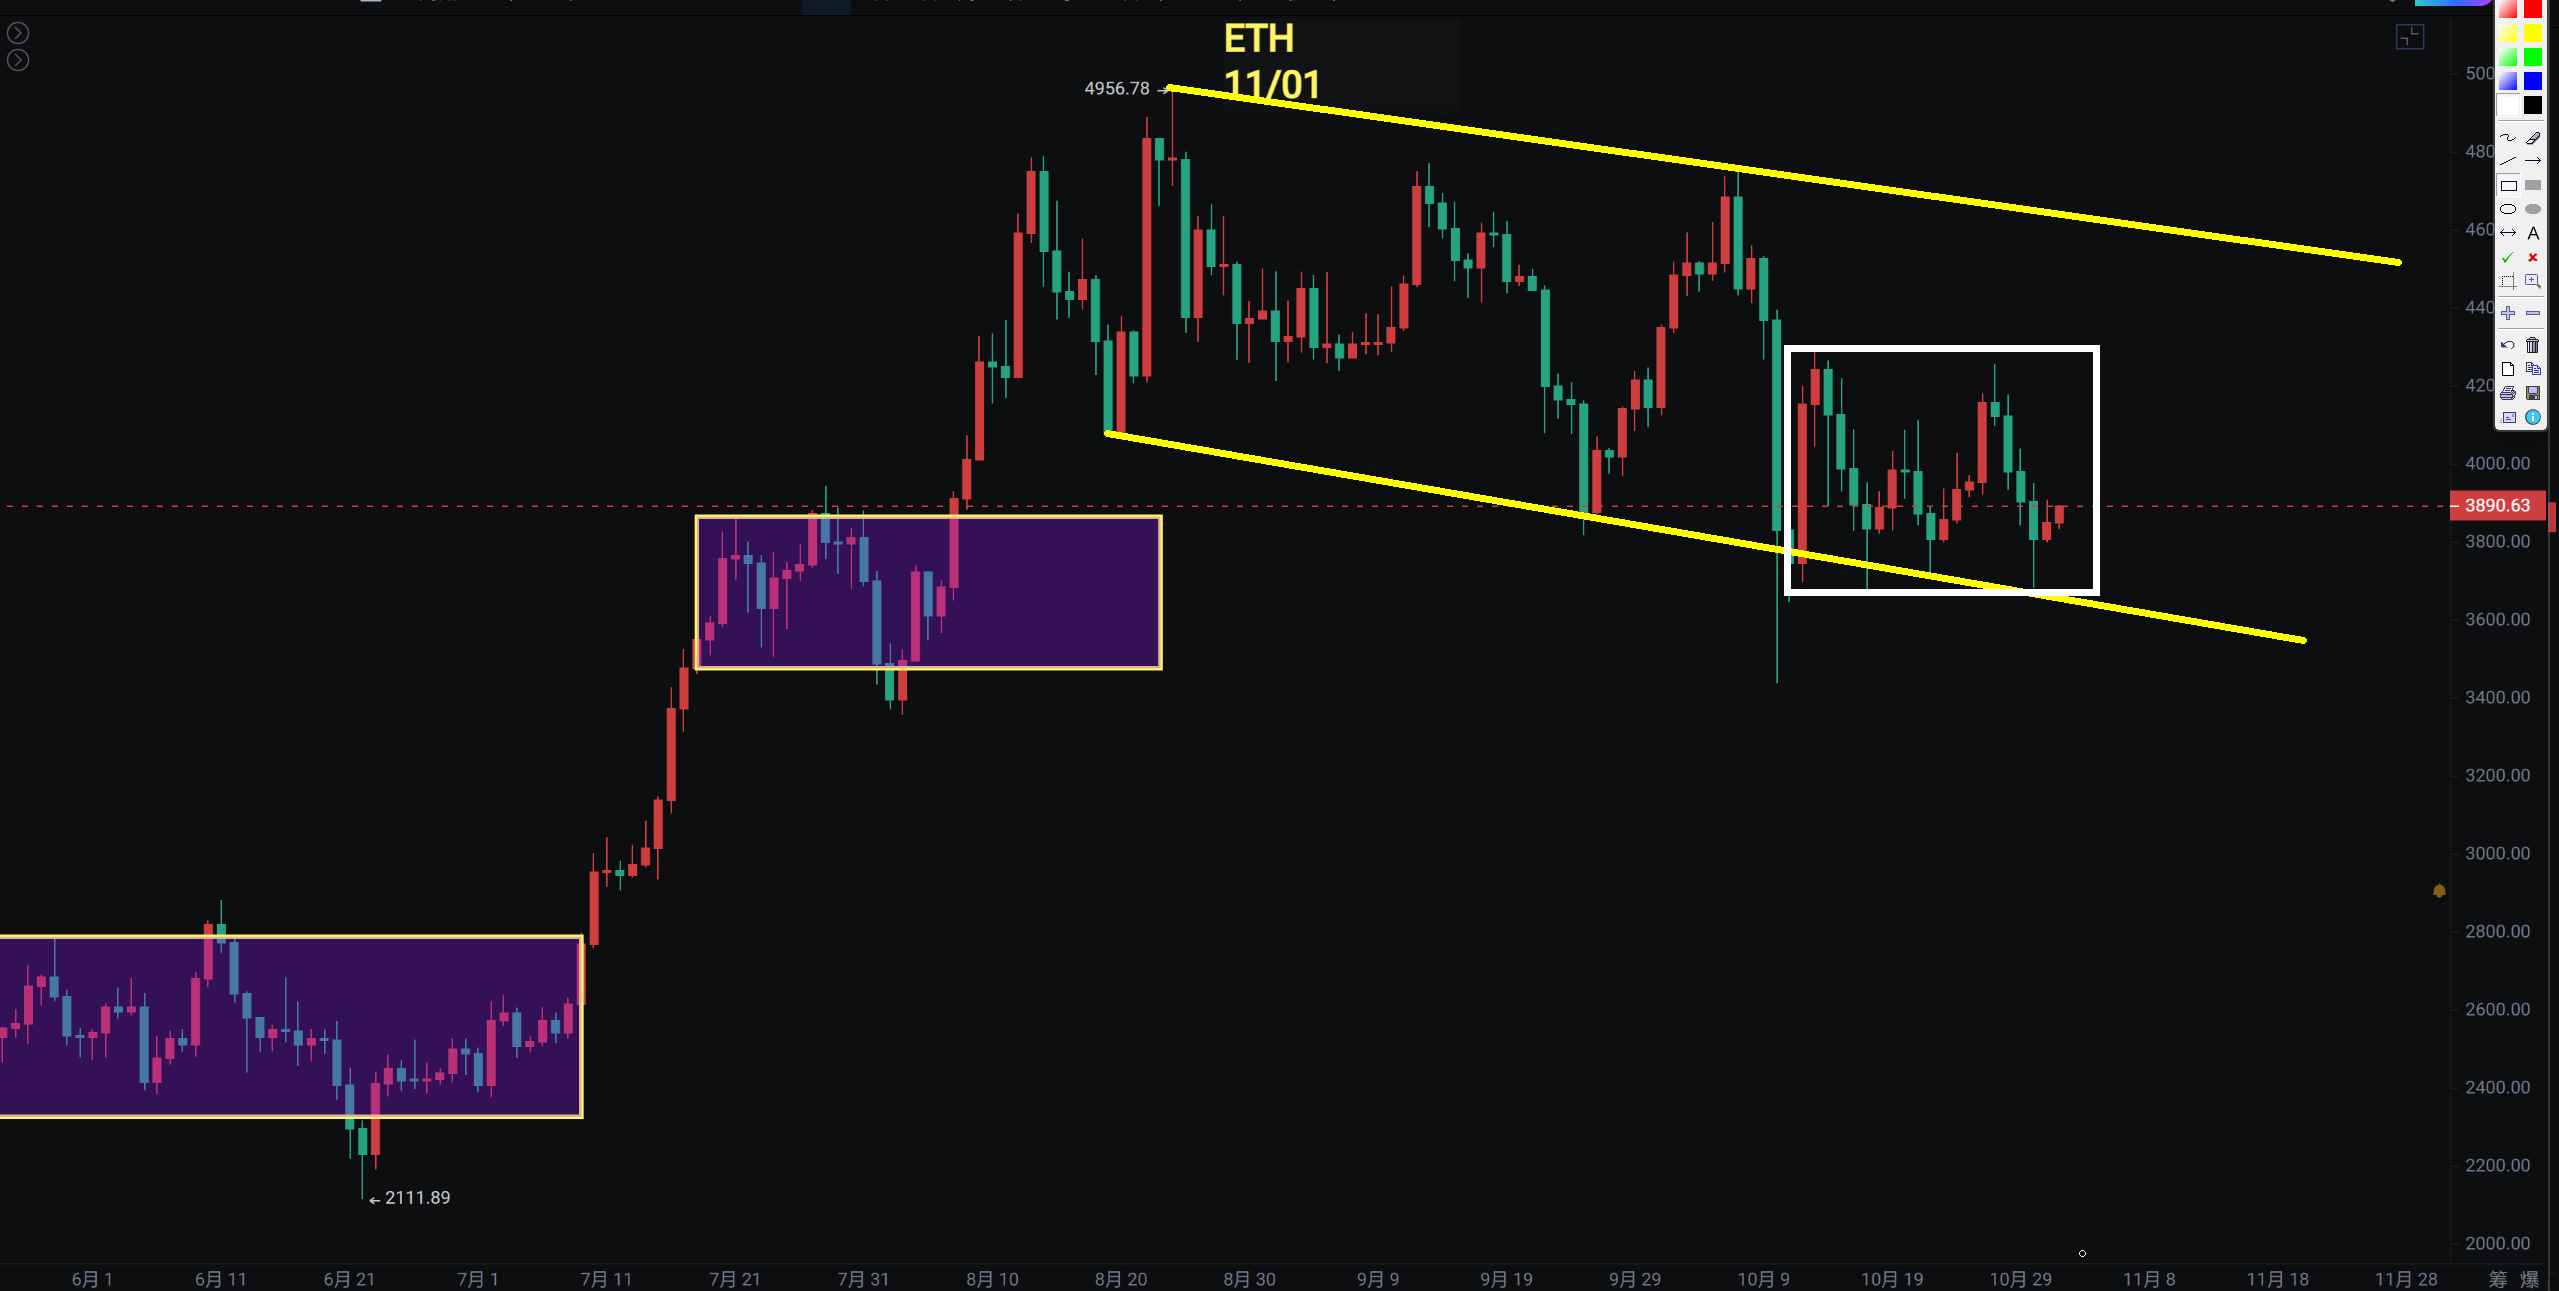
Ethereum has also closed with a pin bar on the three-month line, and the weekly chart has formed a descending channel, with a double bearish and single bullish pattern for six consecutive weeks. This signal is bearish, but it is also testing the MA20 support on the weekly chart.
The daily chart has shown a trend of breaking below the previous support at 4060, with the center of gravity moving downward. The daily line is under pressure from a descending trend line, while the price line is below the three moving averages.
Here, we still need to see whether Bitcoin's daily chart breaks upward or downward from the triangle, as Ethereum will follow suit.
● Support: 3355—3700

● Resistance: 4300—4550—4775
If you like my views, please like, comment, and share. Let's navigate through the bull and bear markets together!!!
This article is time-sensitive and for reference only, with real-time updates.
Focusing on K-line technical research, sharing global investment opportunities. Public account: BTC Trading Young Master Fusu

免责声明:本文章仅代表作者个人观点,不代表本平台的立场和观点。本文章仅供信息分享,不构成对任何人的任何投资建议。用户与作者之间的任何争议,与本平台无关。如网页中刊载的文章或图片涉及侵权,请提供相关的权利证明和身份证明发送邮件到support@aicoin.com,本平台相关工作人员将会进行核查。