After a gut-wrenching 48 hours for Bitcoin investors that saw the price of BTC briefly dip below $100,000 for the first time since May, cryptocurrency markets are now showing signs of life once again.
The more than $2 billion in total crypto liquidations during yesterday’s flash crash, mostly from long positions, represents one of the largest flush-outs of leveraged positions this year.
This event seems to have marked at least a temporary bottom, clearing out skittish investors and overleveraged traders. Crypto’s total market capitalization has since bounced back to $3.5 trillion, posting a solid 3.5% gain in the past 24 hours. according to CoinGecko.
Traditional markets are providing a mixed backdrop for the crypto rebound. The S&P 500 gained 0.7% on Wednesday after Tuesday's selloff, with the Nasdaq Composite advancing 0.9% as AI stocks rebounded from valuation concerns. However, the ongoing U.S. government shutdown—now the longest in American history at 31 days—continues to create uncertainty around economic data releases and policy decisions.
Despite the doom and gloom on social media, and even some analysts who are slashing their price targets, Bitcoin sentiment has turned at least marginally bullish on Myriad, a prediction market built by Decrypt's parent company Dastan. At the moment, Myriad users say there’s a 67% chance Bitcoin returns to $115K instead of bleeding all the way down to $85,000.
Are the predictors right, or is there a little too much copium in the air? Here’s what the charts say.
Bitcoin (BTC) price: Potential reversal in sight
Bitcoin is currently trading at $103,824, having recovered from Tuesday's plunge below $100,000—the first time the flagship cryptocurrency breached that level since May. The 24-hour price action shows resilience, though volume remains elevated as traders appear cautious about declaring the all-clear.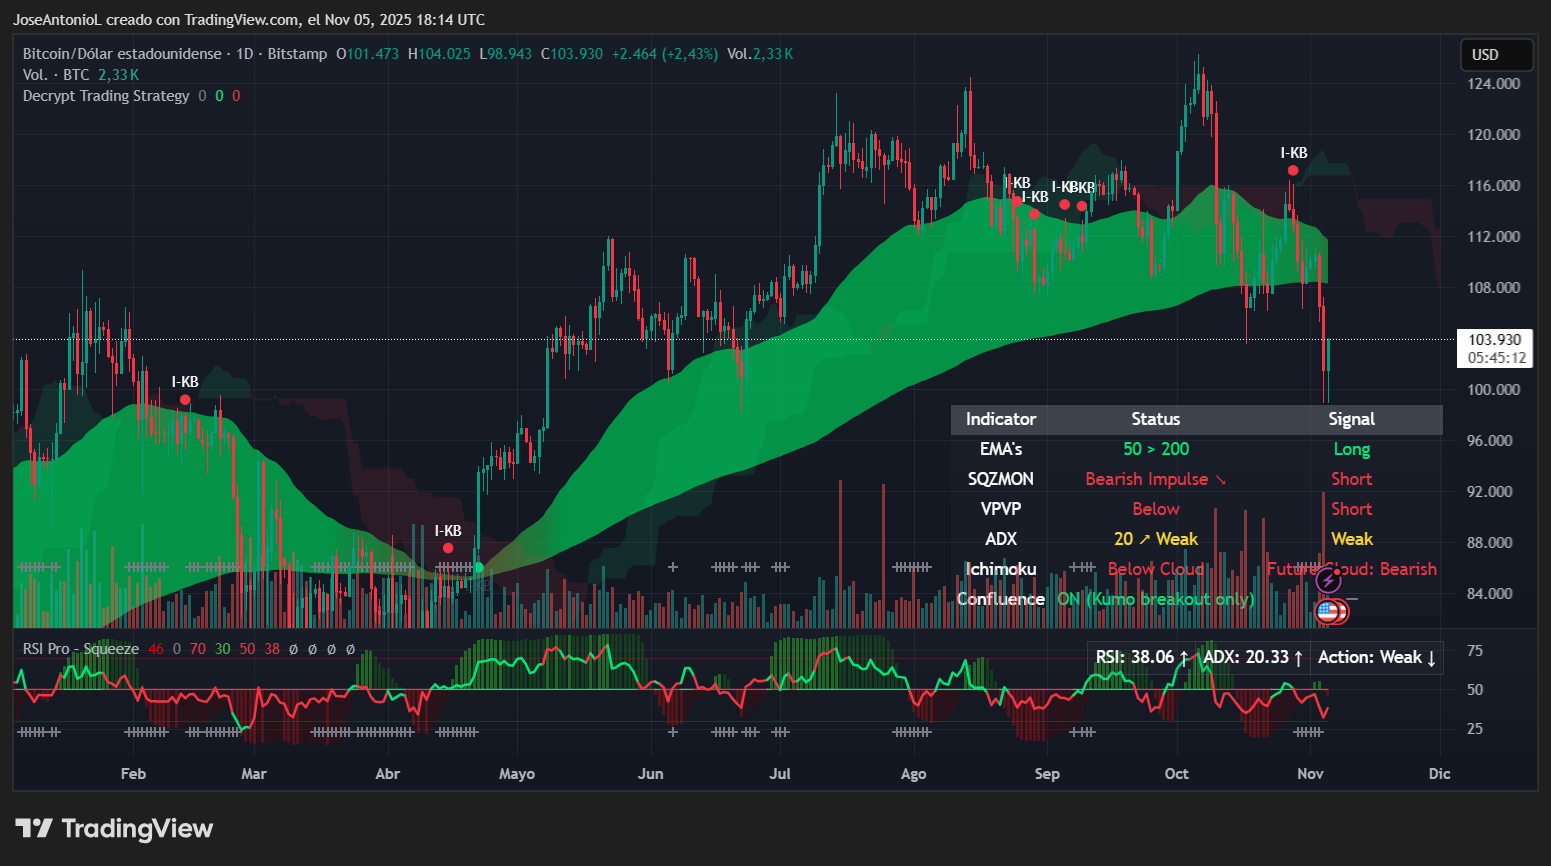
The technical picture shows bearish exhaustion, but not enough for a bullish breakout just yet.
The Relative Strength Index, or RSI, for Bitcoin is at 38 points, which sits in oversold territory. RSI measures market momentum on a scale from 0 to 100, where readings below 30 signal oversold conditions and over 70 suggest overbought.
At 38, Bitcoin’s RSI indicates selling pressure is waning, and bargain hunters typically start building positions at these levels. However, the Average Directional Index, or ADX, is only at 20.33, which barely suggests any trend exists at all. ADX measures trend strength: above 25 means strong trend, below 20 signals choppy, directionless action. Bitcoin's weak reading means the market lacks conviction.
Exponential moving averages are another key indicator: these metrics give traders a sense of price supports and resistances by taking the average price of an asset over the short, medium, and longer term.
For Bitcoin at the moment, the shorter-term average, the 50-day EMA, is sitting above the longer-term average, the 200-day EMA. That’s normally bullish, as the pattern forms what traders refer to as a “golden cross.”
However, Bitcoin’s current price is trading below both averages. This setup usually indicates a panic episode, and if prices don't recover quickly, the 50-day EMA will start moving downward toward a "death cross"—when long-term prices outperform short-term prices, signaling a potential long-term trend reversal. In other words, if that happens, it would signal that the strong bull run may well and truly be over. But we’re not there yet.
The Squeeze Momentum firing short confirms the recent breakdown released compressed energy, suggesting consolidation before the next major move.
At this stage, traders may opt to watch for a decisive daily close above $105,000 with strong volume to confirm reversal toward $110K. Failure to hold $102,000 could trigger a retest of the critical $100,000 level. Right now, most indicators—weak ADX, bearish Squeeze, ETF outflows, and current price below both EMAs—suggest Bitcoin needs to find a lower base before any sustainable rally can begin.
The only salvation for the Myriad bulls is that these two premises are true:
- Prices find support around the $90K mark before bouncing back—which seems like the most likely scenario.
- This is not the start of a crypto winter (basically a change in trend to multi-month bearish behavior), which is still too early to call. But if history repeats, 2026 could be a cold year.
Key levels to watch for:
- Immediate Resistance: $105,000 (former support zone and psychological level)
- Strong Resistance: $108,000-$109,000 (recent consolidation zone and major rejection area)
- Immediate Support: $102,000 (recent low and accumulation zone)
- Strong Support: $100,000 (psychological level and major options strike concentration)
The views and opinions expressed by the author are for informational purposes only and do not constitute financial, investment, or other advice.
免责声明:本文章仅代表作者个人观点,不代表本平台的立场和观点。本文章仅供信息分享,不构成对任何人的任何投资建议。用户与作者之间的任何争议,与本平台无关。如网页中刊载的文章或图片涉及侵权,请提供相关的权利证明和身份证明发送邮件到support@aicoin.com,本平台相关工作人员将会进行核查。