Author: 0xBrooker
After breaking the upper edge of the "Trump bottom" at $110,000 last week, BTC experienced a collapse-like decline this week, dropping 10.04% amid a sudden increase in macro uncertainty. This plunge broke through two key technical supports: the lower edge of the current bull market's rising channel and the 360-day moving average.
Although the U.S. government has restarted, funds have not yet flowed out of the Treasury account, and commercial bank reserves remain low, leading to increased short-term liquidity tension. In the medium term, the number of "hawkish" Federal Reserve voting members continues to rise, with the probability of a rate cut in December falling below 50%.
The market is filled with sell orders, with long positions continuously taking profits and short positions selling at a loss. The BTC ETF channel recorded the second-highest single-day sell-off in history. Buyers are present but very passive, and all technical supports seem to have lost their effectiveness.
With the effective break below the lower edge of the rising channel and the 360-day average, BTC has technically entered a bear market. If funds do not return abundantly in the coming weeks and selling pressure continues, it will be difficult for BTC prices to return above key technical indicators and confirm an effective break on a weekly basis. This would likely mark the official end of the BTC bull market that began in 2022.
Policy, Macro Finance, and Economic Data
This week, the U.S. government has just restarted, and next week the September CPI will be released. However, due to the lack of data collection during the shutdown, the October CPI will be permanently missing. This significantly undermines the objectivity of the Federal Reserve's rate decisions in December.
Non-farm payroll data has not been published for several weeks. The weekly ADP data released on the 11th shows that, as of the end of October, the private sector experienced an average weekly net loss of 11,000 jobs, a shift from a weekly increase of 14,250 jobs earlier in October, indicating a potential reversal in hiring momentum. This is "good news" for rate cuts.
However, the Federal Reserve continues to be "hawkish." Following the hawkish stance of three voting members late last week, three more hawkish members were added this week. This directly pushed the probability of a rate cut in December down from an initial 90% to 44% by Friday, essentially pricing in another pause in rate cuts in December.
In terms of short-term liquidity, the government's shutdown has caused funds in the Treasury General Account (TGA) to accumulate to nearly a trillion, leading to high SOFR rates. Liquidity tension rose to recent highs by Friday, with the Nasdaq continuously declining, breaking below the 60-day moving average during trading on Friday, down over 6% from its peak.
However, due to reaching strong support levels, the Nasdaq ultimately closed up 0.13% after a deep V-shaped recovery, finishing near last Friday's low and above the 50-day moving average.
Currently, the recent adjustment in U.S. stocks can be characterized as a "valuation correction of overvalued AI concept stocks amid tightening liquidity and declining probabilities of a rate cut in December." For the entire turbulent year of 2025, there is currently no indication of greater systemic risk in U.S. stocks.
Crypto Market
Compared to U.S. stocks, BTC's situation is bleak. Following three consecutive days of decline, it continued to plummet by 5.13% on Friday, with both the drop and trading volume nearing those of October 10, marking the second worst day in this round of decline.

BTC Daily Chart
Since July, long positions have initiated the third wave of selling, and as BTC prices began to adjust downward over the past four weeks, selling pressure has intensified, which is often characteristic of a transition phase between bull and bear markets.
This week, the scale of selling from both long and short positions entering exchanges remained high but slightly decreased compared to last week. However, exchanges have shifted from outflows to inflows, which may lead to a weaker market trend.

Selling Scale of Long and Short Positions and BTC Inventory Changes in Central Exchanges (Weekly)
However, the supporting funds are very scarce. It can be seen that for most trading days last week, both BTC ETF and ETH ETF were in sell mode, maintaining a high scale of selling.
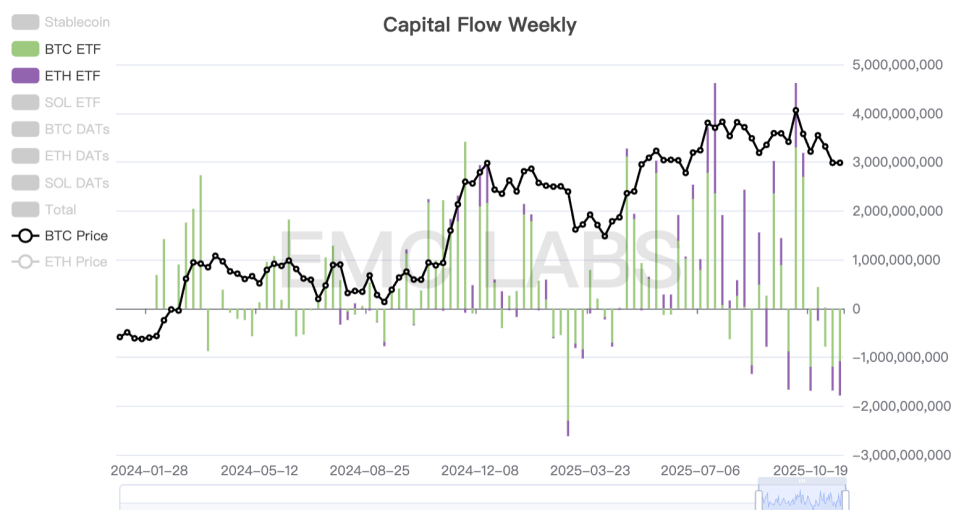
Among the main buyers in this cycle, the BTC ETF channel has turned to selling. According to media reports, DATs company Strategy and BMNR were still buying in the market this week, but their efforts alone are insufficient. Ultimately, both BTC and ETH ended the week with significant declines.
From a technical perspective, BTC has effectively broken below the lower edge of the rising channel on the daily chart and is transitioning into a bear market. Since November 2022, previous mid-term adjustments have been supported by this channel line, marking the first time this key support has been breached in this cycle. If it cannot recover above the lower edge on a weekly basis in the coming weeks, it will confirm a bear market on the weekly chart.
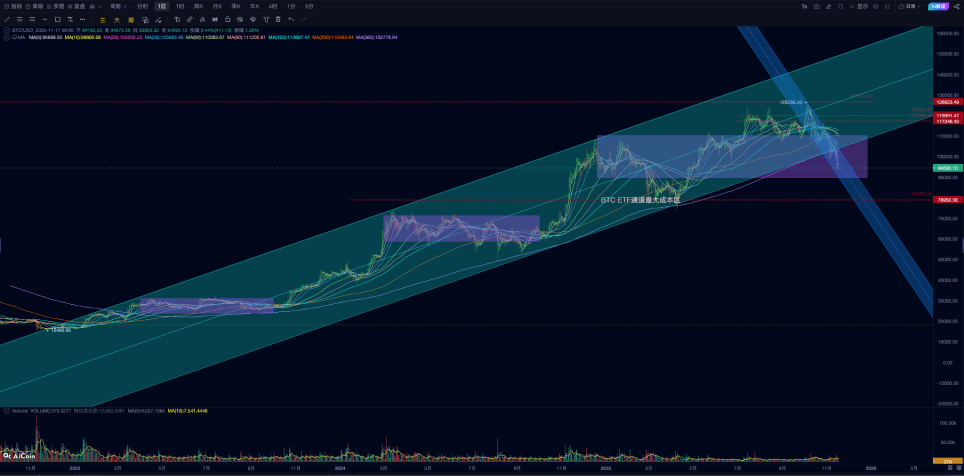
BTC Price Breaks Below the Lower Edge of the Current Bull Market Rising Channel
With the Federal Reserve continuing to issue bonds, short-term dollar liquidity remains scarce and may even worsen, which means that the tight funding situation could intensify in the short term, putting continued pressure on BTC and the crypto market.
In the medium term, the upcoming September CPI is also crucial. The 44% probability of a rate cut has already been reflected in prices; if it continues to decline, prices are likely to be further adjusted downward. Conversely, if the CPI stabilizes and employment data remains poor, a rate cut in December is still possible. Based on this "optimistic" assumption, if funding channels like ETFs can rapidly return, the logic behind BTC's "bear market crisis" could still be alleviated. Additionally, the selling from long positions is also worth close attention; if it can slow down or return to accumulation, the market may gain some breathing room.
Cycle Indicators
According to eMerge Engine, the EMC BTC Cycle Metrics indicator is at 0, entering a "downward phase" (bear market).
免责声明:本文章仅代表作者个人观点,不代表本平台的立场和观点。本文章仅供信息分享,不构成对任何人的任何投资建议。用户与作者之间的任何争议,与本平台无关。如网页中刊载的文章或图片涉及侵权,请提供相关的权利证明和身份证明发送邮件到support@aicoin.com,本平台相关工作人员将会进行核查。


