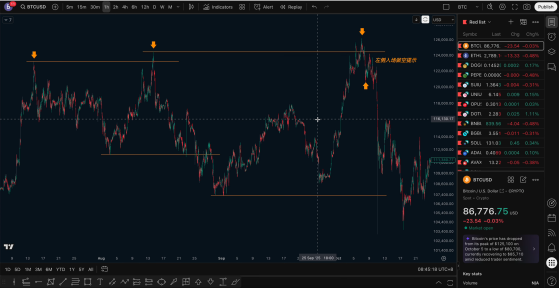
Recently, the core of the entire market trend has always revolved around one direction: shorting with the trend, without bottom fishing.
Throughout this entire decline, we participated in a total of five short structures. Here, I will provide a systematic review to help understand the entire logic.
I. Review of the Five Short Structures

① 122,000 → 105,000 (First Segment)
At that time, the structure had already shown a failed breakout, coupled with obvious false moves at high levels, so we initiated the first medium-term short from 122,000.
② Rebound to 100,006 → Short to the previous low (Second Segment)
This rebound just hit the 0.5–0.618 range, around 100,006.
The structure had not reversed, and we continued to look for shorts down to the next low.
③ Second test of resistance at 106,000 → Looking for a breakdown below 100,000 (Third Segment)
When the price rebounded to test the resistance range for the second time, we again suggested laying out a short at 106,000.
At that time, the judgment was: high probability of breaking below 100,000 — which indeed happened later.
④ 100,006 → Looking towards 94,000 (Fourth Segment)
After another rebound at 100,006, we continued to look for shorts down to 94,000.
⑤ 94,000 → 80,000 (Fifth Segment)
This decline was the main trend of last week.
During this period, I kept reminding: do not bottom fish, only short with the trend.
II. Why could we predict accurately in advance? The answer is actually very simple: the trend.
Many people have privately messaged me:
“How did you judge this market segment? How did you manage to analyze it so coherently?”
The answer is very direct:
This is a trending market, not a ranging market. Trending markets are much easier to analyze than ranging markets.
Ranging markets can suddenly reverse
Ranging markets are prone to false breakouts
It's hard to determine direction in a range, and the margin for error is low
But this market segment has been a bearish structure from the larger cycle to the smaller cycle:
Weekly bearish
Daily bearish
4-hour bearish
1-hour bearish
Full-cycle bearish resonance, making it the easiest to analyze and trade.
III. My core analysis: price action as the main focus, indicators as a supplement
Commonly used supplements include:
MACD trend structure
Weekly/Daily Vegas channel
SMA: 50-week moving average, 200-week moving average
They are just confirmation tools.
What truly determines direction is still:
Structure, failed breakouts, high and low point breaks, channels, double tops and bottoms, pullback confirmations.
IV. Breaking it down segment by segment
1) Why did we suggest a short near 122,000?
At that time, the structure was —
Bullish breakout to a new high
Then a failed breakout occurred
At the same time, a volume increase in the decline
Combined with the 50-week moving average (around 100,000) as a resistance level
This is a typical external range liquidity:
First, a sharp rise to clear the shorts
Then wash out the longs
Finally, complete a "two-way liquidation"

After completing the double liquidation, the trend often begins to reverse.
Therefore, we entered a short on the left side of the 122,000 area, with controllable risk due to the extremely high risk-reward ratio.
2) Why was the rebound at the 100,000 round number accurate?
100,000 essentially is:
The previous resistance level of the weekly structure → transformed into support
A key psychological level
Both previous dips rebounded (at 103,000)
Only after the third test is it likely to break.
This is also what I later emphasized multiple times:
The first and second tests may not break, but the probability increases significantly on the third.
Sure enough, the third test broke directly, entering an expansion.
3) Why is 117,500 a strong resistance?
Because it overlaps three structures:
0.618 retracement point
Upper boundary of the channel
The extreme range of the previous rebound
Multiple second tests have not broken through

Here we provided at least three opportunities to enter short:
Short on the left side of the resistance range
Double top neckline break + pullback confirmation
Second confirmation rebound after channel break
All three entries are standard models.
4) Why look for 94,000–80,000 after breaking below 100,000?
Because the entire downward segment expansion meets:
1.382–1.618 bearish expansion targets

Adding the structure, channel break, and failed pullback, the bearish target extends to 94,000 or even lower.
Throughout the process, you will find:
Price action + auxiliary indicators + key price levels + psychological levels → form a complete logical chain.
The reason this market segment was "clear" is not because of strong predictive ability, but because:
The structure was very obvious.
If the market were ranging, I would not speak so aggressively.
But as long as the trend is clear, I will keep emphasizing the same phrase:
Follow the trend, do not bottom fish.
Follow me, join the community, and let's improve together. The article is published with a delay and is for reference only.

免责声明:本文章仅代表作者个人观点,不代表本平台的立场和观点。本文章仅供信息分享,不构成对任何人的任何投资建议。用户与作者之间的任何争议,与本平台无关。如网页中刊载的文章或图片涉及侵权,请提供相关的权利证明和身份证明发送邮件到support@aicoin.com,本平台相关工作人员将会进行核查。


