Master Discusses Hot Topics:
Last night, as soon as the U.S. stock market opened, Bitcoin surged along with the sentiment. It looked like it was about to turn around, but the U.S. stock market couldn't hold for even five minutes before it started to plunge. Bitcoin also showed some resilience, holding on for over half an hour before turning back. But essentially, it's all driven by emotions.
Currently, the market is focused on two things: the U.S. monetary policy and so-called risk events. Tonight's CPI and tomorrow's interest rate hike in Japan are what I'm referring to. These factors are not a threat to the current Federal Reserve; Japan's minor interest rate hike is also quite predictable.
In yesterday's analysis, I mentioned that the market had already digested this information. Last night's drop could be described as a hedge against inflation, but it was definitely not a sudden negative event.
Additionally, the dollar is depreciating, and gold is rising. According to textbook predictions, 2026 should indeed be a bull market. But the problem is, it's not 2026 yet. Bitcoin's major indicators have clearly pointed downward, and this thing has never lied.
The end of 2021 serves as a living textbook; after peaking at 69K, it lingered above 50K while many continued to shout "bull market." Then, the Russia-Ukraine conflict in February 2022 triggered the main downward wave. It halved in value, rebounded to 0.618, then halved again, and rebounded once more. Do you really believe this is a coincidence?
The four-year cycle had already established 2022 as a bear market. The monthly death cross for Bitcoin formed in November 2021, and the direction was set at that time. The subsequent negative news was just lining up to come out, and it's the same now; a bunch of potential negative news is still on the way.
Back to the market, last night's trading was more typical. Bitcoin's 4-hour chart showed a long inverted hammer, looking like it was about to take off, but in reality, it was still a mess. Three hundred million dollars entered the market in an instant, and in less than an hour, 350 million left.
First, they wash out the shorts, then smash the price back to the starting point; the process is all too familiar. That's why I've always said, don't chase after a sudden spike. Sudden spikes are usually for unloading, and false rises are just to pump up the retail investors.
Currently, all rebounds are essentially traps for the bulls. You think you're catching the bottom, but it's just a short-term rise; after 12 to 24 hours, it becomes invalid. Until I see a real downward spike, I won't dare to talk about catching the bottom.
During the day in Asia, the rebound was weak due to the U.S. stock market closing down. Today's low was already established during last night's sell-off after the spike; chasing shorts during the day will only lead to being slapped back and forth. Tonight, it's possible we might spike up again before continuing downward.
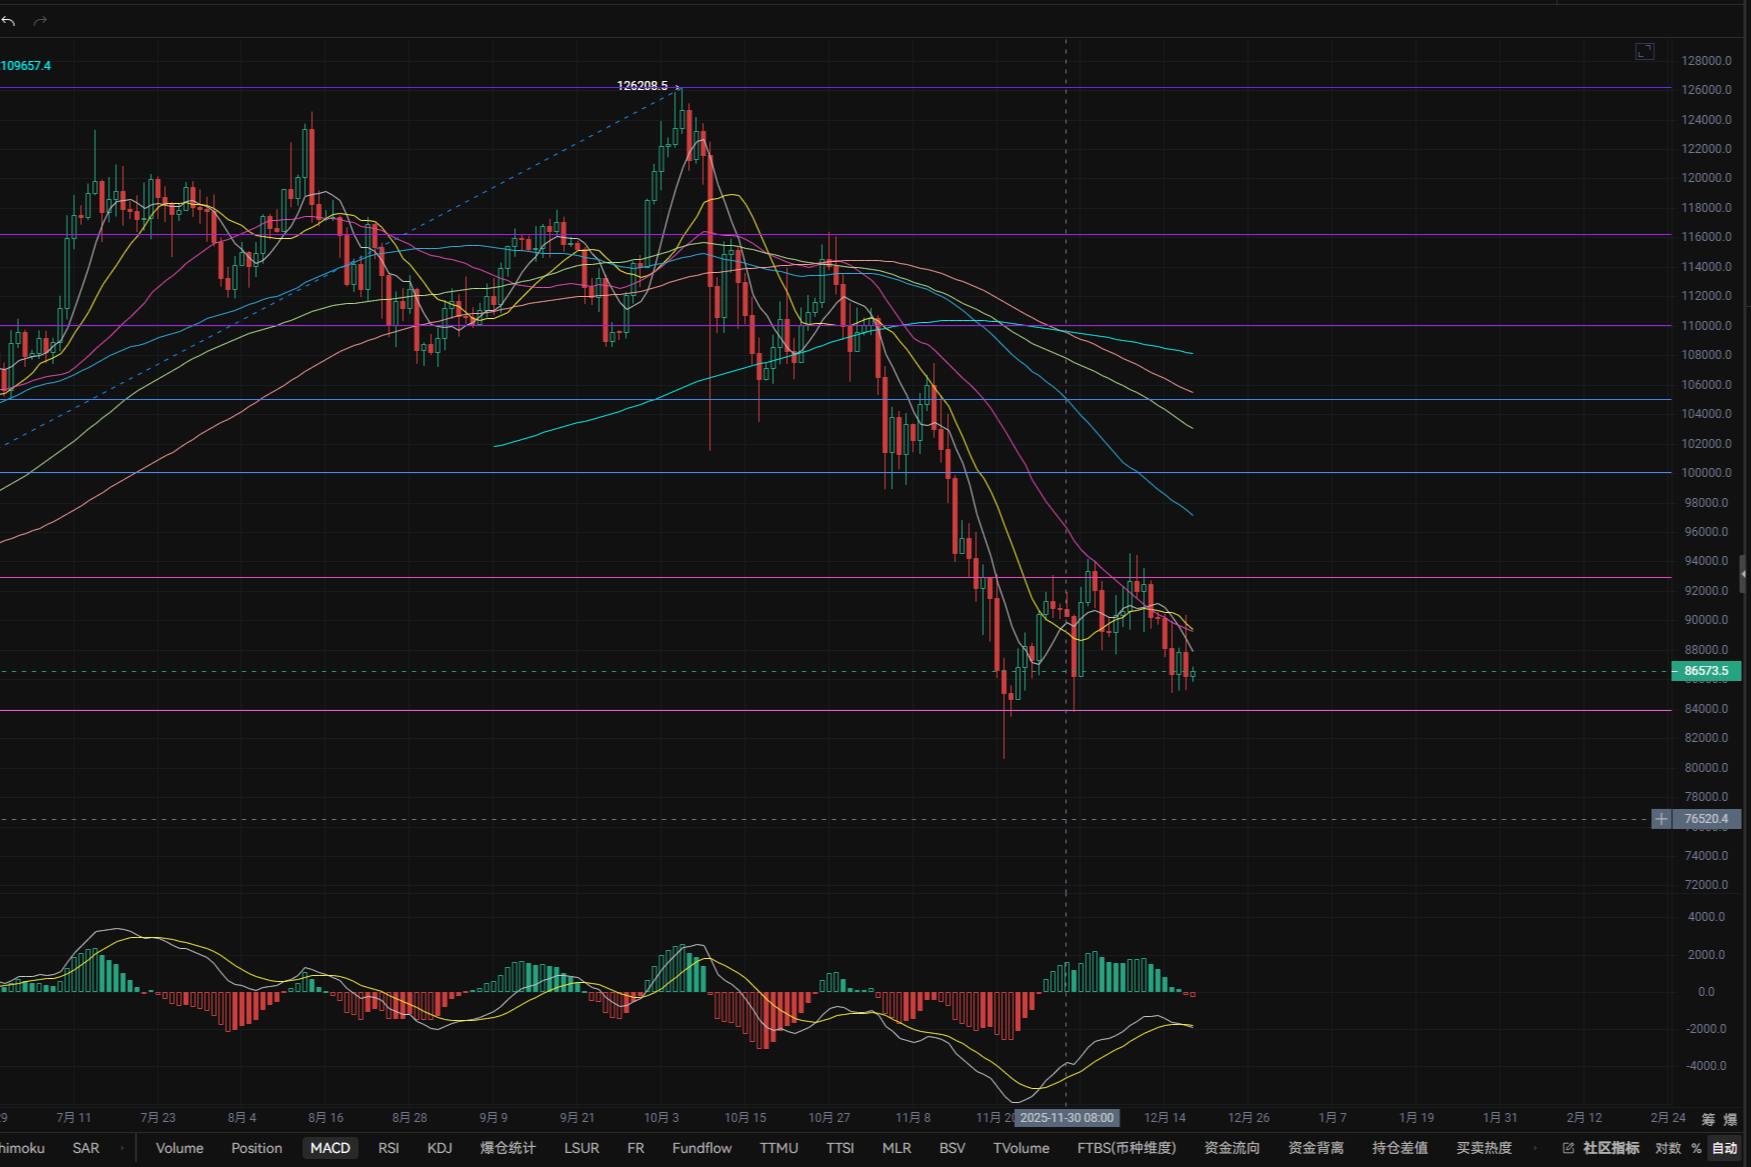
On the daily structure, the large range from 80K to 94K has repeatedly been rejected at 94K to 95K. Falling below 87.7K has already declared the end of the upward oscillation, leaving only downward movement. This week, the price has been tugging around 85K to 90K, and last night's rejection at 90K is now a solid ceiling.
The attraction of the low point in the 80K range is growing stronger; I see 78K not as an emotional level, but as a structural decision. The current sell-off is in the spot market, and the continuous outflow of ETFs from Wall Street is evidence of this.
The spot market is selling, and no matter how much the contracts are pushed up, it's just a rebound. The new equilibrium price is not at 80K, nor at 90K; it starts at least at 70K.
As for Ethereum, there's no need to elaborate; the monthly adjustment is not complete. The 45-day death cross has just formed, indicating at least three months of bearishness. EMA has broken down, and MACD nearing the zero axis is a signal for accelerated decline. The only levels worth discussing for catching the bottom are between 2222 and 2112, and regarding catching the bottom, I'm just taking it step by step…
Master Looks at Trends:
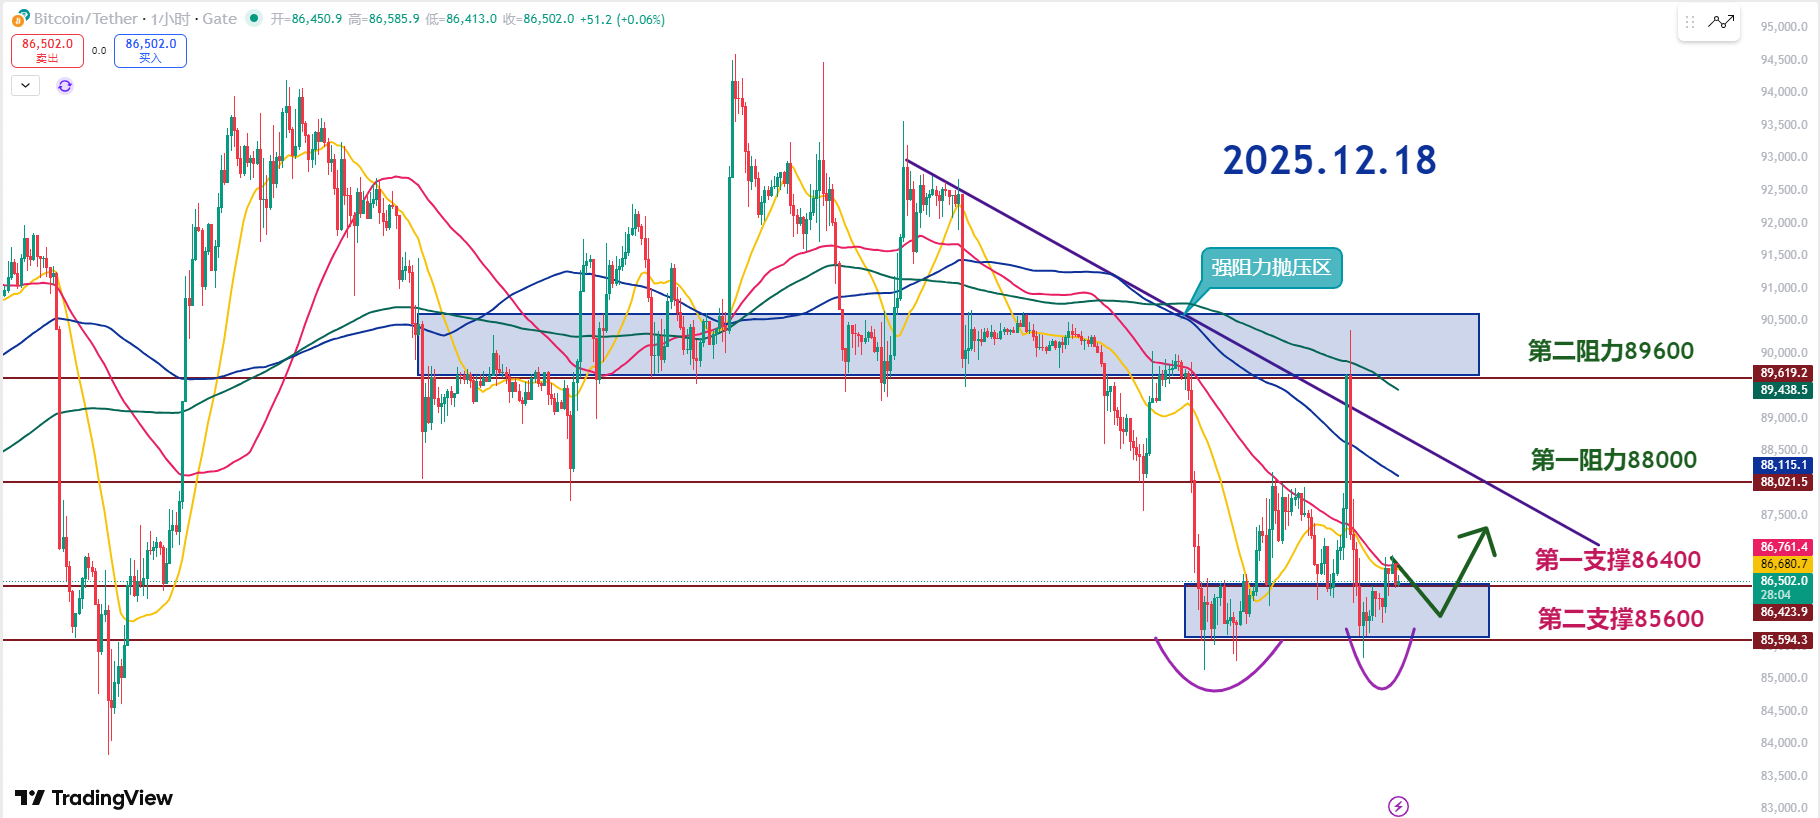
From a technical perspective, the range from 85.6K to 86.4K has been repeatedly tested, forming a very standard double bottom structure. As long as the price remains above this level, it indicates that the bulls are not done yet.
In the short term, 88K is the first critical level to face. Before reaching 88K, there can be room for a rebound. Once it touches 88K, first check for a decent pullback and turnover. If it spikes up without a pullback, that's a false breakout. A gradual rise that stabilizes is what we call a true rebound.
As for 89.6K, this is a heavy accumulation zone formed during the downward process; without volume and structural breakthroughs, don't expect it to pass in one go. This is where the sell-off and unloading happen.
On the 4-hour level, a recent long upper shadow candlestick has appeared, currently looking more like accumulation rather than unloading, but the premise is clear: no sudden spikes. As long as it's a straight line upward, there's a 90% chance it's a trap to get you to take the bait. A truly healthy trend must gradually raise the lows.
The first support is at 86.4K, and the second support is at 85.6K. These two positions are currently the most critical short-term bottom zones; as long as they are not pierced by a single long bearish candle with volume, they can still be treated as high-value areas. The only premise is that the defense must be clear; don't hold on stubbornly.
The first resistance is at 88K, and the second resistance is at 89.6K. 88K is the short-term previous high at the upper edge of the range; a pullback before truly stabilizing there is highly probable.
The correct approach is not to chase highs but to observe whether there is a reduction in selling pressure during pullbacks before considering re-entry. If it can effectively break through and stabilize, then 90K may have a chance to be retested.
Today's trading thought process is not complicated, similar to yesterday. Treat the range from 85.6K to 86.4K as a short-term bottom and maintain expectations for a technical rebound. But let me be clear, this is not an invitation to mindlessly go long; the risk-reward ratio here is worth betting on, provided you stick to your discipline.
12.18 Master’s Swing Trading Setup:
Long Entry Reference: Buy in the 85600-86400 range, Target: 88000
Short Entry Reference: Sell in the 87800-88400 range, Target: 86400-85600
If you genuinely want to learn something from a blogger, you need to keep following them, rather than making hasty conclusions after just a few market observations. This market is filled with performers; today they screenshot long positions, tomorrow they summarize shorts, making it seem like they "always catch the top and bottom," but in reality, it's all hindsight. A truly worthy blogger has a trading logic that is consistent, coherent, and withstands scrutiny, rather than jumping in only when the market moves. Don't be blinded by flashy data and out-of-context screenshots; long-term observation and deep understanding are necessary to discern who is a thinker and who is a dreamer!
This content is exclusively planned and published by Master Chen (WeChat: Coin Master Chen). For more real-time investment strategies, solutions, spot trading, short, medium, and long-term contract trading techniques, and knowledge about candlesticks, you can join Master Chen for learning and communication. A free experience group for fans and community live broadcasts are now available!

Friendly Reminder: This article is only written by Master Chen on the official account (as shown above); any other advertisements at the end of the article and in the comments section are unrelated to the author!! Please be cautious in distinguishing between true and false, thank you for reading.
免责声明:本文章仅代表作者个人观点,不代表本平台的立场和观点。本文章仅供信息分享,不构成对任何人的任何投资建议。用户与作者之间的任何争议,与本平台无关。如网页中刊载的文章或图片涉及侵权,请提供相关的权利证明和身份证明发送邮件到support@aicoin.com,本平台相关工作人员将会进行核查。