What are we actually trading? In fact, we are trading risk itself. The patterns of market changes are not complex; what is complex is human nature. Everyone's experiences, perceptions, and insights are different. Some may excel in other industries, but not necessarily in the financial market.
Hello everyone, I am trader Gege. The fluctuations in Bitcoin's range were smaller last week, moving back and forth within a $4000 space, without breaking through the short-term boundary. This week, there are no significant data releases from the U.S., but we are about to close the yearly, quarterly, and monthly lines, so the recent market trends are worth paying attention to. The volatility is expected to be large, which may change the current structure. Without further ado, let's take a look at the technical forecast for Bitcoin this week.
The monthly line is likely to form a doji candle, which was predicted in an earlier article. There are about 2 days left until the close, and the occurrence of a solid bearish or bullish candle is a low-probability event. There’s not much to say about the monthly line; the focus is on the K-line pattern for January 2026, which I lean towards being bullish. Since the closing price in the second week of this month fell below 90,000, the subsequent two weeks of rebounds have not stabilized above 90,000. Each time it approached the 90,000 line, there was a pullback, and today is no exception, with the K-line being hindered by the MA7 resistance. The key short-term boundary has not been broken for a while, and based on the current pattern, it is more likely to see another downward spike to complete the current structure.
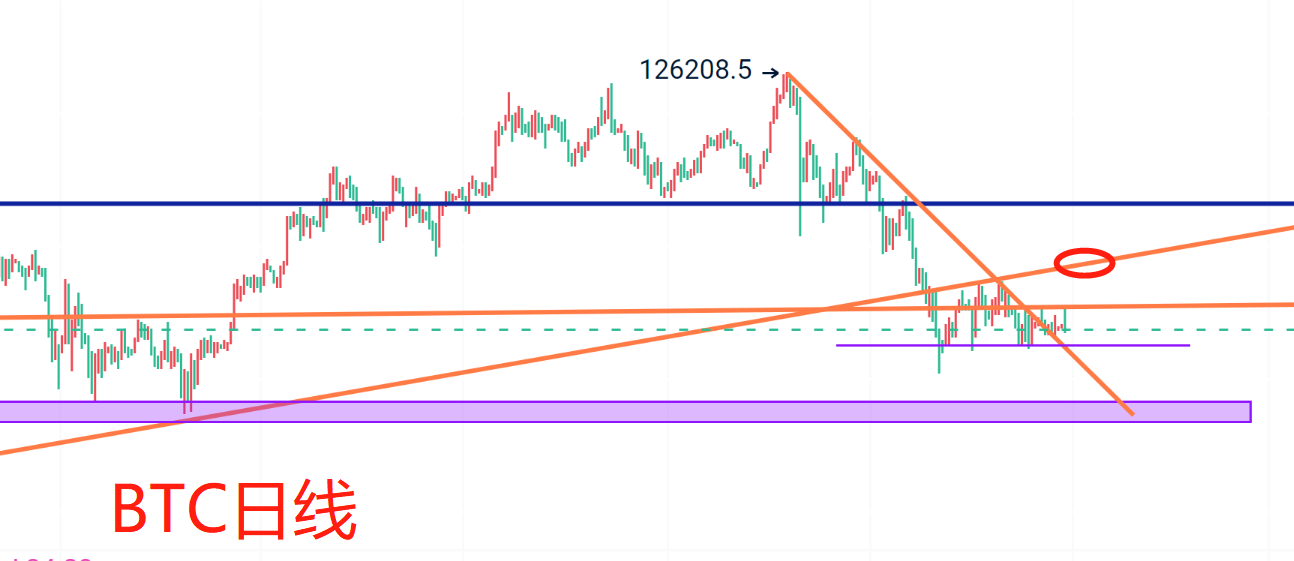
On the daily level, the BOLL is narrowing, and the K-line is also oscillating within a small box. From the perspective of moving averages and the BOLL pattern, the turning point for a change is approaching and won’t take long. Since breaking the downward trend line's resistance, it has been running above it temporarily, so in the short term, we can continue to pay attention to the downward trend line converting into support, which is also near the lower BOLL band. The upper boundary of the box has been tested multiple times, and with the turning point approaching, it can be moved up to the 92,000 line, which is a boundary mentioned multiple times in previous articles. If a breakout occurs, the major boundary will be at the conversion point of the rising trend line, which is around 96,000. If the aforementioned short-term support is broken, we need to pay attention to the 82,000 area.
In summary, the short-term focus for this week is to short at the 91,500-92,000 line. If it breaks and stabilizes above 92,000, then wait for 96,000-96,800 to short again. Long positions can be taken at the 85,200-84,700 line, and if it breaks, then wait for the 82,500-81,800 line to enter again. PS: The previous medium to long-term ambush strategy remains valid. Friends who want to refer back can check previous articles; I won’t elaborate here. That’s all for today.
The suggestions are for reference only. Please manage your risk when entering the market, and control your profit and stop-loss spaces accordingly. Specific strategies should be consulted in real-time.
Alright, friends, we’ll see you next time. I wish everyone success and smooth sailing in the crypto world! More real-time suggestions will be sent internally. Today’s brief update ends here. For more real-time advice, find Gege.
Written by/ I am trader Gege, a friend willing to accompany you in your resurgence.

免责声明:本文章仅代表作者个人观点,不代表本平台的立场和观点。本文章仅供信息分享,不构成对任何人的任何投资建议。用户与作者之间的任何争议,与本平台无关。如网页中刊载的文章或图片涉及侵权,请提供相关的权利证明和身份证明发送邮件到support@aicoin.com,本平台相关工作人员将会进行核查。