Coin Waves: 1.3 Bitcoin (BTC) Market Analysis Reference:
Yesterday, Bitcoin continued its rebound trend, showing an overall upward fluctuation pattern throughout the day. Although the price experienced some temporary pullbacks, the bullish support was strong, and it broke above the $90,000 mark again in the early hours of today; however, there was heavy selling pressure at this key level, and the bulls failed to stabilize effectively, leading to a subsequent pullback, with the current price running around $89,500.
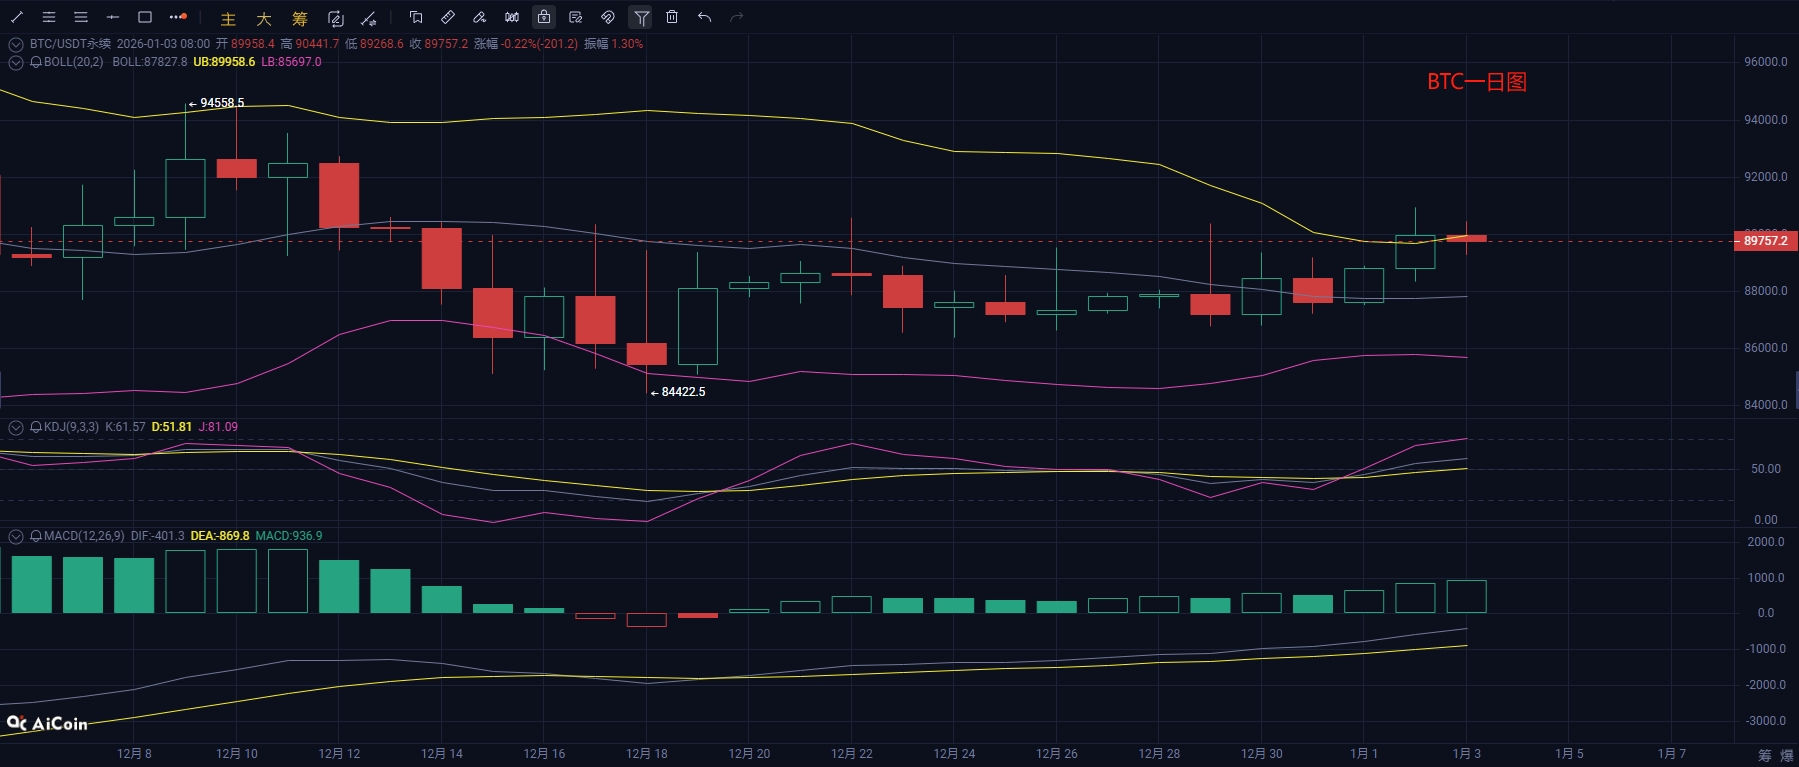
On the daily chart, the BTC candlestick has closed positively for two consecutive days, and the Bollinger Bands are gradually expanding after a contraction. The current price is stable above the middle band of the Bollinger Bands and is continuously approaching the upper band; the short-term EMA7 has successfully crossed above the mid-term EMA15 and EMA20, forming a solid support structure. In terms of indicators, the KDJ three-line golden cross continues its upward trend, with K at 61.26, D at 51.71, and J at 80.37, all three lines are in the strong zone above 50; the MACD indicator shows the fast and slow lines continuing to diverge upwards, with the histogram in positive territory and continuing to expand, indicating there is still upward space in the short term; however, attention should be paid to potential overbought pullback signals as the J value approaches 80.
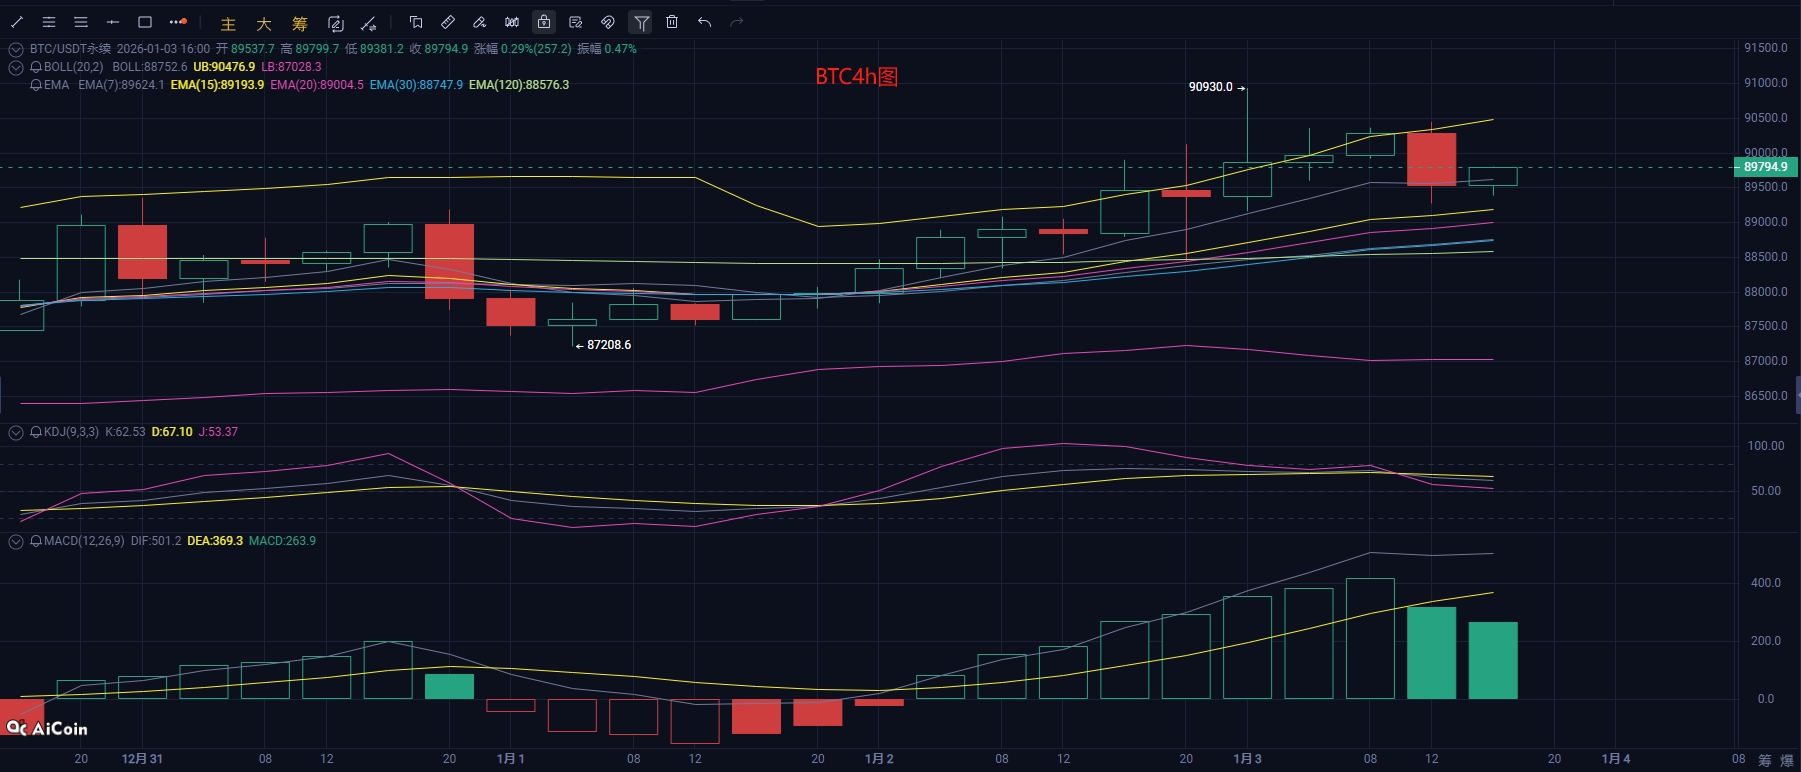
From the short-term hourly chart, at the 4-hour level, the BOLL indicator shows that the price peaked at the upper band of 90,900 before retreating, and the current price is between the upper and middle bands of the Bollinger Bands, which are overall showing an upward opening trend; the EMA moving average system is in a bullish arrangement, with the short-term EMA (15/20) providing support for the price, and the mid to long-term EMA (30/120) also moving upwards simultaneously. In the KDJ indicator, the K, D, and J lines are turning downwards, having started to retreat from the overbought area, indicating a short-term pullback signal; although the MACD indicator is still in positive territory, the histogram has turned green, and there are signs of the DIF line turning and converging, indicating that bullish momentum is beginning to wane. However, the bullish structure of the Bollinger Bands and moving averages has not been broken, and it is likely that the price will first oscillate around the 89,000-90,000 range to digest short-term selling pressure. If it can stabilize above the middle band of the Bollinger Bands and the short-term EMA support, there is still a possibility of testing previous highs again; if it loses the key support around 88,500, the pullback may further expand to the lower band around 87,000.
Coin Waves: 1.3 Bitcoin Short-term Reference:
Long Position: Buy in the 87,000-88,000 range, with a stop loss at 86,000, targeting 88,500-89,500.
Short Position: Sell in the 90,500-91,500 range, with a stop loss at 92,500, targeting 89,500-88,500.
Coin Waves: 1.3 Ethereum Short-term Reference:
Long Position: Buy in the 2,970-3,020 range, with a stop loss at 2,870, targeting 3,100-3,150.
Short Position: Sell in the 3,130-3,180 range, with a stop loss at 3,300, targeting 3,060-2,980.
【The above analysis and strategies are for reference only. Please bear the risks yourself. The article may have delays in review and publication, and the strategies may lack timeliness. Do not operate blindly!】

This content is originally shared by Coin Waves and represents personal opinions only. The article may have delays in sending and is for reference only; do not operate blindly! If you want to get more daily real-time trades, follow my public account! Here, you can engage in online technical learning and understand knowledge related to exiting positions. I have years of research experience in the market, focusing on the major trends in the cryptocurrency space. I mainly analyze and guide investment operations for BTC, ETH, DOT, LTC, FIL, EOS, BCH, ETC, and other coins. Welcome to study and research together.
I hope everyone on their investment journey can adhere to their principles, regardless of how the market changes. Stay rational and calm. Deeply understand the characteristics, risks, and return mechanisms of investment products, and do not let short-term market fluctuations affect your emotions. Be patient, avoid excessive greed and fear, and understand that wealth accumulation is a gradual process. Finally, I wish all my followers the ability to see opportunities in their investment journey, making every decision just right, navigating the ocean of investments, and reaping wealth and growth!!!
免责声明:本文章仅代表作者个人观点,不代表本平台的立场和观点。本文章仅供信息分享,不构成对任何人的任何投资建议。用户与作者之间的任何争议,与本平台无关。如网页中刊载的文章或图片涉及侵权,请提供相关的权利证明和身份证明发送邮件到support@aicoin.com,本平台相关工作人员将会进行核查。