Based on the trend of this BTC candlestick chart (combined with multiple indicator lines), the core analysis is as follows:
Trend Status
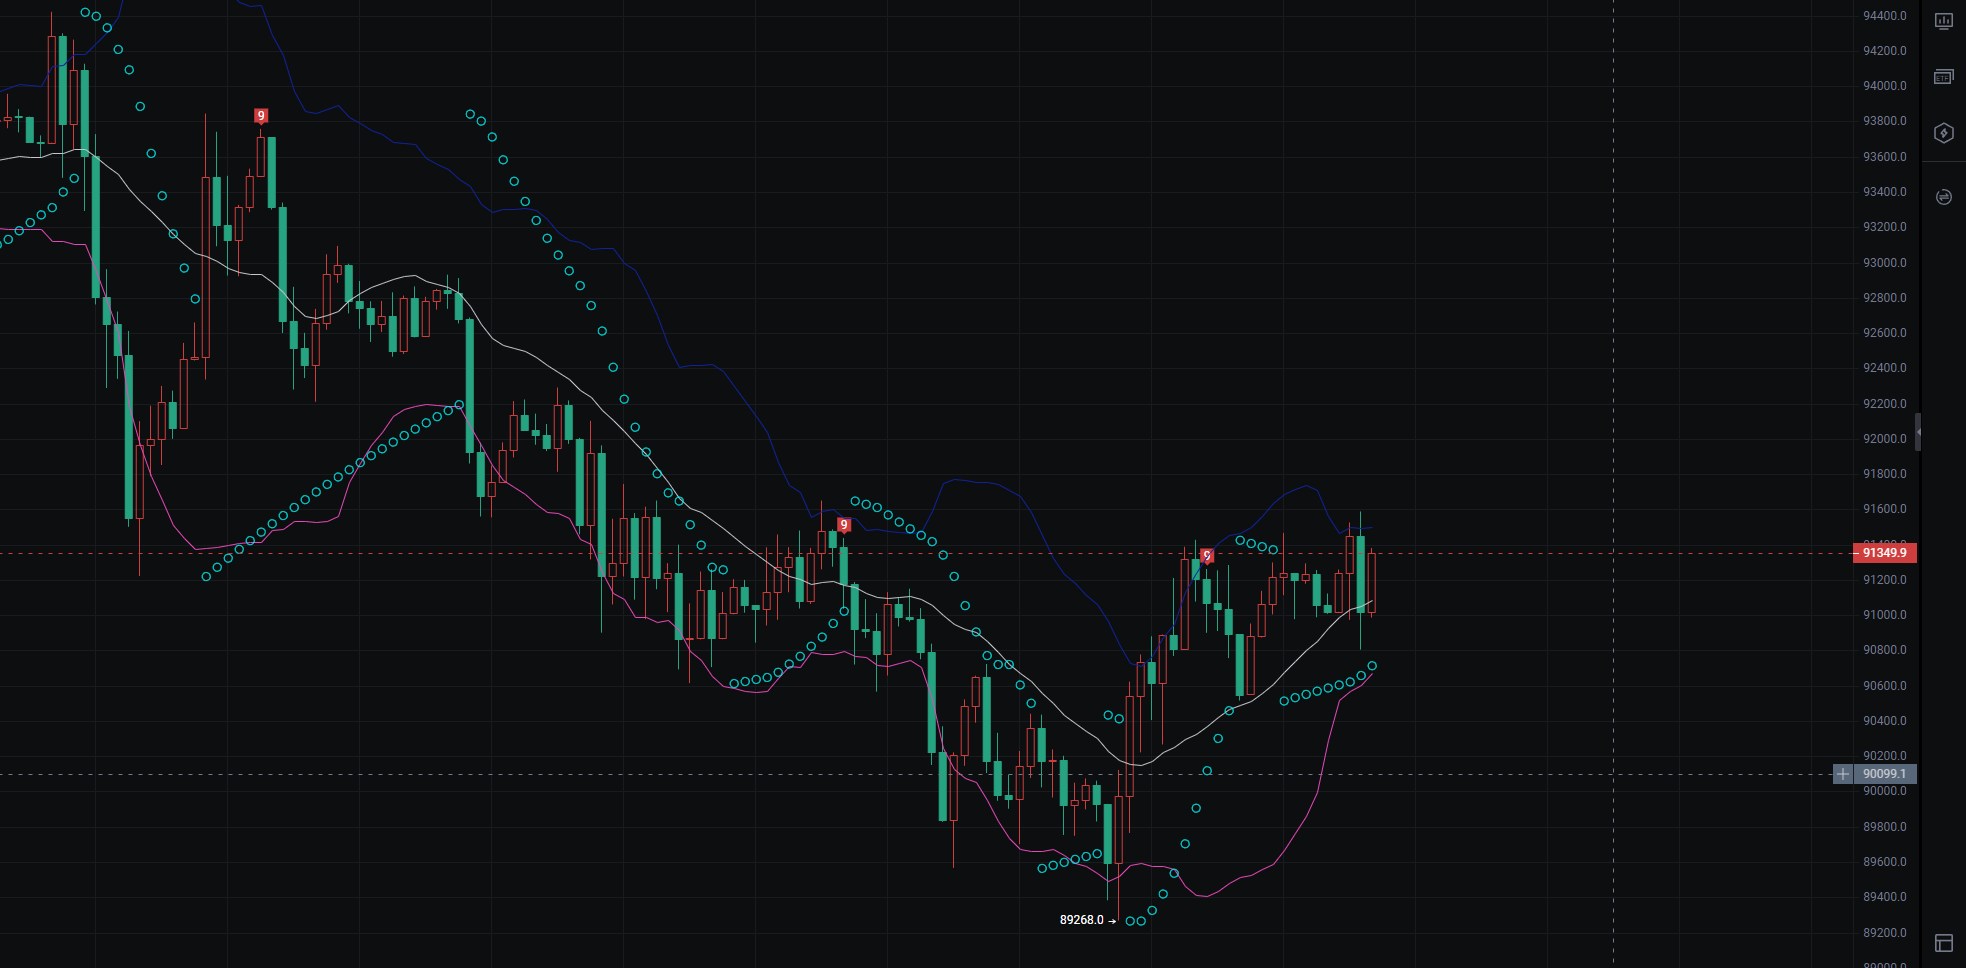
◦ The price first dropped to a stage low of 89268.0, then began to rebound, currently rising to around 91349.9. The indicator pink line and white line are both turning upwards, indicating that short-term bulls are taking the initiative, representing a reversal rebound after a decline, but it still needs to be observed whether it can break through the key resistance level in the medium term.
◦ The previous continuous downtrend has been broken, with the candlesticks closing in the red consecutively and standing above the indicator white line, indicating that bullish momentum is gradually being released; however, a pullback confirmation may still occur during the rebound process.Key Support and Resistance
◦ Support Level: First support at $90500 (red dashed line in the chart + recent consolidation platform), strong support at $89600 (key integer level below + indicator pink line support); if it falls below $89000, the rebound trend may be disrupted.
◦ Resistance Level: First resistance at $91600 (recent rebound high), strong resistance at $92300 (previous consolidation platform + indicator blue line resistance); breaking through $92300 would further open up the rebound space, looking towards around $93500.Trading Operation Tips
◦ In the short term, focus on going long on pullbacks. If the price falls to the $91000-$90099.1 range and stabilizes, long positions can be established, with a stop loss set below $90000.
◦ If the price rebounds to the $91600-$92300 range and meets resistance, a light position can be attempted for short-term short positions, with a stop loss set above $93000, targeting around $90500.
Based on the trend of this candlestick chart (combined with multiple indicator lines), the core analysis is as follows:
Trend Status
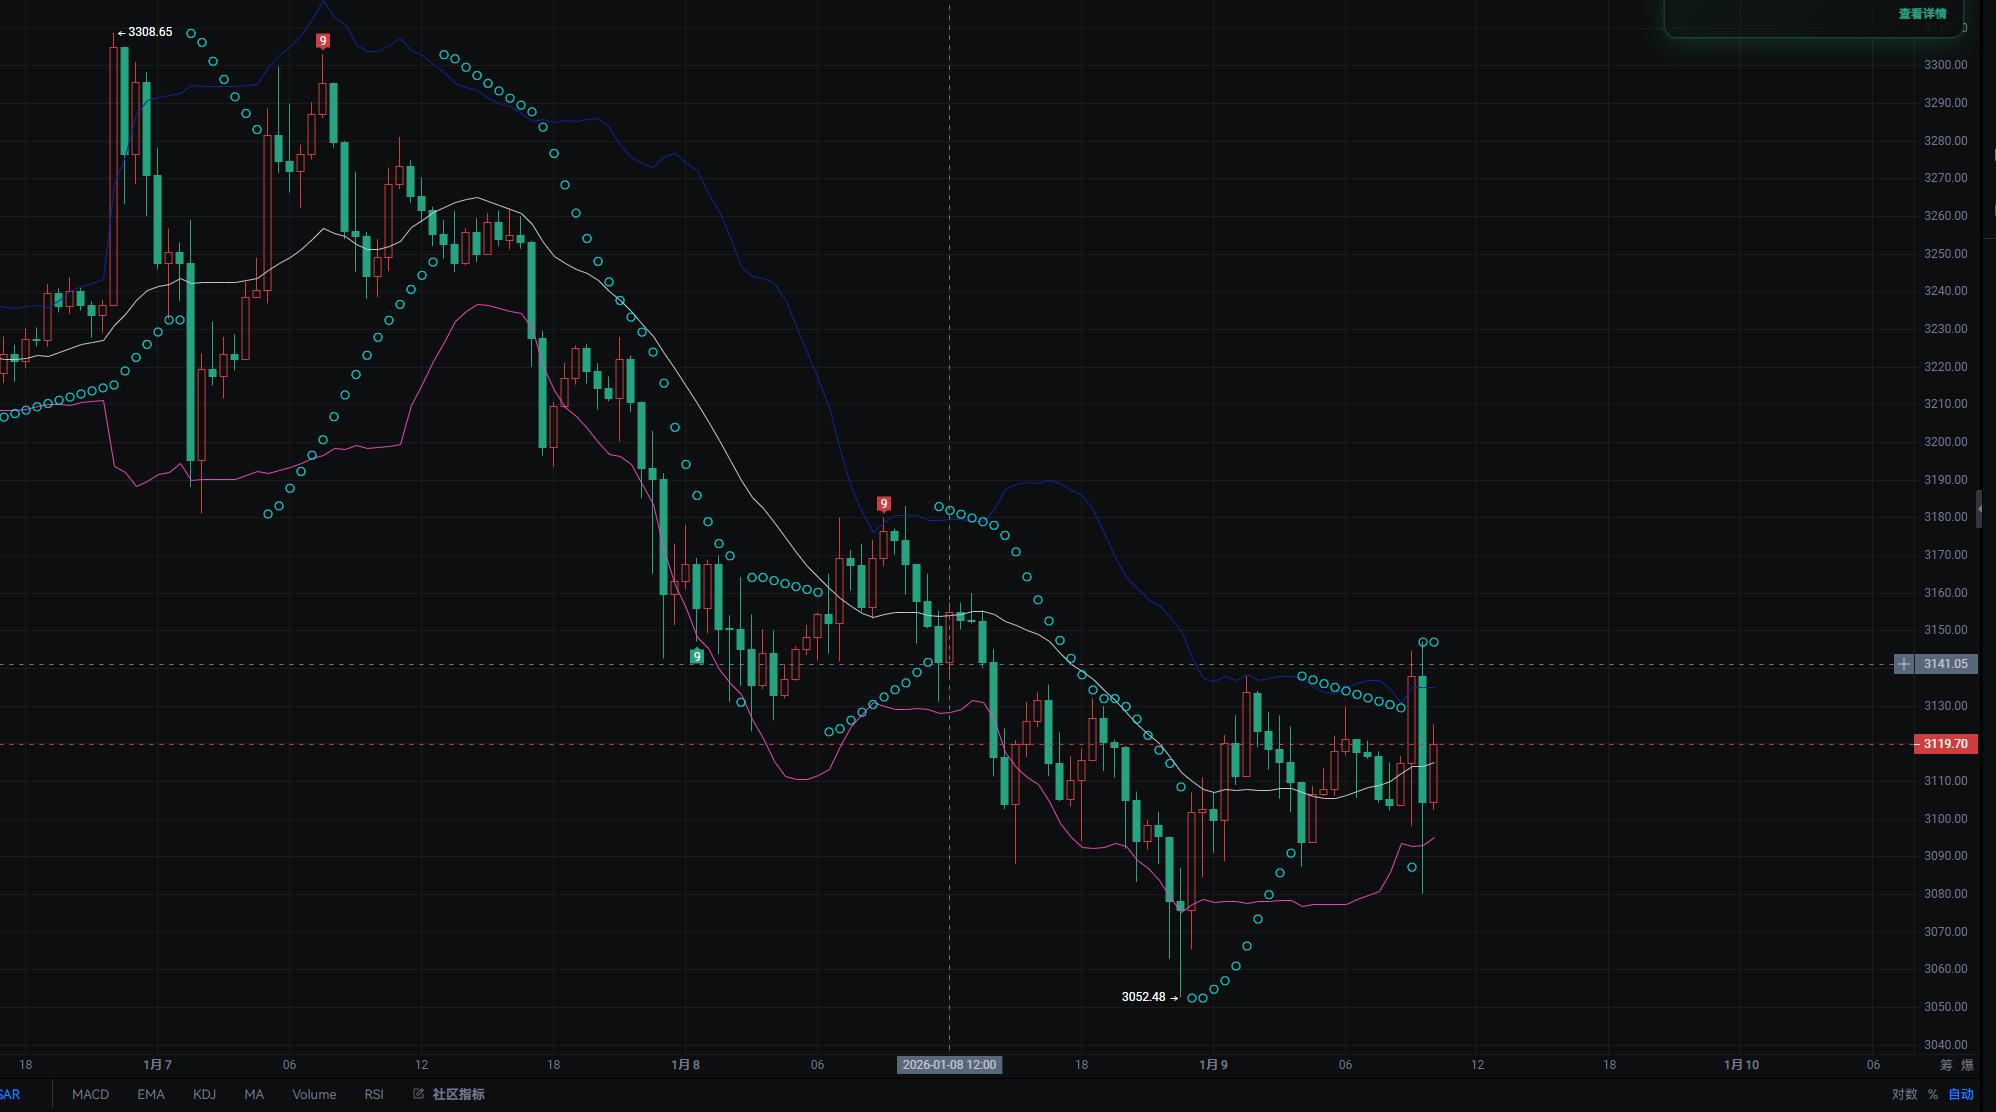
◦ After the price created a new low of 3052.48, it quickly rebounded, currently rising to around 3141.05. The candlestick has formed a long red bar, and the indicator pink line and white line are both turning upwards, indicating that the short-term bearish trend has temporarily paused, and bulls are initiating a rebound from oversold conditions.
◦ The momentum of the previous continuous decline has been fully released at the low point, and the rebound has broken through the key resistance line at 3119.7, indicating a strong willingness for a bullish counterattack; however, it still needs to be seen whether it can stabilize at the key level after the rebound in the medium term.Key Support and Resistance
◦ Support Level: First support at $3080 (recent rebound consolidation platform), strong support at $3050 (important stabilization level after the low point rebound); if it falls below $3050, the rebound trend may quickly retreat.
◦ Resistance Level: First resistance at $3140 (current price level + previous consolidation pressure), strong resistance at $3180 (indicator white line resistance + rebound high during the previous decline); breaking through $3160 would likely see the rebound space looking towards $3180.Trading Operation Tips
◦ In the short term, focus on going long on pullbacks. If the price falls to the $3080-$3060 range and stabilizes, long positions can be established, with a stop loss set below $3040.
◦ If the price rebounds to the $3141-$3180 range and meets resistance, and the candlestick shows a bearish bar with increased volume, a light position can be attempted for shorting, with a stop loss set above $3185, targeting around $3100.
For more real-time quality strategies, follow the public account - Bitcoin Big Bear

免责声明:本文章仅代表作者个人观点,不代表本平台的立场和观点。本文章仅供信息分享,不构成对任何人的任何投资建议。用户与作者之间的任何争议,与本平台无关。如网页中刊载的文章或图片涉及侵权,请提供相关的权利证明和身份证明发送邮件到support@aicoin.com,本平台相关工作人员将会进行核查。