In the cryptocurrency circle, Liying: 3.16ETH 2-hour Bollinger Bands contraction game + MACD bottom divergence, is it a buying signal or a trap to lure more buyers?
Hello, fellow cryptocurrency comrades, I am Liying! Today, we focus on the ETH 2-hour candlestick chart, disassembling the hidden bull-bear game password from three dimensions: Bollinger Bands, MACD, and trading volume. The contraction and oscillation + bottom divergence signal, is it the bottom opportunity at the end of a decline, or a trap to lure buyers during a correction? After reading this, you will find the answer!
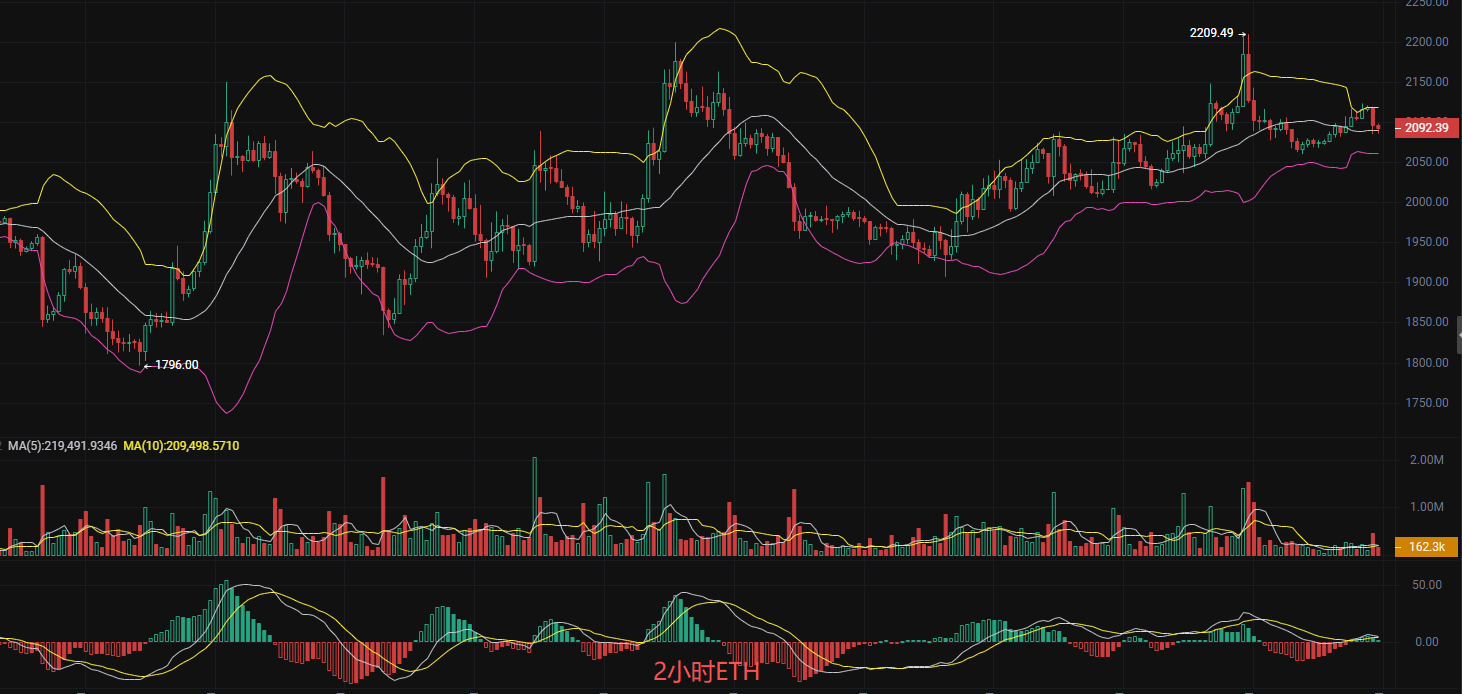
The 2-hour Bollinger Bands show an extreme contraction pattern, with the upper band at 2118, the middle band at 2089, and the lower band at 2060, indicating that the short-term bullish and bearish forces are evenly matched, and the market is entering a silence period. At the low point of 1796, the Bollinger Bands also experienced extreme contraction, followed by a breakthrough of the upper band leading to a surge from 1796 to 2209; after reaching the high point of 2209, the Bollinger Bands contracted again, and the price pulled back to the 2050 range, completing a cycle of contraction-expansion-contraction.
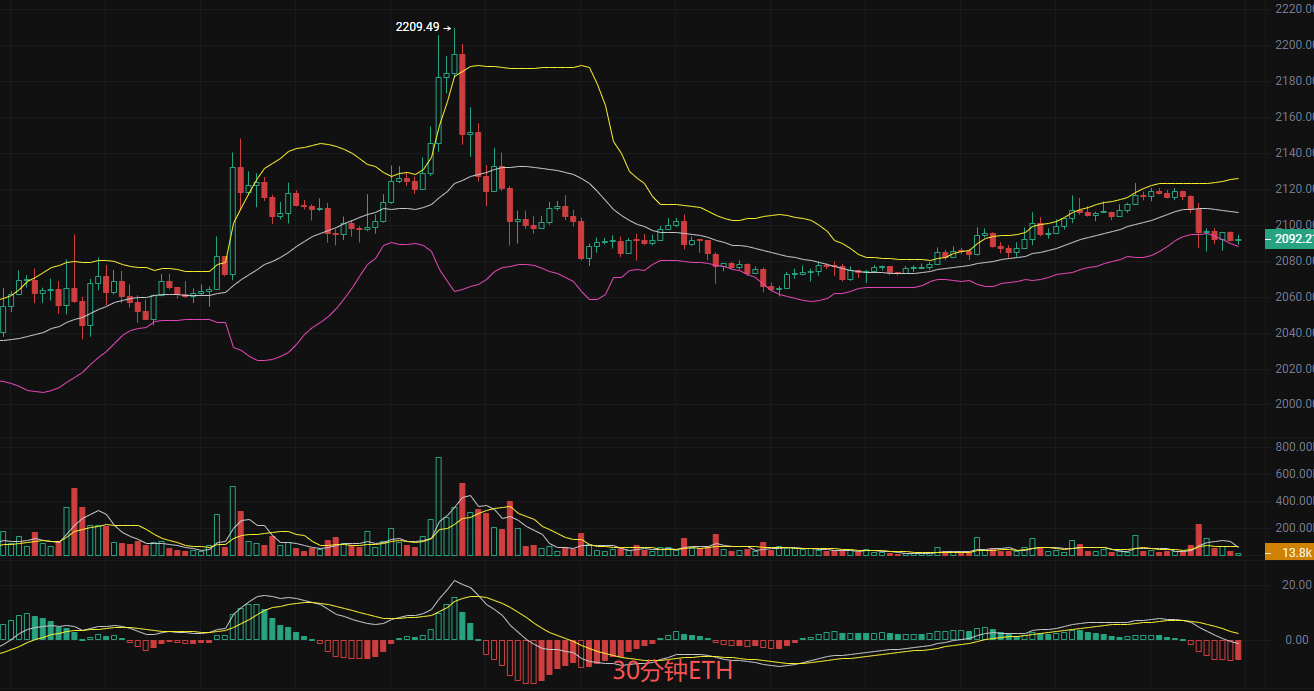
Liying believes our opportunity lies in the Bollinger Bands contracting again. If the price breaks above the upper band at 2118, it is highly likely to initiate a new round of increases; if it breaks below the lower band at 2060, it may continue to pull back to the 2000 mark or even lower. The initial appearance of MACD bottom divergence shows that bullish momentum is temporarily dominant over price pullbacks, and the momentum has not reached a new low, which is a warning signal for a short-term bottoming or even a reversal!
Short-term practical strategy (personally taught by Liying, accurately matching the charts)
Bullish approach: Light long position at 2060-2070, stop loss at 2030, aim for a position increase after breaking through 2110 targeting above 2200
Bearish approach: Light short position below 2060-2040, stop loss above 2080, target 2000-1950
The cryptocurrency circle is never short of opportunities, what is lacking is hardcore analysis that is "understandable, keep up, and can hold". Follow me, as I break down the bull-bear codes of BTC, ETH, and mainstream coins daily, guiding you through the bull and bear markets with a professional perspective, turning the market into a "cash machine"!
(If you find the analysis useful, remember to like + bookmark + follow, your support is my motivation for continuous output!)
Interactive topic: Do you think the probability of ETH breaking above the upper band this time is high? Leave your thoughts in the comments, and let's discuss together!

Note: The above analysis is only a technical logical deduction by Liying and does not constitute investment advice. The market is risky, and investment should be cautious.
免责声明:本文章仅代表作者个人观点,不代表本平台的立场和观点。本文章仅供信息分享,不构成对任何人的任何投资建议。用户与作者之间的任何争议,与本平台无关。如网页中刊载的文章或图片涉及侵权,请提供相关的权利证明和身份证明发送邮件到support@aicoin.com,本平台相关工作人员将会进行核查。