The daily chart places bitcoin within the same verified intraday band, with price activity holding between $71,389 and $74,387 during the latest session. The market remained positioned in the upper section of that range as trading clustered around the $73,000–$74,000 area.
Reference levels visible on the chart include higher markers at 75,000, 83,500, and 87,500, while lower reference levels appear around 73,500, 73,000 and the 72,500 region. Within that context, the daily timeframe reflects price stabilization inside the broader range rather than a decisive move beyond the session high.

BTC/USD 1-day chart via Bitstamp on March 16, 2026.
On the four-hour chart, price activity shows bitcoin consolidating near the $73,800–$73,851 region based on Bitstamp movements. The chart’s recent ticks indicate sequential trades within that narrow band, suggesting short-term compression after the earlier push toward the upper end of the session range. Short-term price structure remains above several lower moving-average clusters referenced in the data set between roughly $68,000 and $72,000. The four-hour timeframe, therefore, reflects sideways movement near resistance rather than a retracement back toward deeper support levels.
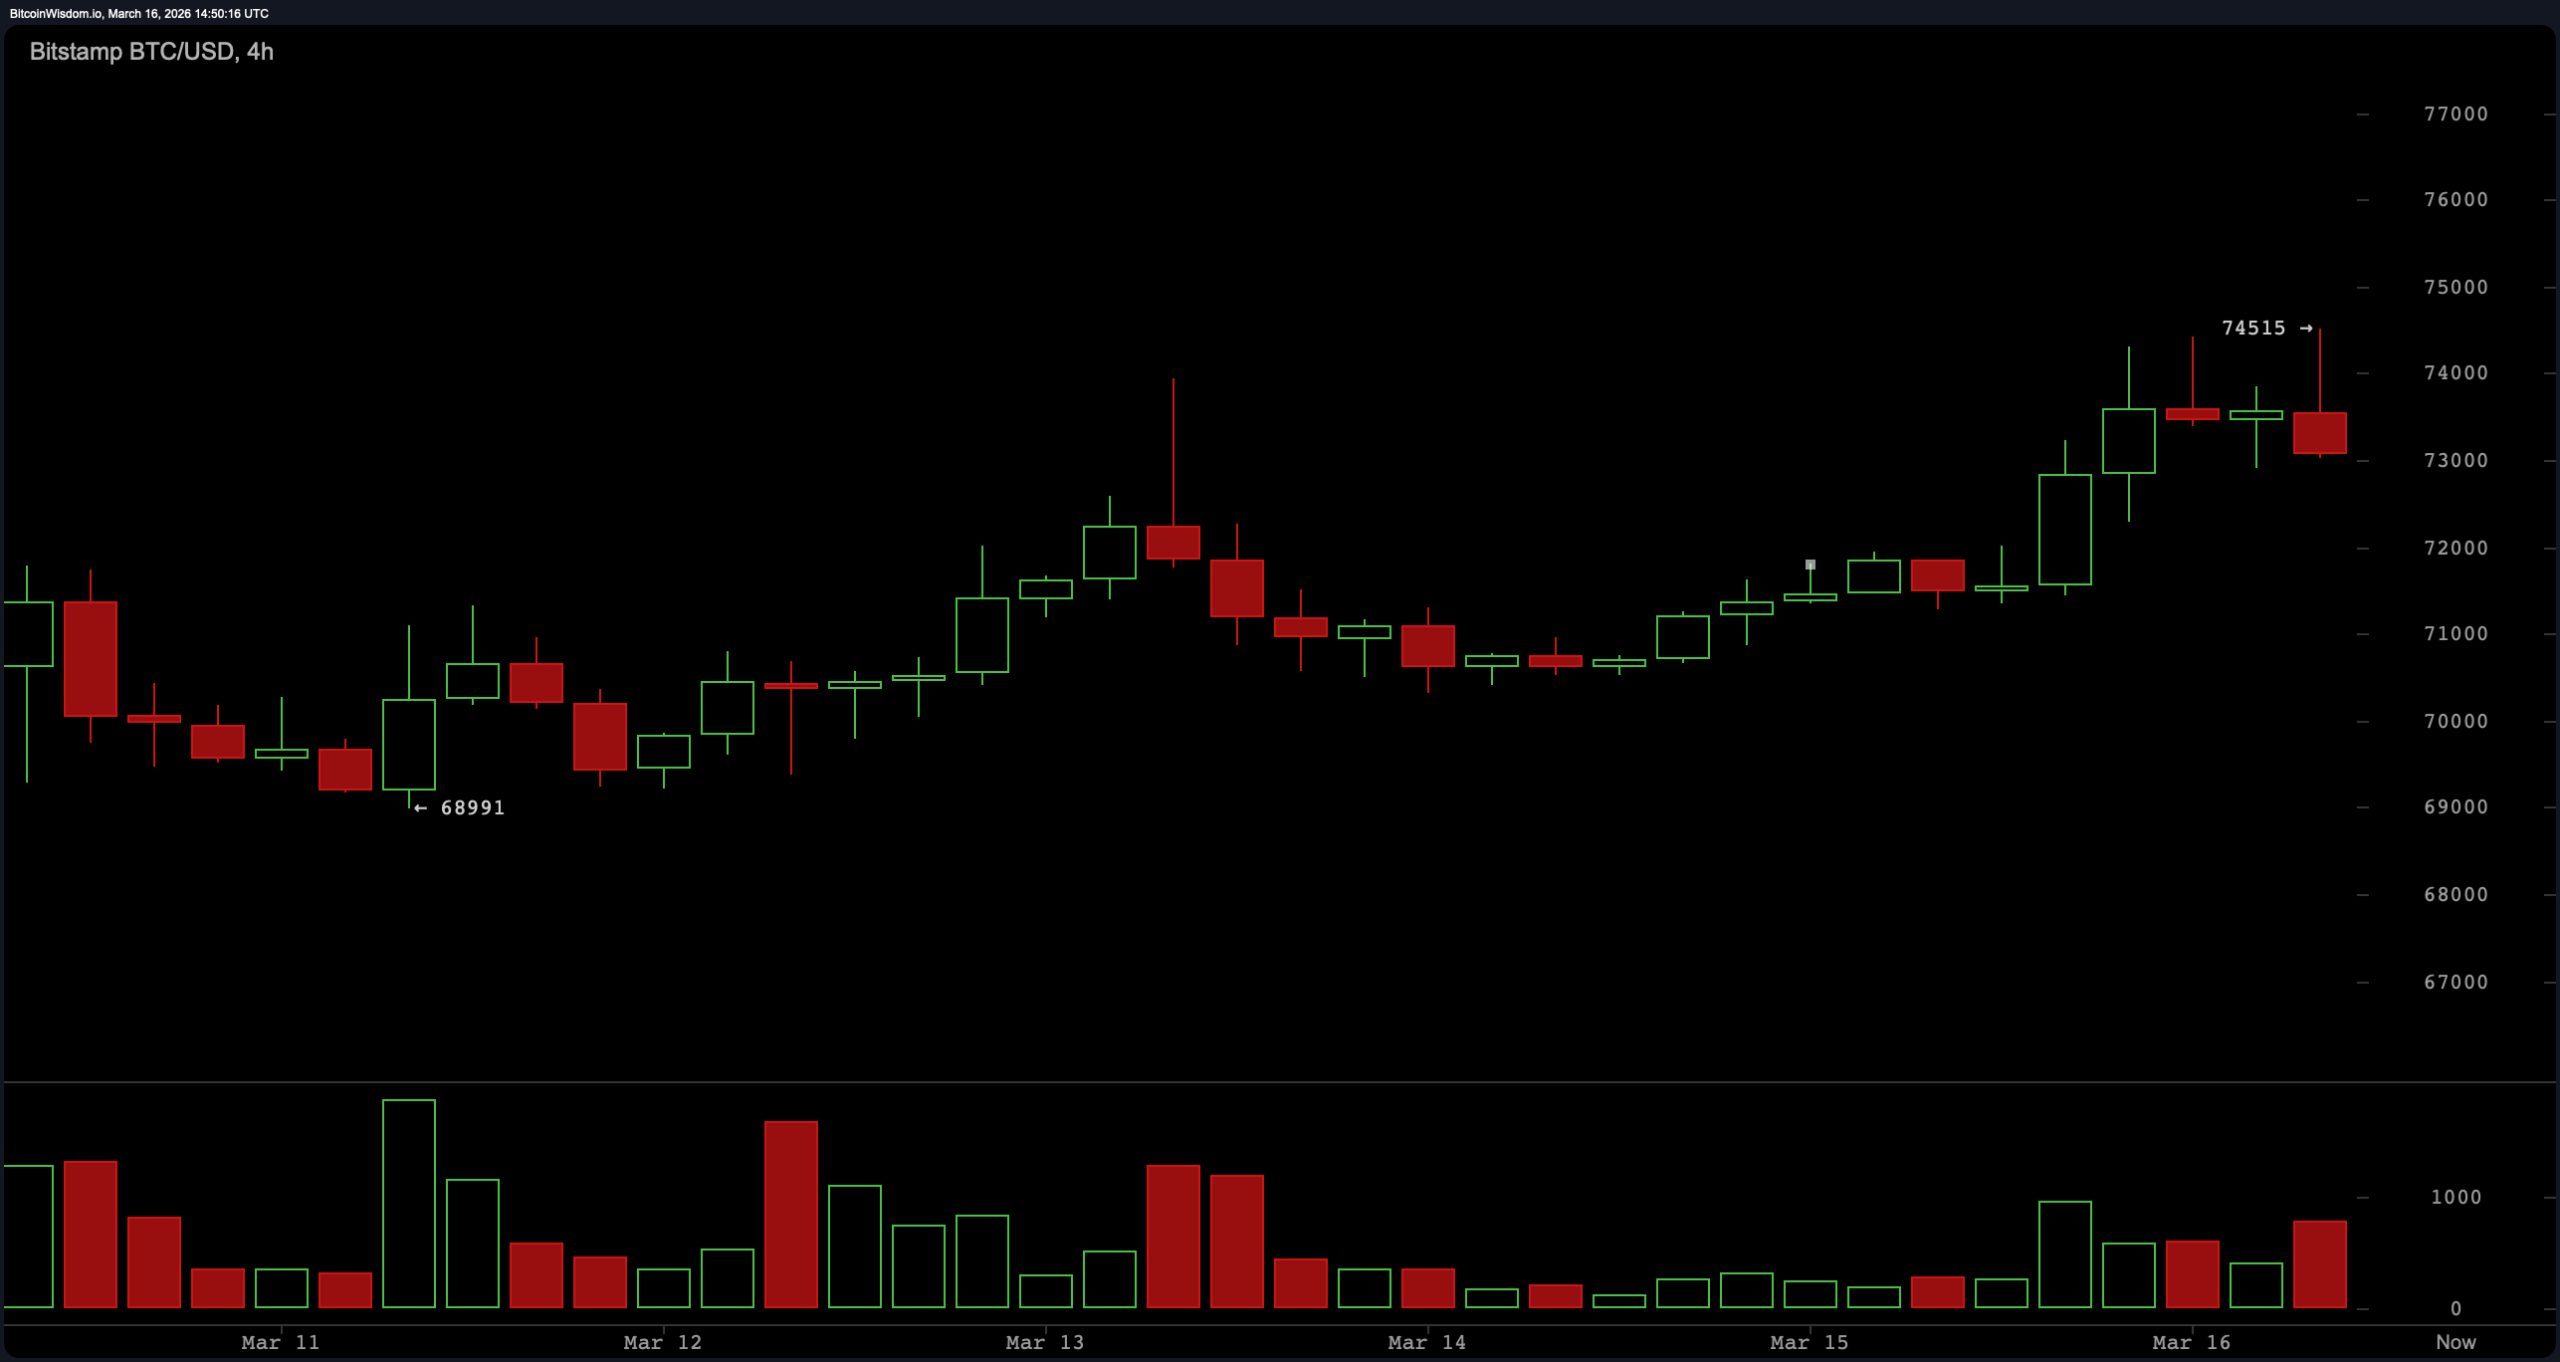
BTC/USD 4-hour chart via Bitstamp on March 16, 2026.
The one-hour chart illustrates similar short-term consolidation with price continuing to fluctuate in the upper $73,000 zone. Immediate order-book levels showed the most recent trades between approximately $73,800 and $73,851, with buy and sell averages recorded near $73,829 and $73,791, respectively. Those levels place current trading slightly above both averages, though the difference remains minimal. The hourly timeframe, therefore, reflects narrow price movement within a defined band, with the market hovering just below the session’s high-water mark.

BTC/USD 1-hour chart via Bitstamp on March 16, 2026.
Oscillator readings remain broadly neutral overall. The relative strength index ( RSI) printed 59, while the Stochastic measured 80 and the commodity channel index (CCI) registered 142, each categorized as neutral in the data set. The average directional index (ADX) stood at 25, also labeled neutral, suggesting only moderate trend strength.
The Awesome oscillator recorded 3,282 and likewise remained neutral. Two indicators diverged slightly from the neutral cluster: the momentum indicator (10) registered 5,076 and the moving average convergence divergence ( MACD) level (12, 26) printed 364, both signaling positive momentum in the technical summary.
Moving averages skew supportive on shorter periods, while longer-term levels remain above the current price. The exponential moving average (EMA) and simple moving average (SMA) show the EMA (10) at $70,818 and SMA (10) at $70,054; EMA (20) at $70,012 and SMA (20) at $69,175; EMA (30) at $70,447 and SMA (30) at $68,476; and EMA (50) at $72,799 with SMA (50) at $71,119.
Longer-term averages remain elevated, including EMA (100) at $79,412 and SMA (100) at $80,613, alongside EMA (200) at $87,686 and SMA (200) at $93,738. Overall signals in the data summary remain positive.
Bull Verdict:
Bitcoin remains positioned near the upper portion of its 24-hour range while maintaining distance above several short-term moving averages between roughly $68,000 and $72,000. Momentum indicators, including the moving average convergence divergence ( MACD) and the momentum indicator (10), register positive signals, while the relative strength index ( RSI) holds below overbought territory at 59. With price consolidating just below the session high of $74,387.36 and above the 50-period exponential moving average (EMA) at $72,799, the short-term technical structure reflects stability near resistance rather than deterioration. If price maintains its position above the cluster of shorter moving averages, the chart structure suggests continued testing of the upper range.
Bear Verdict:
Despite trading near the upper portion of the daily range, bitcoin remains below several longer-term moving averages that continue to sit significantly above current price levels. The 100-period exponential moving average (EMA) at $79,412, the 100-period simple moving average (SMA) at $80,613, the 200-period EMA at $87,686, and the 200-period SMA at $93,738 all remain overhead. Oscillators broadly categorized as neutral — including the relative strength index ( RSI), stochastic %K, commodity channel index (CCI), average directional index (ADX), and the Awesome oscillator — indicate limited trend strength. With price consolidating just below the session high rather than moving beyond it, the market continues to trade within its defined range rather than establishing a confirmed breakout.
- What is bitcoin’s price on March 16, 2026?
Bitcoin traded around $73,764 on March 16, 2026, around 11:15 a.m. EST, within a 24-hour range of $71,389.65 to $74,387.36. - Is bitcoin trending up or down right now?
Short-term charts show bitcoin consolidating near the upper portion of its daily range while holding above several shorter-term moving averages. - What do bitcoin’s technical indicators show today?
Most oscillators remain neutral, while momentum and moving average convergence divergence ( MACD) indicators register positive momentum signals. - What key levels are traders watching for bitcoin?
The current session high near $74,387 acts as immediate resistance, while nearby support levels appear around $73,500, $73,000 and $72,500.
免责声明:本文章仅代表作者个人观点,不代表本平台的立场和观点。本文章仅供信息分享,不构成对任何人的任何投资建议。用户与作者之间的任何争议,与本平台无关。如网页中刊载的文章或图片涉及侵权,请提供相关的权利证明和身份证明发送邮件到support@aicoin.com,本平台相关工作人员将会进行核查。


