Welcome to the Qinglan Crypto Class, I am Sister Qinglan. Let's get straight to the point! Today we will continue to analyze from four time frames, all real talk!
Step 1: Trend Judgment
Let's look from big to small!
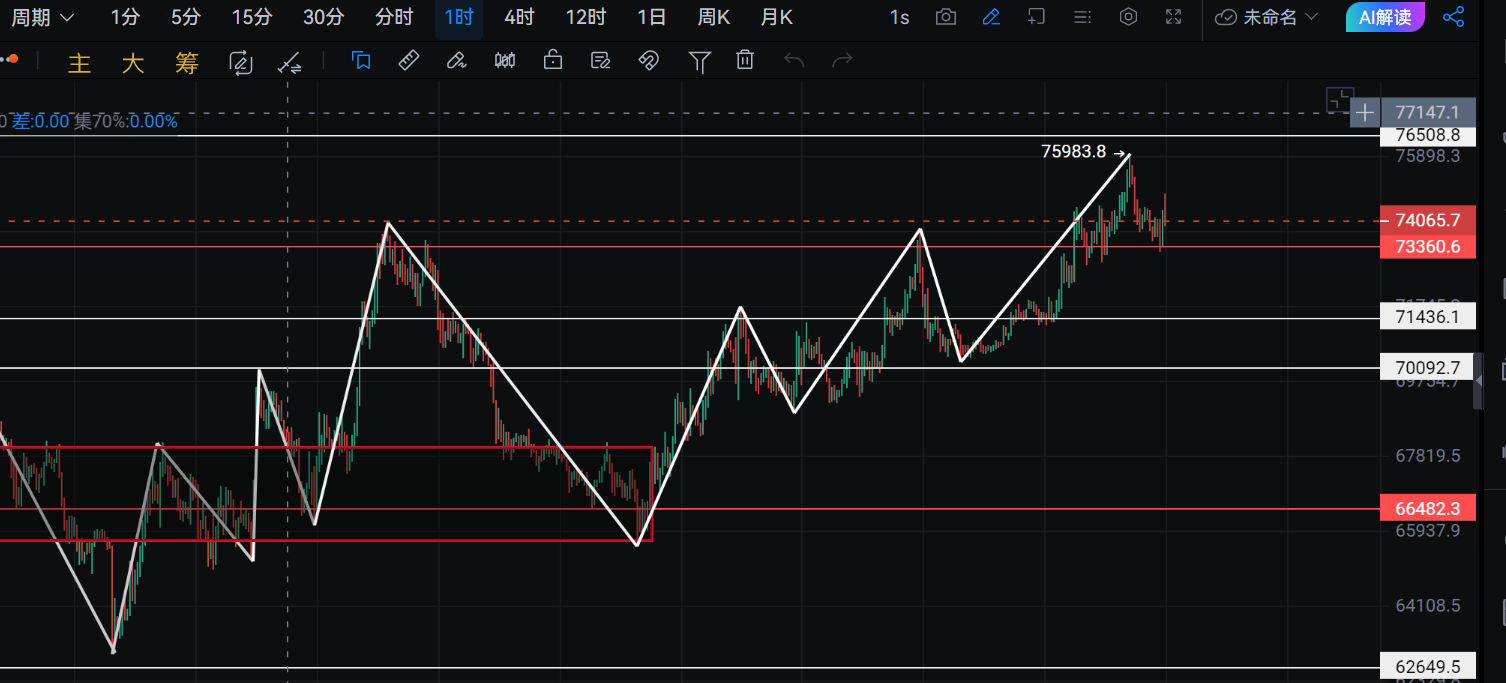
Daily Time Frame: The overall trend is definitely upward! You see MA5, MA10, MA30 are all in a bullish arrangement, and the price is steadily above all moving averages. The key resistance level is around 76000, which is the barrier often mentioned in the news at 75,000 dollars. The support level is initially around 73000. On-chain data shows the total market cap is increasing, but the fear and greed index is only 28, still in "fear"! What does this indicate? The price has risen so high, but everyone is still scared, indicating a bit of divergence between sentiment and price, so we must be careful.
4-Hour Time Frame: The medium-term trend is also strongly upward! The moving averages are also beautifully in a bullish arrangement. The resistance level is at the previous high of 76000, and the support level is around 73500. RSI has reached 87.54, which is seriously overbought! The news states, "Bitcoin breaks through the 75000 dollar threshold," but on-chain sentiment is fearful, this divergence suggests that the medium-term upward trend may be a bit "inflated," and the pressure for a correction is building.
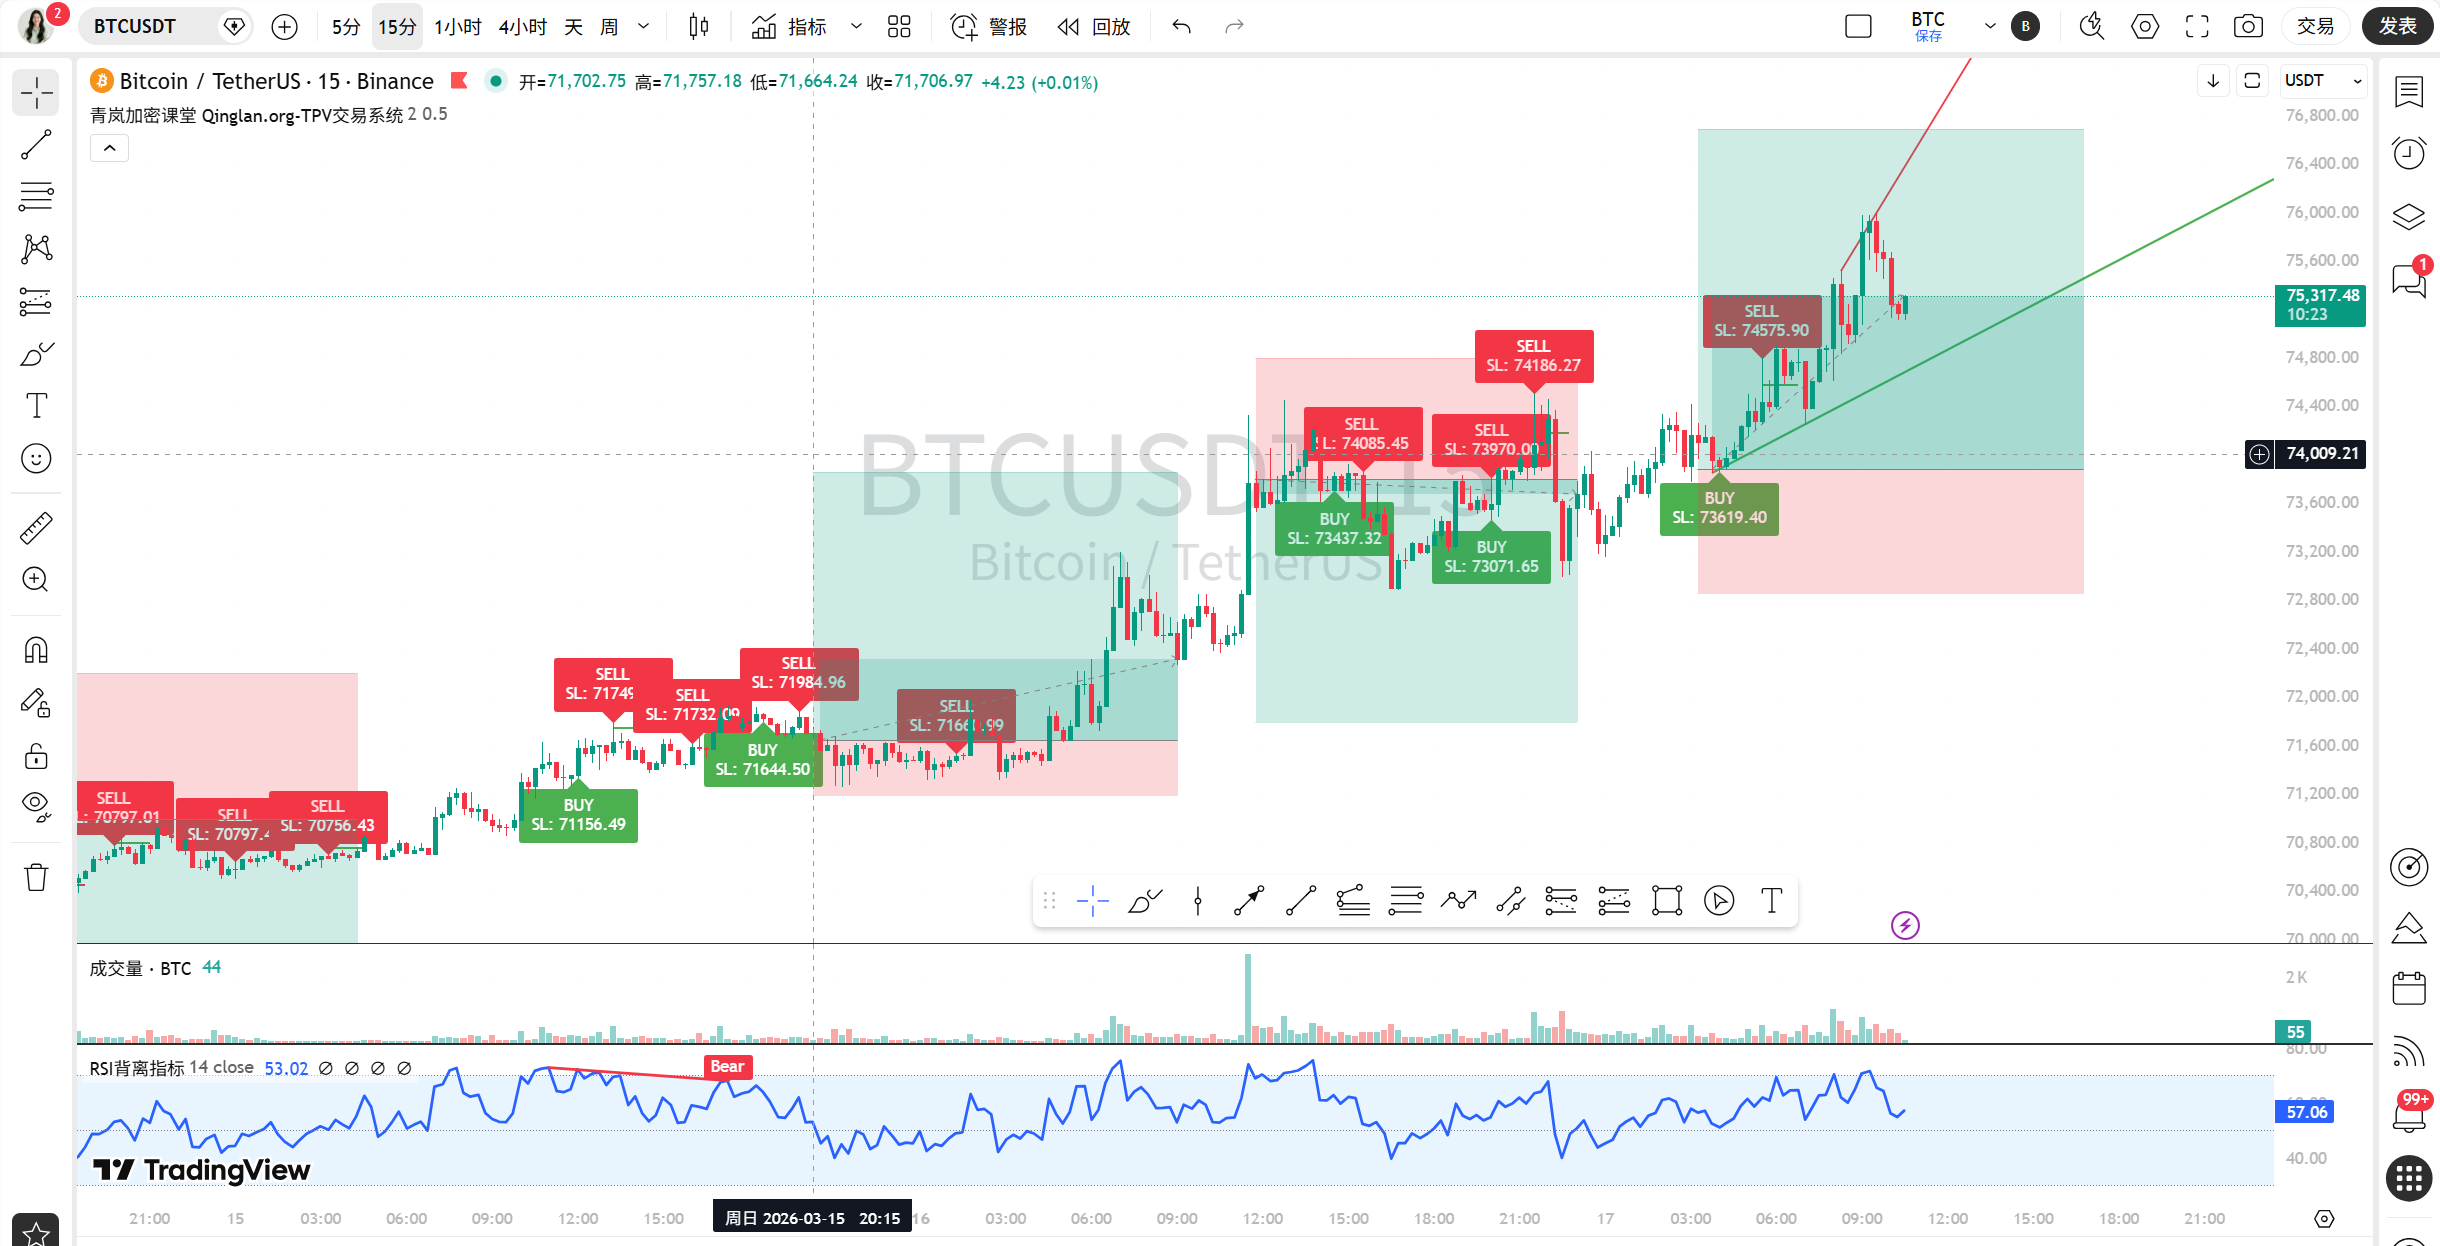
1-Hour Time Frame: The short-term trend is high-level fluctuations after an upward move. The moving averages are in a bullish arrangement, but the price is swaying around 75000. The resistance level is at 75500, and the support level is at 74800. The news mentions "75,000 dollars is a key resistance, and market concentration is unprecedented," which corresponds exactly to the upper edge of this fluctuation range, indicating that there is intense fighting between bulls and bears here.
15-Minute Time Frame: The ultra-short-term trend is small-range fluctuations. Although the moving averages are in a bullish arrangement, the MACD has already crossed to the downside! The resistance level is at 75400, and the support level is at 75200. This level is very sensitive; any news about ETF fund inflows or outflows (such as "daily net inflow of 180 million dollars") could trigger a slight jump.
Step 2: Key Level Identification and Reversal Patterns
Daily: No clear large-scale reversal patterns have been observed for now. But we need to be vigilant about the possibility of a "double top" forming near 76000, as both the news and options market are focused on this level.
4-Hour: Must observe closely! RSI is severely overbought, if the price rises to around 76000 and then retreats, it may form a "top divergence" (price makes a new high while RSI declines). This may be a psychological resistance catalyzed by news like "institutional funds pushing... but facing pressure to break through."
1-Hour: Currently resembling a "rising flag" consolidation, in the range of approximately 74800-75500. If it breaks below the lower edge of the flag, combined with news about "whales' short positions underwater," it may trigger a short-term pullback.
15-Minute: The pattern is not obvious; it's just narrow consolidation. The current price is testing a small resistance near 75300.
Step 3: Technical Indicator Verification
Daily: MACD has crossed upwards, the histogram is long and the momentum is strong! RSI is at 67, neutral but slightly strong. On-chain total market cap increased by 3.83%, verifying that the rise has funding support.
4-Hour: MACD has crossed upwards, and the histogram is also long, but RSI 87.54 is extremely overbought! This is a strong warning signal, indicating that the upward momentum may be exhausted in the short term. It requires expanding trading volume to maintain; otherwise, it's easy to pull back.
1-Hour: MACD has crossed upwards, but the histogram (96.6) is much weaker than the 4-hour (279), indicating waning momentum. RSI is at 67.7, still relatively healthy. The indicators suggest a short-term oscillation rather than a unilateral sharp surge.
15-Minute: MACD has crossed down! The histogram has turned negative, which is the most direct signal of short-term weakening. RSI is at 56.74, neutral. This small time frame indicator matches the "price high-level oscillation" state.
Step 4: On-Chain and News Combined Analysis
News:
There are quite a few bullish factors! "Bitcoin ETF has attracted funds for 5 consecutive days," "institutional funds pushing," "BlackRock ETF is the fourth globally," these are all solid funding positives, supporting the market.
There are also bearish factors! "75,000 dollar key resistance," "market concentration is unprecedented," indicating great pressure above, and any slight movements could lead to profit-taking. The "fear and greed index" indicating fear also reflects the cautious mindset of retail investors.
Overall, the news presents a mix of bullish and bearish, but the funding side leans bullish. This explains why the price can rise despite fear, but hesitates at key resistance levels.On-Chain Data:
The fear and greed index is 28 (fear) and severely diverges from the new price high! This is currently the biggest contradiction, usually indicating that the market is driven by a small number of large funds (institutions), and retail investors have not kept pace, indicating an unstable foundation.
BTC dominance is at 56.93%, still very high, indicating that funds are concentrated in Bitcoin, and opportunities for altcoins may not have fully arrived.
The total market cap is 2.65 trillion, up 3.83% in 24 hours, with volume and price rising together, which is relatively healthy. However, combined with fear sentiment, the sustainability of this rise raises questions.
Step 5: Market Prediction and Trading Ideas
Current (within a few hours): The ultra-short-term (15 minutes to 1 hour) is expected to continue oscillating between 75200-75500, with unclear direction, so focus more on observing and less on acting.
Today and the key in the near future: The most important position today is the resistance zone of 75500-76000! If it can forcefully break through 76000 with the good news of "ETF fund inflow," the next target is 77000. The key support is at 74800; if it falls below, it may quickly retrace to 74000 or even 73500 (4-hour moving average support).
Trading Ideas:
Trend-following opportunity: The main trend is upward, so it is safer to wait for a pullback to go long. If the price stabilizes in the area of 74800-74500 and the 1-hour RSI returns to around 50, consider taking a small long position with a target of 75500.
Counter-trend opportunity: Aggressive traders can focus on resistance signals near 76000. If the price pushes above 75900 but the 4-hour RSI shows a noticeable decline (top divergence) simultaneously with a second MACD cross to the downside in the 15-minute timeframe, a very small position can be tried for a short, with a strict stop loss above 76100, targeting 75200. This is a risky strategy and beginners should definitely stay away!
Wait and Observe: The current price is below key resistance, the indicators show divergence, and sentiment is fearful. The best strategy may be to wait and see, to follow the market direction after a breakthrough above 76000 or a breakdown below 74800.
Summary: The core contradiction currently in the market is the "new high driven by institutional funds" and the "widespread fear sentiment" showing great divergence!
Trading Adage: The market is born from despair, rises in hesitation, and ends in exuberance. We are now at the crossroads of "hesitation" and "exuberance"!
Alright, that's it for today's analysis, see you next time! Remember, control your position size and set good stop losses!
More quantifiable breakdowns on the impact of real-time news on market sentiment have been updated in my Qinglan Crypto Class: www.qinglan.org
免责声明:本文章仅代表作者个人观点,不代表本平台的立场和观点。本文章仅供信息分享,不构成对任何人的任何投资建议。用户与作者之间的任何争议,与本平台无关。如网页中刊载的文章或图片涉及侵权,请提供相关的权利证明和身份证明发送邮件到support@aicoin.com,本平台相关工作人员将会进行核查。