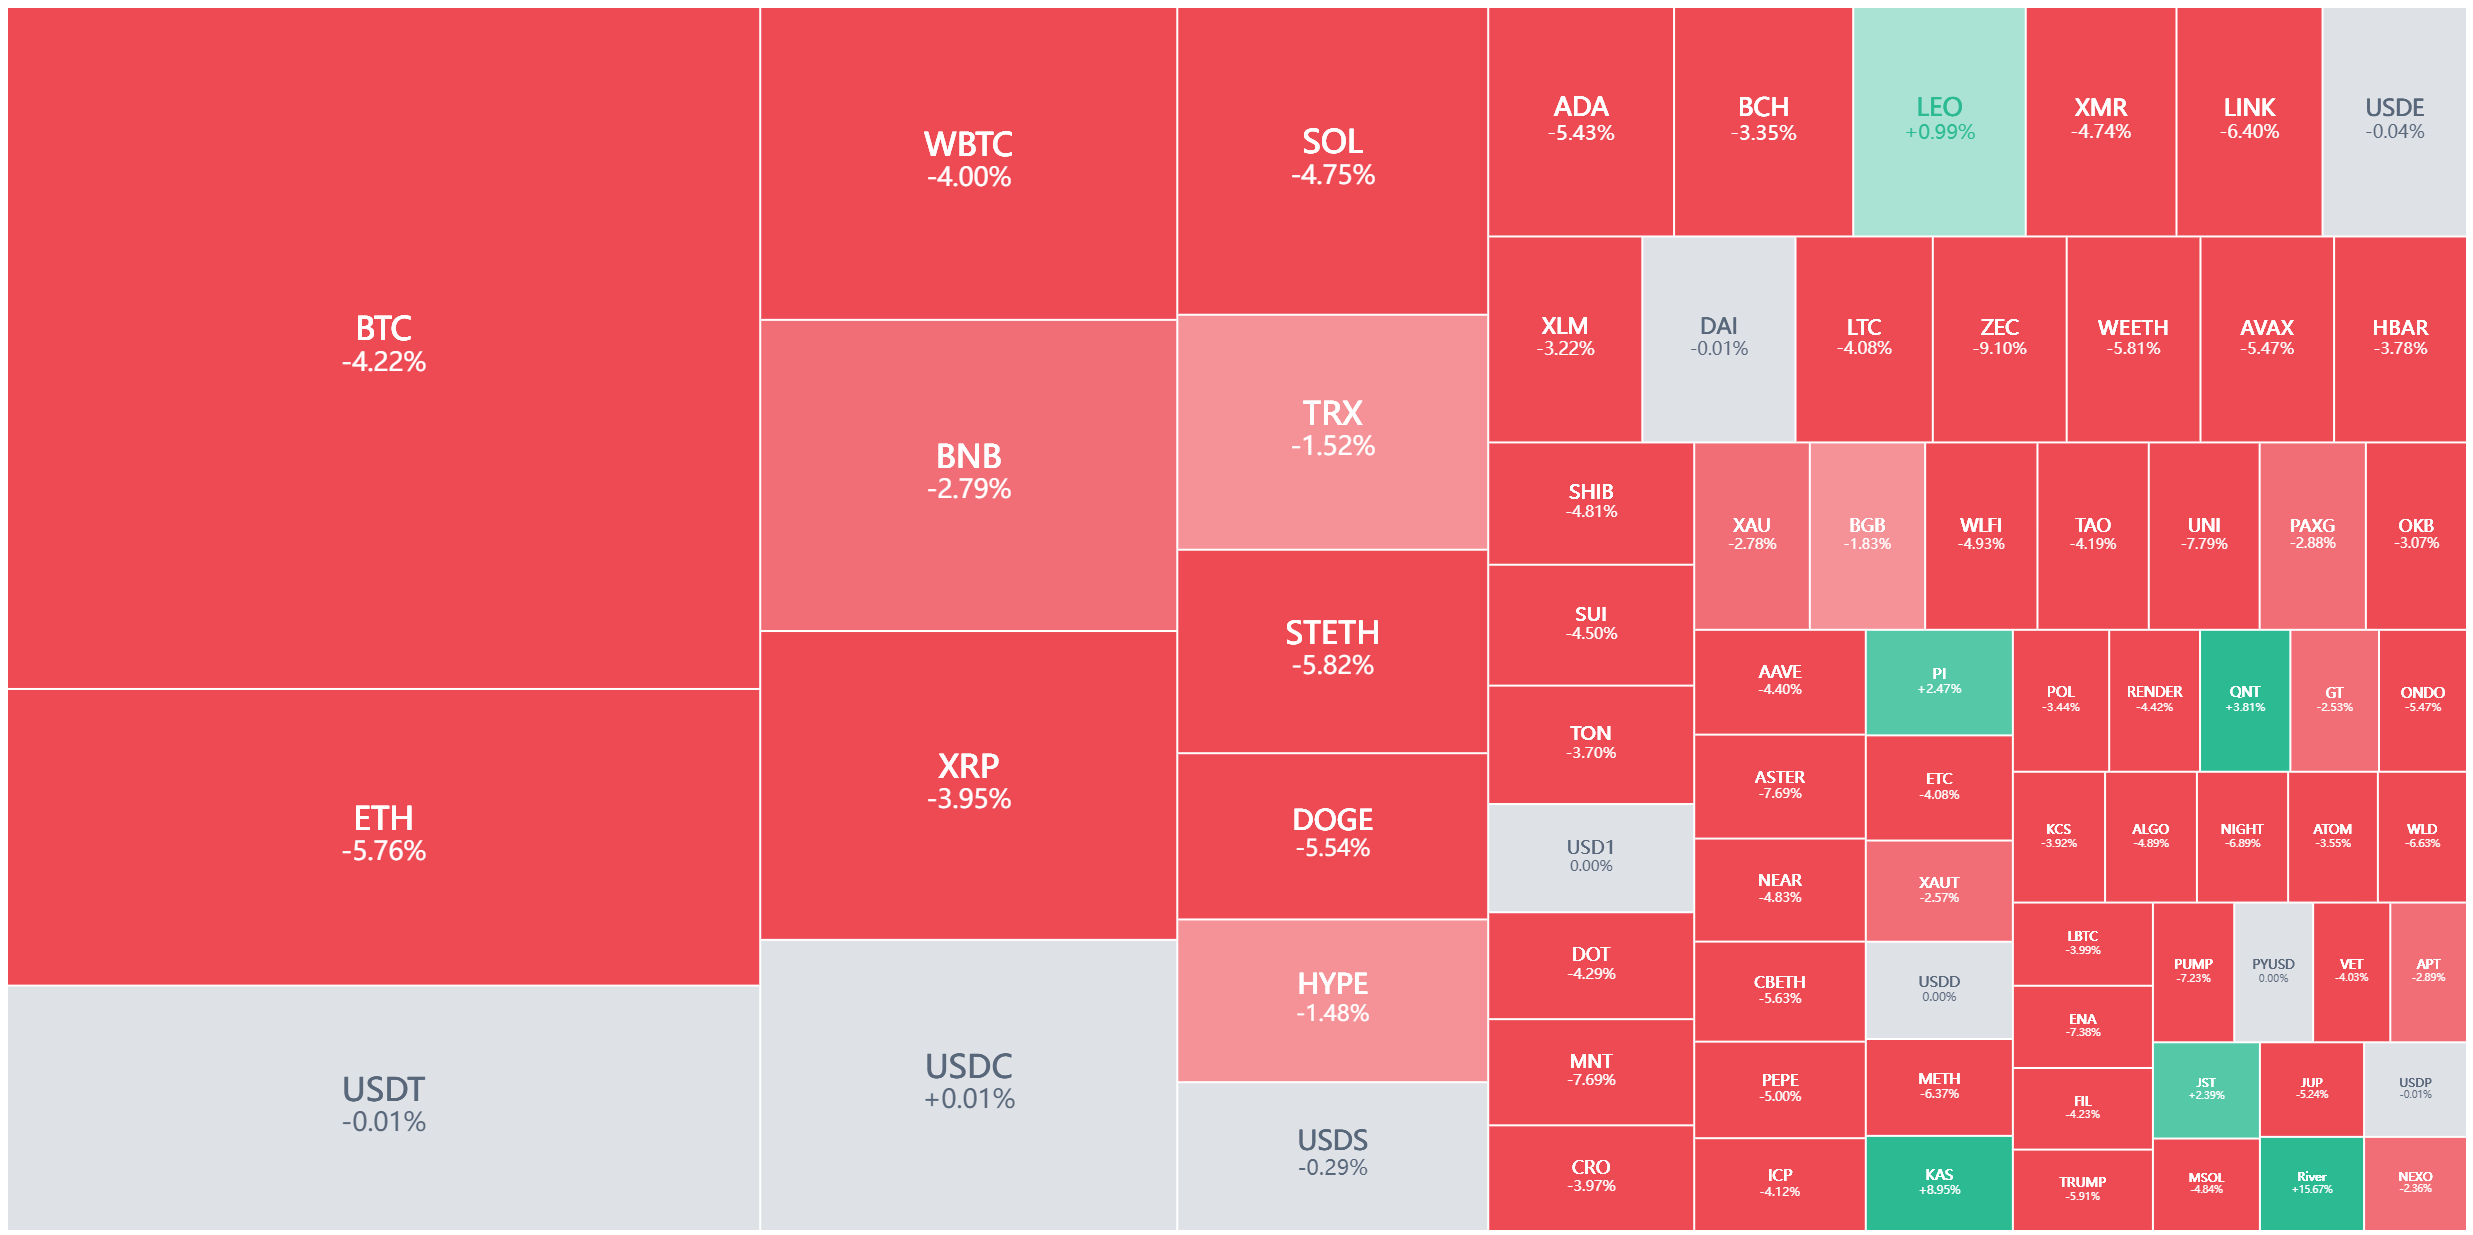
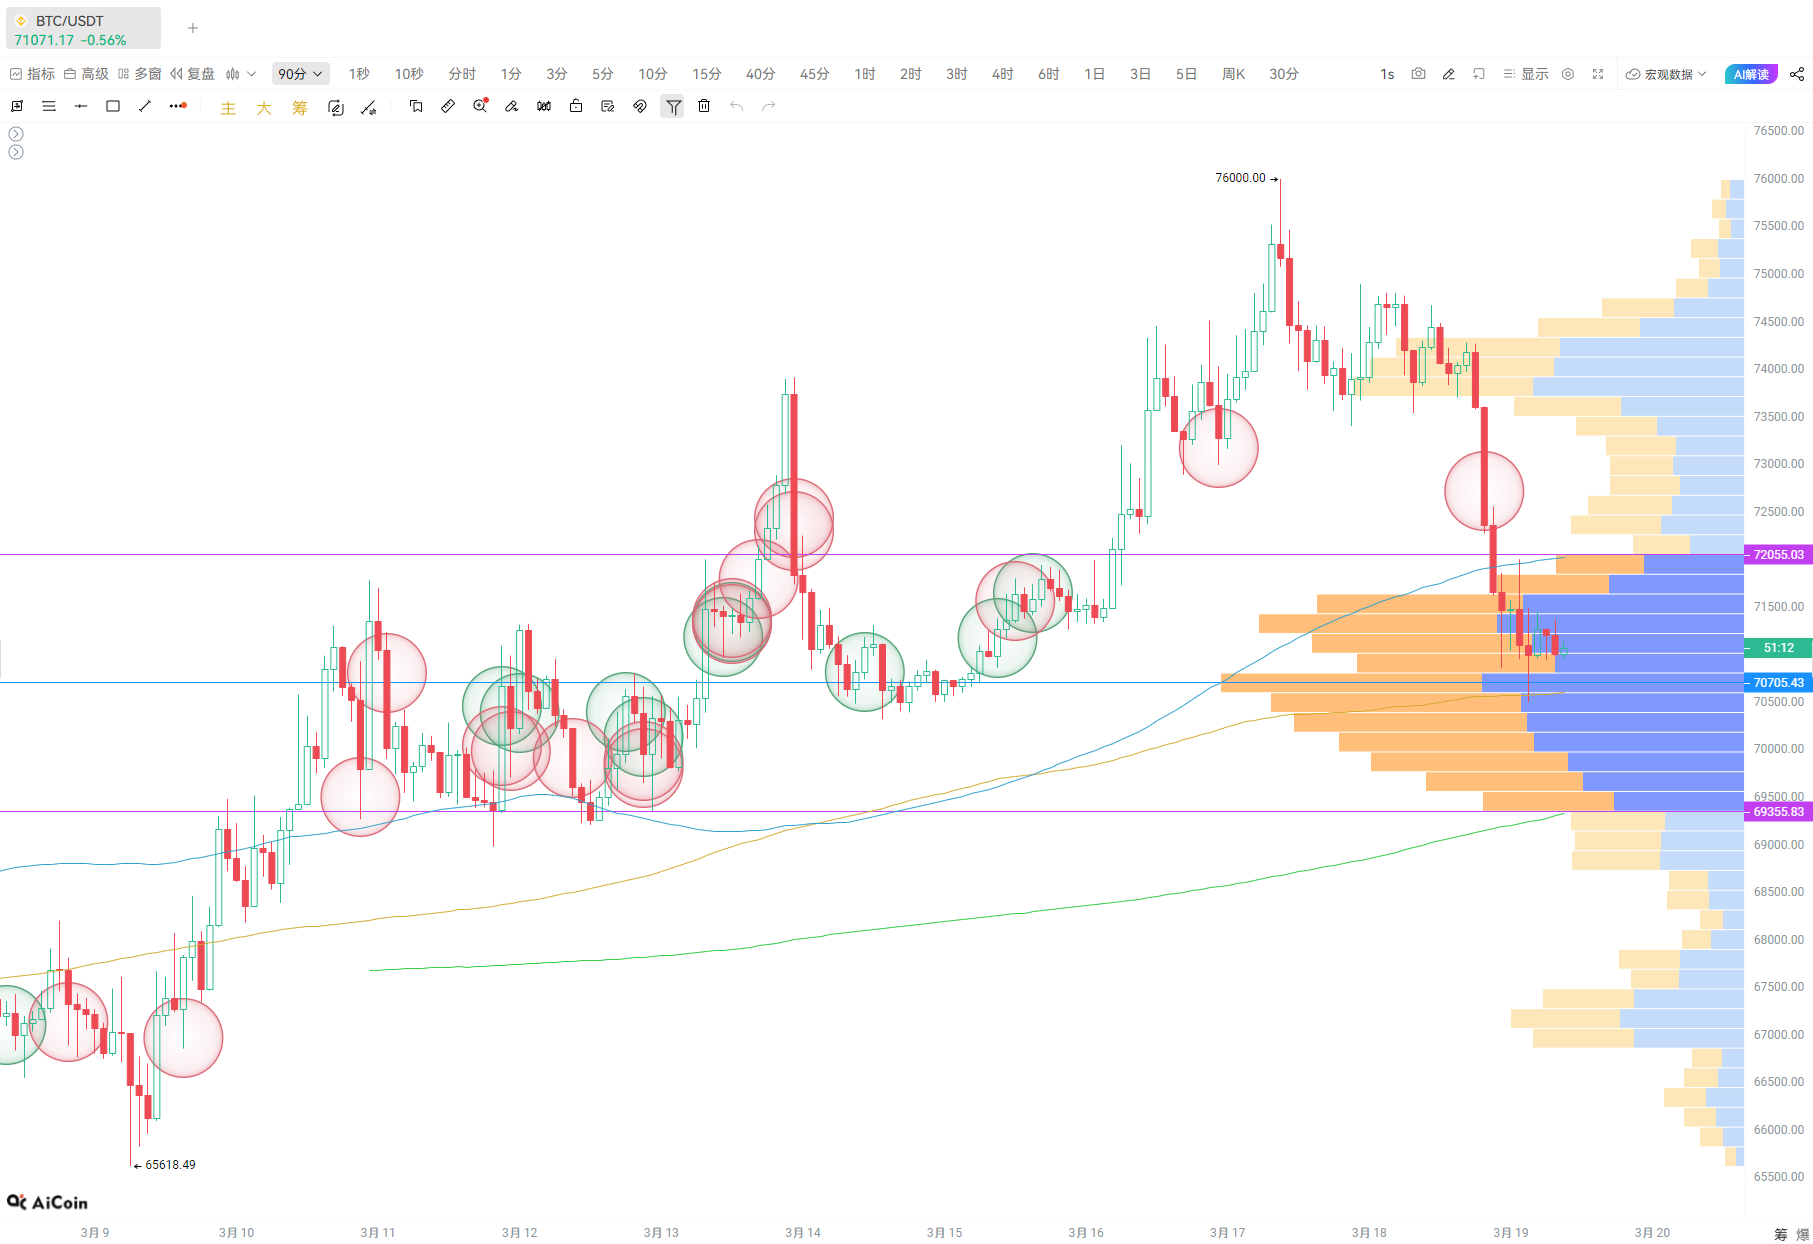
Last night, the Bitcoin market underwent a "major test" that was of great interest to technical investors. The 90-minute moving average, which attracted attention from short-term traders, was ruthlessly pierced by bearish forces, causing the price to slip to around 71,000 dollars, a densely populated chip area. As of the time of writing, the BTC price hovers around 71,200 dollars, with the overall rebound appearing weak and feeble, and market sentiment falling into a subtle state of wait-and-see.
Is this a precursor to the collapse of the bullish structure, or a "false drop" in the wave of the bull market? At this turning point, simple candlestick patterns can no longer provide all the answers. By combining the on-chain data, abnormal large orders, and capital inflow and outflow provided by the AiCoin platform, we find that behind this breakdown, there are indeed undercurrents, and the true intentions of major funds are beginning to surface.
1. The Truth Behind the Breakdown: Declining Volume and "Resilience" Support
From a technical perspective, BTC breaking below the 90-minute moving average, which is a short-term lifeline, indeed causes panic among many investors who chased high prices. However, a deeper analysis of the relationship between volume and price shows that the situation is not as pessimistic as it seems.
● Key Point One: A Decline in Volume, Not a Panic Exit. According to AiCoin data, during the process of breaking below the moving average last night, market trading volume did not show a sharp increase; instead, it displayed a relative contraction.
○ This usually indicates that the driving force behind the price drop is not a large-scale liquidation of real funds, but more like a temporary lack of liquidity and a long squeeze of highly leveraged contracts.
○ As the price approached the vicinity of 71,000 dollars (above the 24-hour low point of 70,500 dollars), there was a clear sign of "not being able to fall," with buying beginning to provide a bottom support.
● Key Point Two: The Natural Barrier of the Dense Chip Area. 71,000 dollars is not only a round number but also a central point of a two-week-long fluctuation. According to AiCoin's chip distribution chart, this area has accumulated a massive amount of churned chips, forming a natural "springboard" support. The strength of support at this position directly determines the depth of short-term adjustments.
2. Tracking Major Orders: Are Institutions "Building the Road Brightly, but Moving Secretly"?
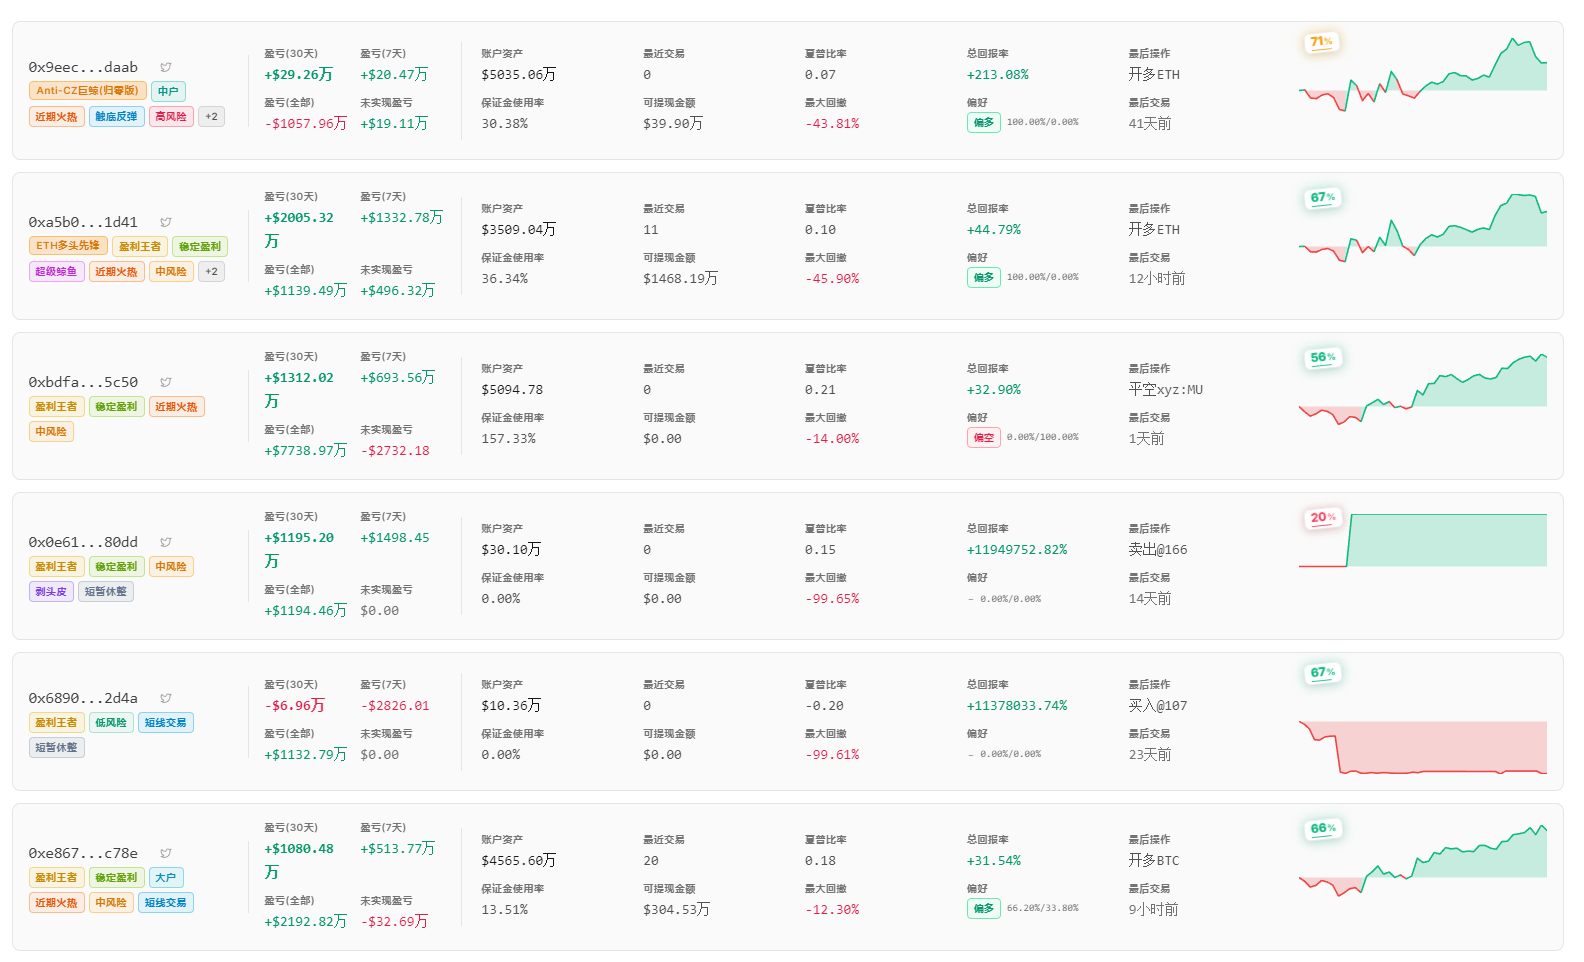
Just as retail investors panicked on the brink of a breakdown, on-chain "whales" quietly took action beneath the surface. AiCoin's on-chain data monitoring system captured several unusual signals.
1. Jane Street's Counter-Trend Layout
● Despite the gloomy market sentiment, traditional financial giants have not halted their pursuits. According to AiCoin tracking data, yesterday, wallet addresses associated with well-known quantitative trading firm Jane Street showed signs of large inflows. In just two hours, this address gathered about 205.36 bitcoins from exchanges like BitMEX and LMAX Digital, worth up to 15.08 million dollars.
● This behavior of consolidating funds from multiple exchanges into a single wallet is usually seen as a signal of institutional liquidity preparation or internal reshuffling. Despite Jane Street's previous controversial involvement in the Terra/Luna incident, its current Bitcoin inflow undoubtedly casts a "vote of confidence" in the current confused market, suggesting professional institutions' recognition of the current price level.
2. "Exchange Inventory" Drops to a 6-Year Ice Point
● In addition to instantaneous large order fluctuations, the macro on-chain trend reveals more significant issues. According to AiCoin data, as of March 18, Bitcoin inventory on major centralized exchanges has dropped to approximately 2.72 million coins, reaching a 6-year low.
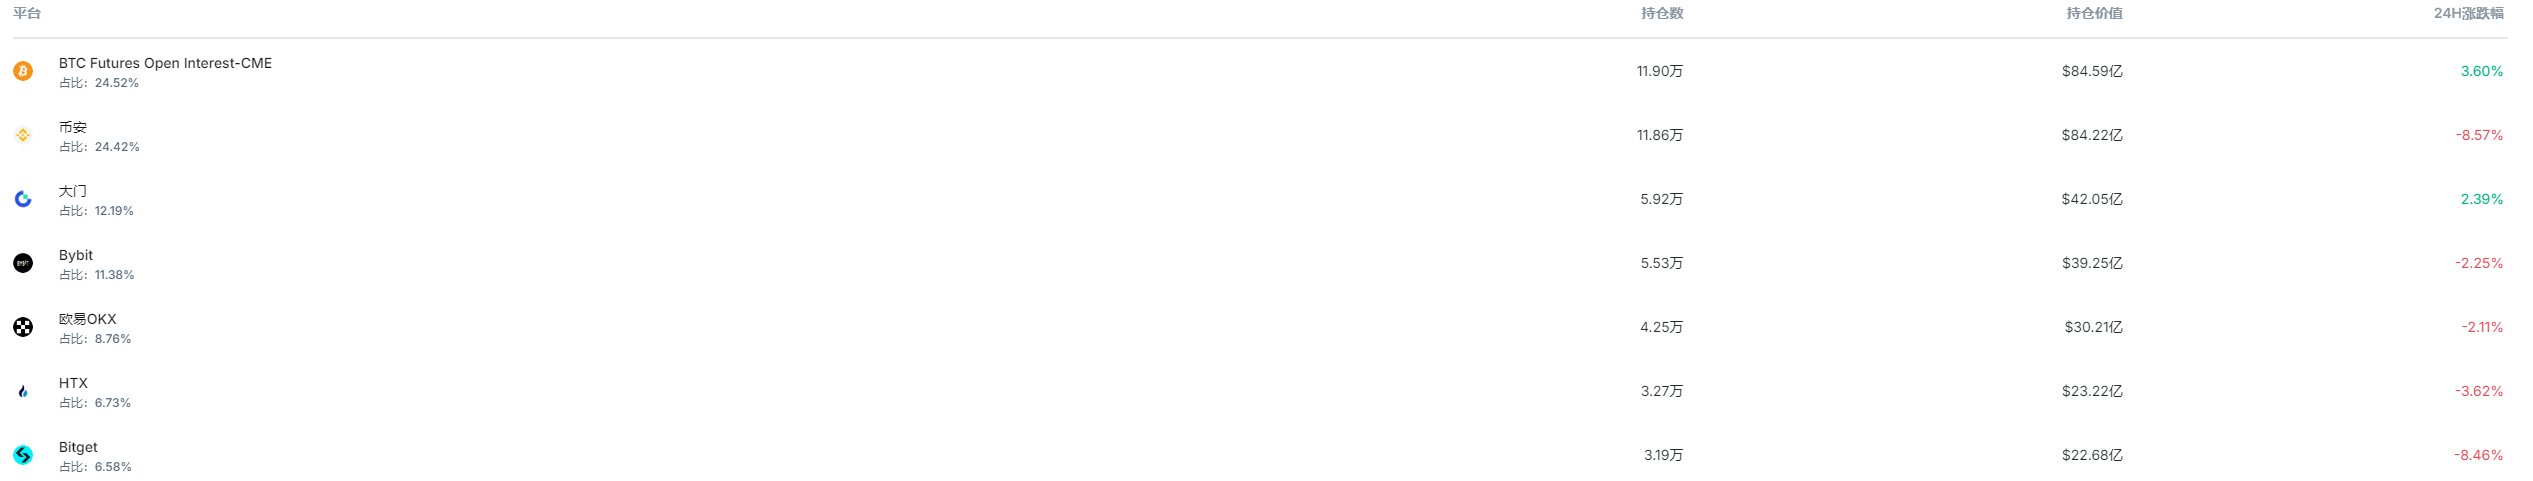
● What does this mean? Simply put, the "bullets" (available coins for trading) in exchanges are becoming fewer. As most investors withdraw BTC to cold wallets for long-term holding, the circulating supply in the market becomes extremely "dry."
● In this context, once buyers become active, the price can easily experience a surge; conversely, if shorts want to bring the price down, they will need to spend much more effort. The failure of last night's sell-off to trigger a crash-like chain reaction was precisely because the "pool" was too shallow, diluting the potential of the sell-off.
3. Capital Flows: The "Stabilizing Force" of ETFs
● Confronted with the short-term breakdown, many community members are most concerned about: Is major capital fleeing? To answer this question, we need to turn our attention to another critical battlefield—the Bitcoin spot ETF.
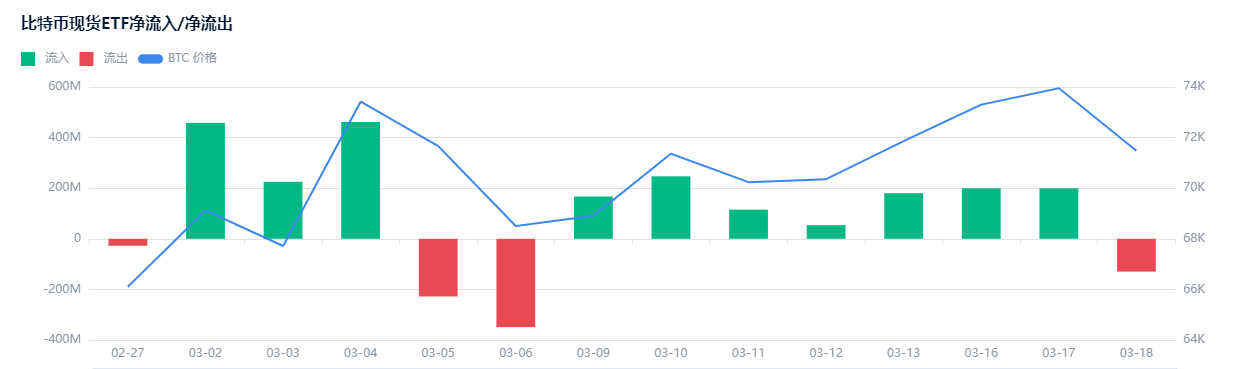
● According to AiCoin's associated macro capital flow data, during yesterday's market decline, ETF funds not only did not flow out but continued their strong inflow trend, achieving net inflows for seven consecutive trading days.
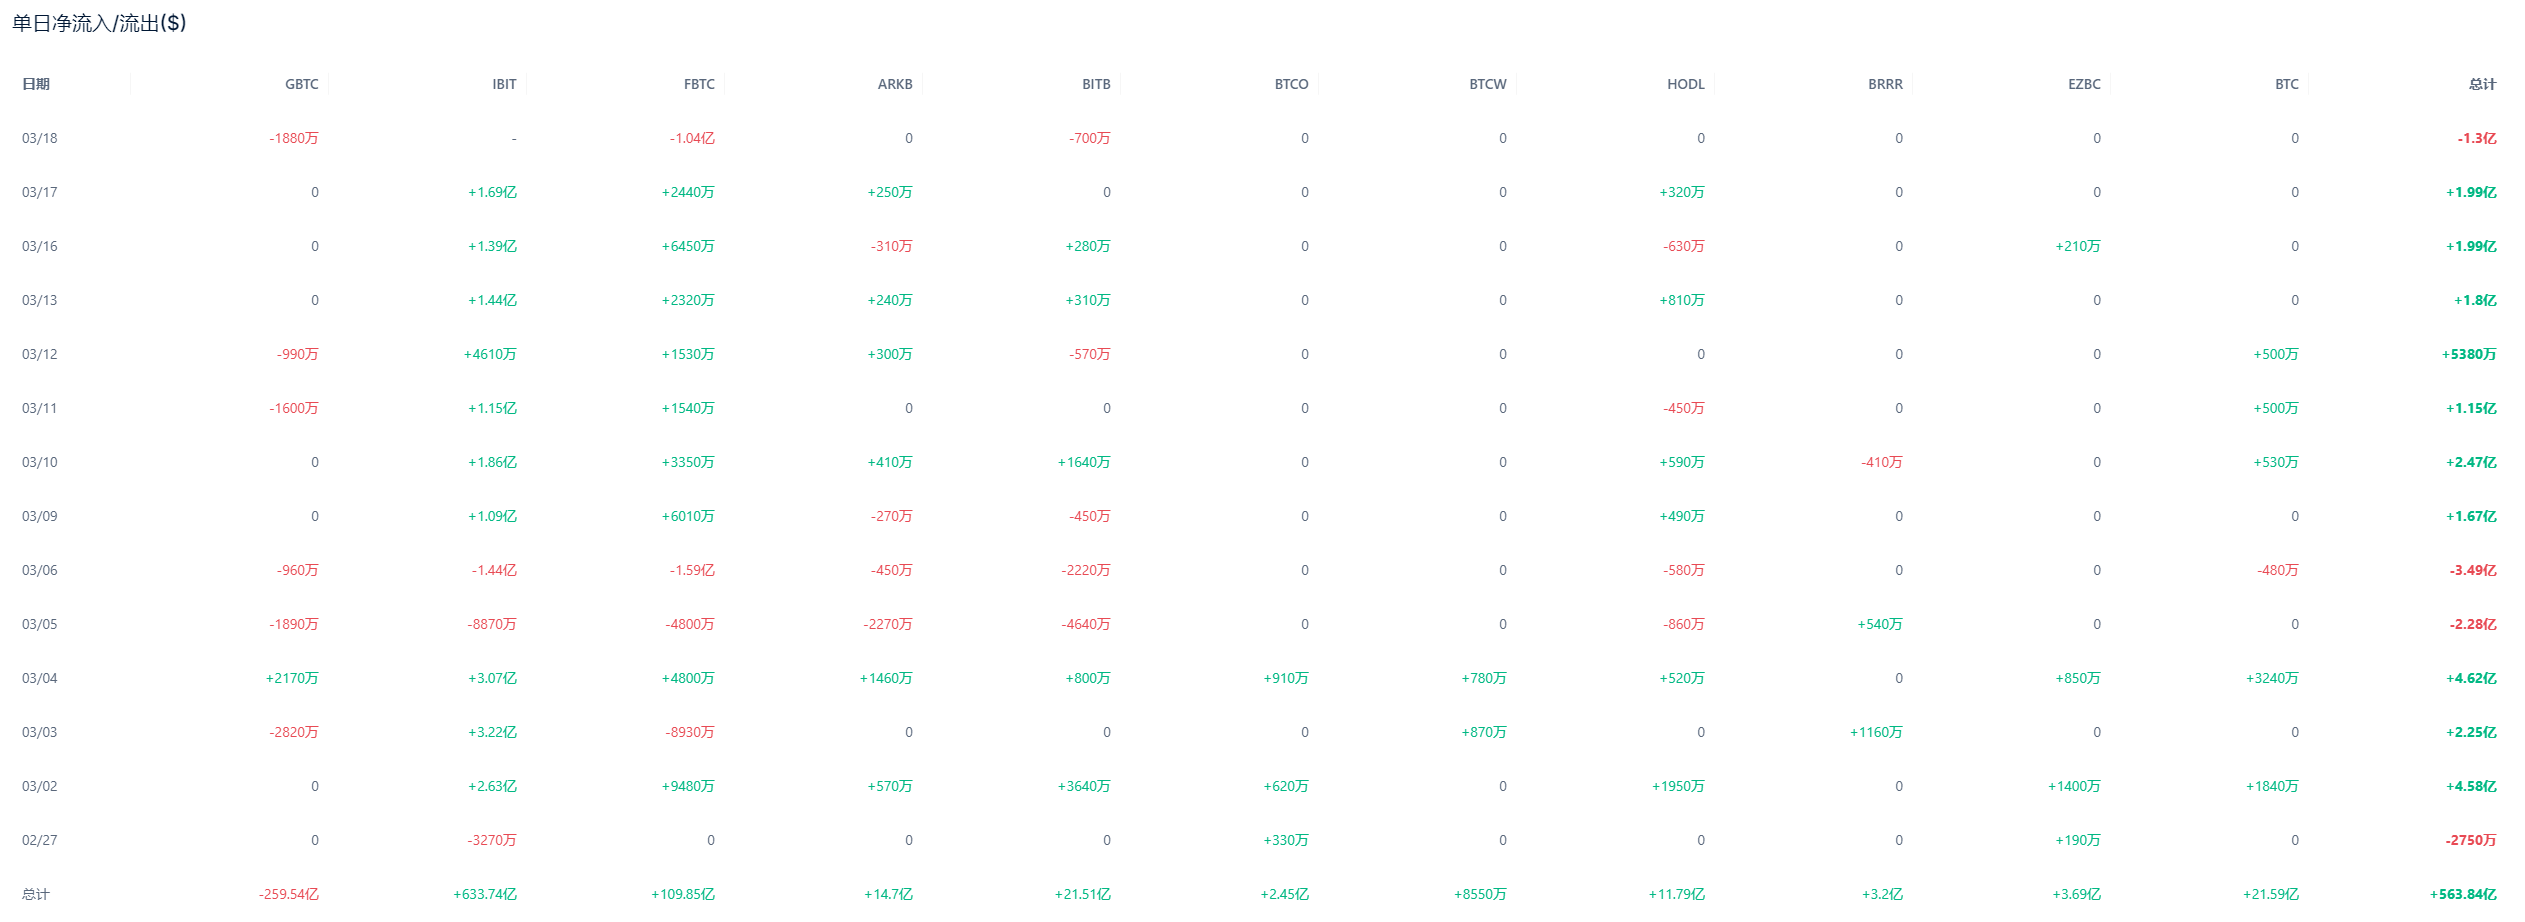
● This is a significant signal. The capital in ETFs represents the attitude of "regular troops" and "allocation type" institutions. They not only did not exit to cut losses due to the breach of a 90-minute moving average but continued accumulating during the decline. This forms the most robust "shield" in the current market and logically provides an explanation for the support in the 71,000 dollar region—there is long-term capital providing a floor.
4. Game Theory: Retail Exodus and the Turnover of "Smart Money"
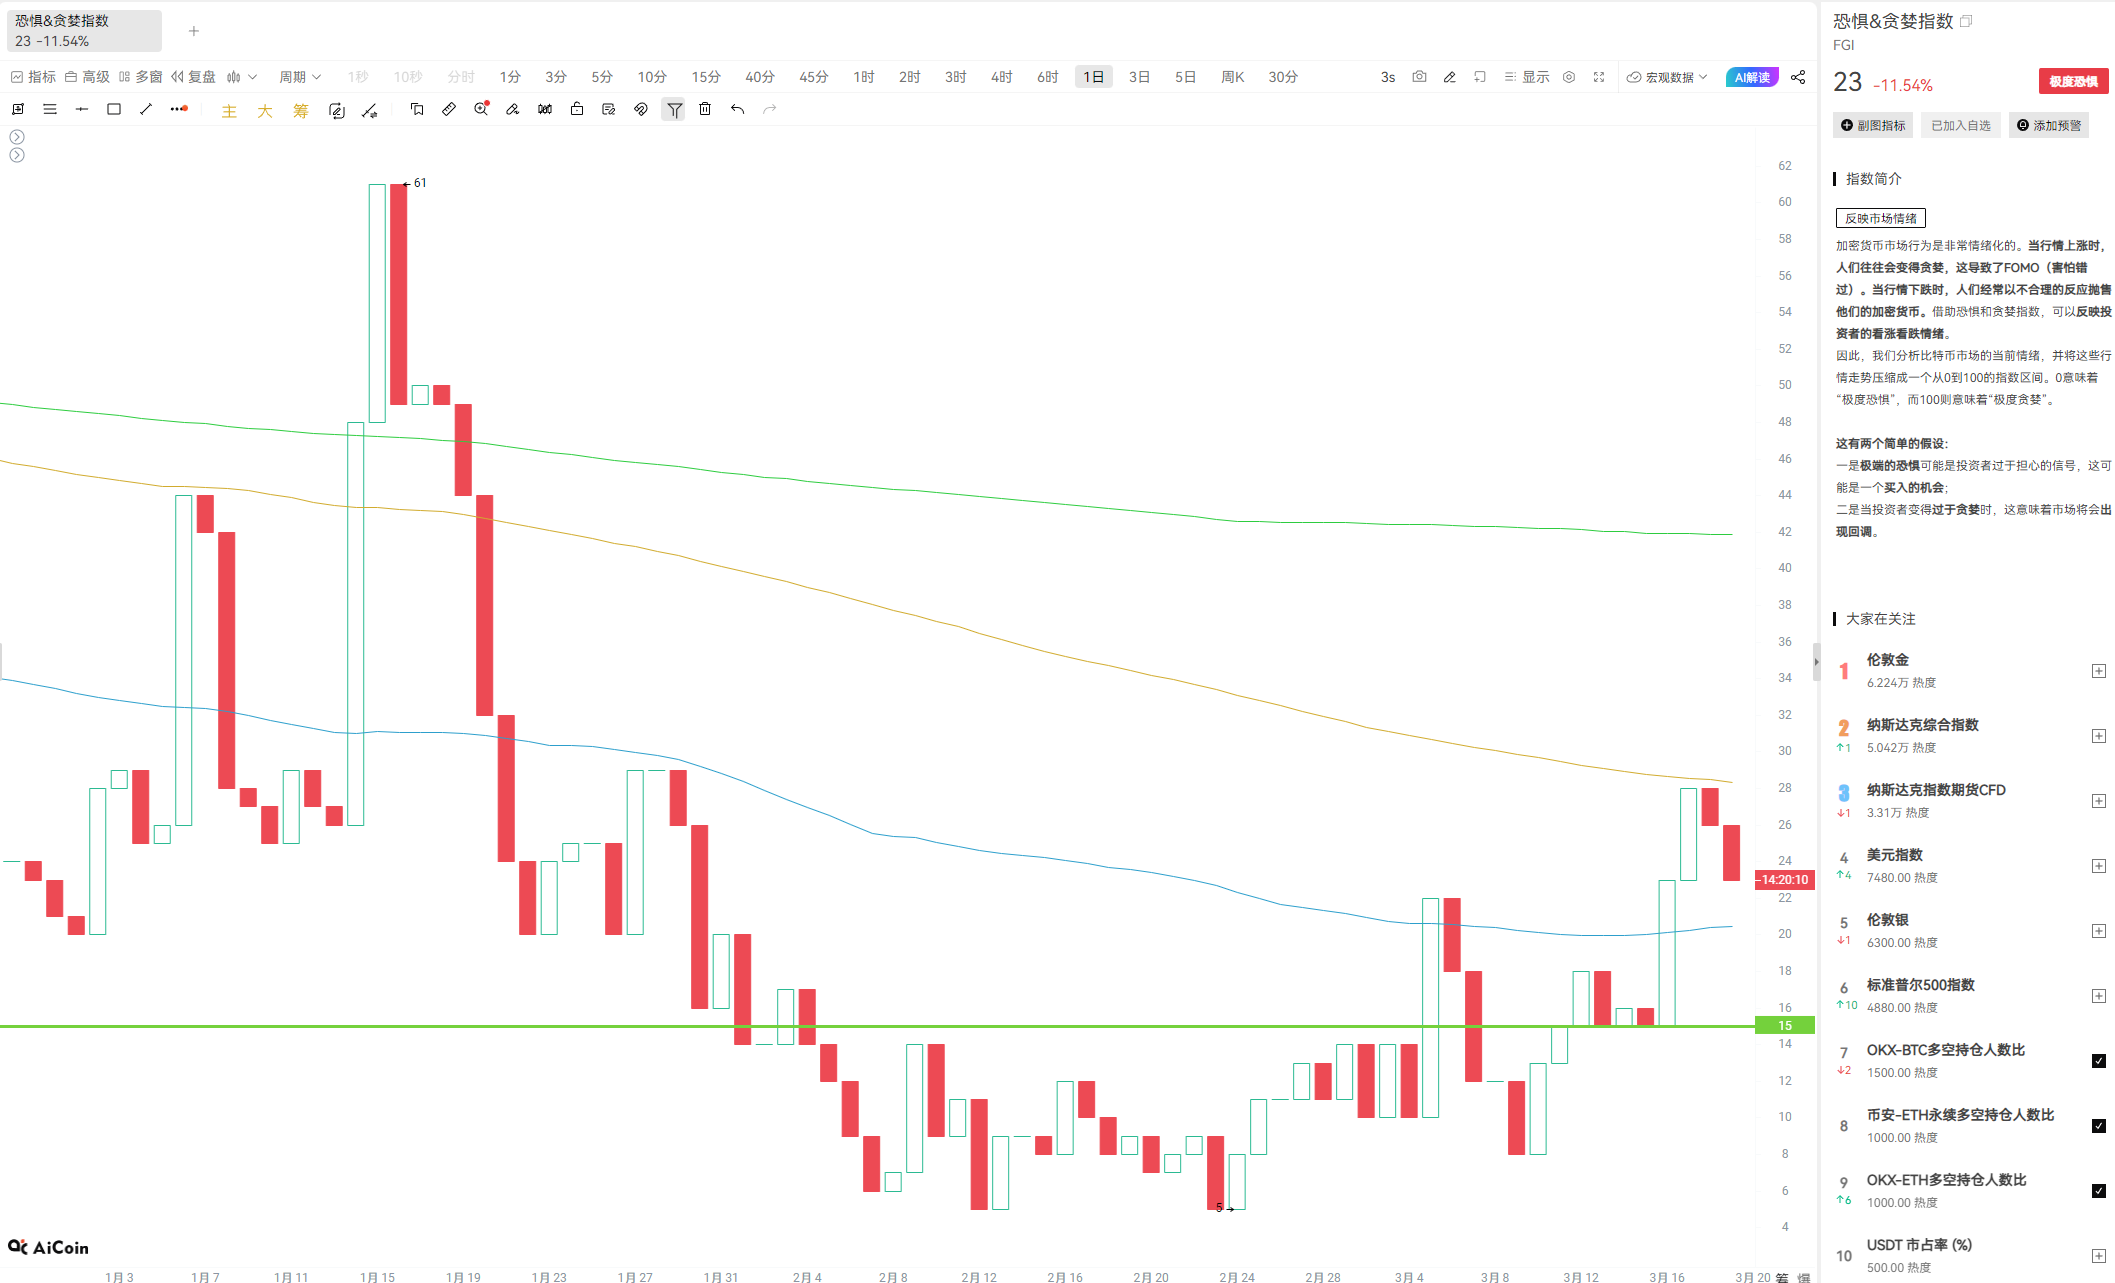
● From AiCoin's market sentiment model, as the price broke below the moving average, the bearish sentiment index soared rapidly, with panic remarks on social media becoming noticeably more frequent. However, in the contract market, we observed an interesting phenomenon:
○ Although the total liquidation amount across the network within 24 hours was about 320 million dollars, primarily from long positions, it is worth noting that at the end of the decline, a large number of shorts were closing their positions, rather than opening new short positions.
○ This often indicates that the dominant force behind the sell-off has begun to "wrap up," and may even be covering their positions at lower levels. Combined with the accumulation of whale addresses and the decline in exchange inventory, a classic picture of major accumulation and retail liquidation emerges.
● From the volatility skew of options, traders continue to buy put options for protection, suggesting that while there is no panic in the market, the defensive mentality remains strong, accumulating energy for future upward movements.
5. Future Strategy: How to Find Certainty in the Fog?
Based on various data from AiCoin, it is not difficult to conclude: The short-term breakdown is more like a technical "trap," rather than a reversal of the trend. 71,000 dollars (and the lower level of 70,500 dollars) remains a critical position that bulls must defend at all costs. As long as this position is not effectively broken, the market's rebound structure still exists.
How should ordinary investors respond on this "eve of change"?
● Keep a close watch on AiCoin's major order radar: If there are consecutive large buy orders in the 70,500-72,000 dollars range (especially eat-through orders), it is a clear signal that major players are moving, and consideration can be given to following their layout.
● Monitor the rate of capital inflow: If the exchange's BTC inventory continues to decline and stablecoins like USDT begin to flow into the exchanges in large amounts, it indicates that off-market funds are getting prepared to enter.
● Avoid chasing highs and cutting losses during fluctuations: Within dense chip areas, price fluctuations are the norm. It is recommended that investors use AiCoin's long-short ratio data as a contrarian indicator, maintaining optimism when retail sentiment is extremely bearish and caution when blindly chasing highs.
The breach of the 90-minute moving average last night was a stress test for the market. The results of the test indicate solid support below and ample institutional funds. Although the rebound strength currently appears weak, the rule of "low volume sees low price" tells us that the window for change is drawing near. For those investors who can penetrate the candlestick appearances and understand the essence of on-chain data, every panic-induced drop might be the best opportunity to get on board.
Join our community to discuss and become stronger together!
Official Telegram Community: https://t.me/aicoincn
AiCoin Chinese Twitter: https://x.com/AiCoinzh
OKX Welfare Group: https://aicoin.com/link/chat?cid=l61eM4owQ
Binance Welfare Group: https://aicoin.com/link/chat?cid=ynr7d1P6Z
免责声明:本文章仅代表作者个人观点,不代表本平台的立场和观点。本文章仅供信息分享,不构成对任何人的任何投资建议。用户与作者之间的任何争议,与本平台无关。如网页中刊载的文章或图片涉及侵权,请提供相关的权利证明和身份证明发送邮件到support@aicoin.com,本平台相关工作人员将会进行核查。