Waves in the Coin Sea: March 19 Bitcoin (BTC) Market Analysis Reference:
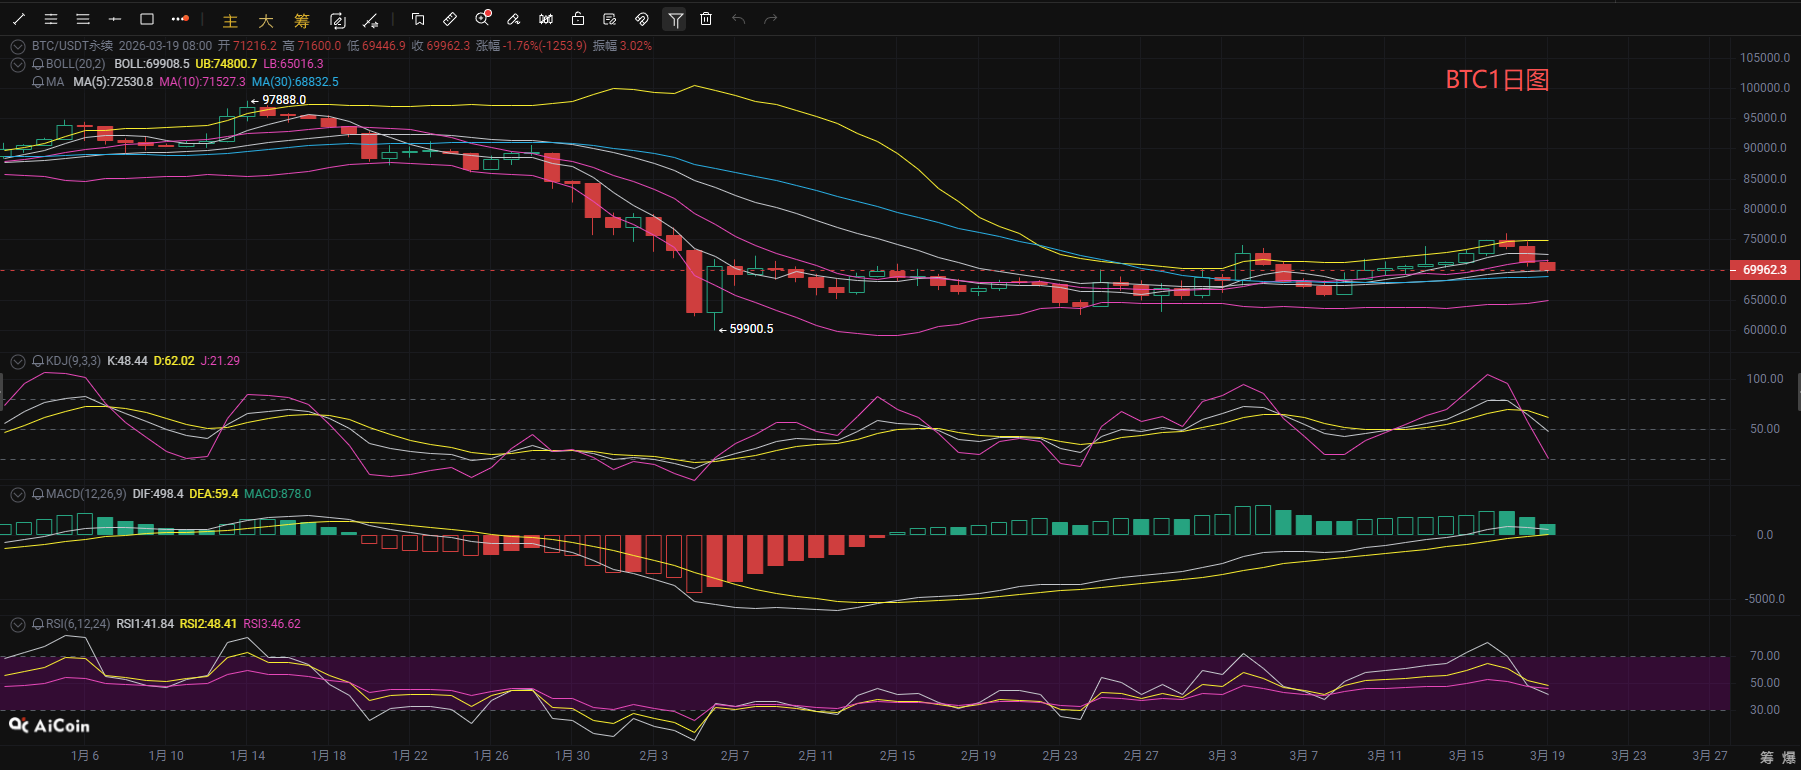
Last night, the bears of Bitcoin suddenly exerted pressure, breaking through short positions and causing the price to plunge, with a nearly 4000-point drop. Although the price has slightly rebounded from its lows, the rebound strength is very weak. As of the time of writing, the price is fluctuating around 71,000. Observing from the daily chart, the K-line has consecutively closed in the red, and the current price has fallen below the 5-day and 10-day moving averages, approaching the middle line of the Bollinger Bands. The BOLL indicator shows the upper band turning downward, while the middle band still provides support. The price is in a high-level correction phase; the MACD continues to shorten, with the DIF and DEA narrowing; bullish momentum is clearly diminishing; the KDJ has fallen from the overbought zone through a dead cross to around 23, with the RSI dropping below 50, indicating a correction cycle at the daily level. The 72,000-73,000 zone is a strong resistance area. If it effectively breaks below the middle line of the Bollinger Bands, the price may further decline. It is suggested that all coin friends做好risk control in advance.
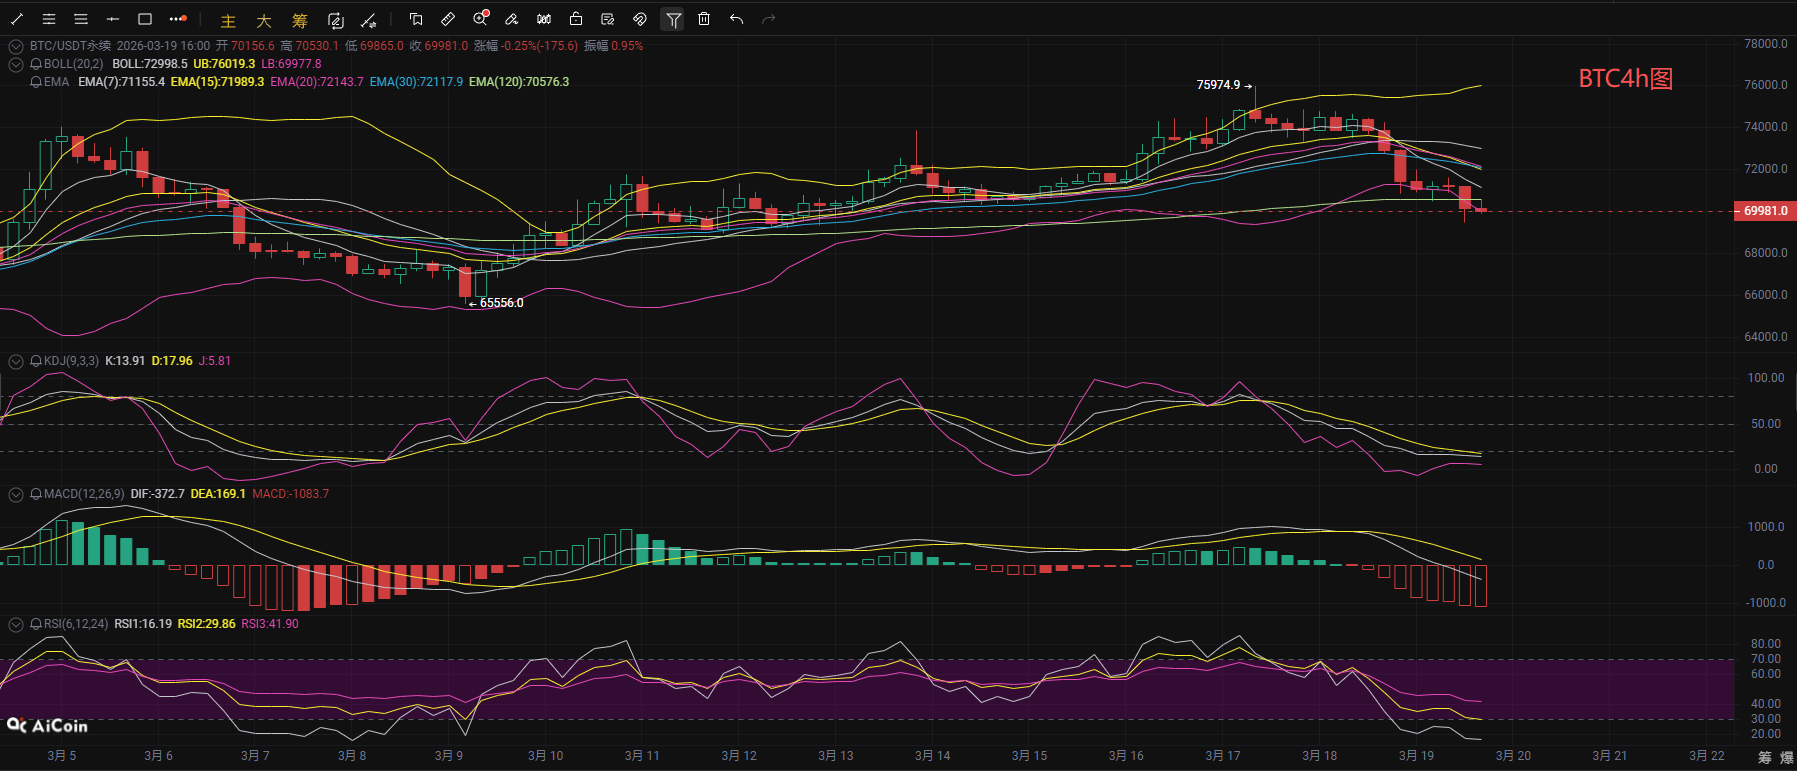
Observing the short-term hourly chart, on the 4-hour level, the price has broken below the short-term EMA moving average and the middle line of the Bollinger Bands, currently oscillating near the lower band. The middle and lower bands are both turning downwards. In the MACD indicator, after the DIF and DEA create a dead cross, the gap is expanding, showing a clear bearish trend. However, KDJ and RSI are in the oversold area, indicating a potential short-term technical rebound demand, but the expected intensity is limited, with the 71,500-72,000 zone as a strong resistance band and 69,000 as a key support level; if the rebound cannot break through 72,000, the price will continue its correction trend. It is recommended to focus on high short positions and strictly set stop losses.
Waves in the Coin Sea: March 19 Bitcoin Short-Term Reference:
Short position: short in the 71,500-72,500 range, with a stop loss of 500 points, targeting 70,500-69,500,
Long position: long in the 68,200-69,200 range, with a stop loss of 500 points, targeting 70,000-71,500,
Waves in the Coin Sea: March 19 Ethereum (ETH) Market Analysis Reference:
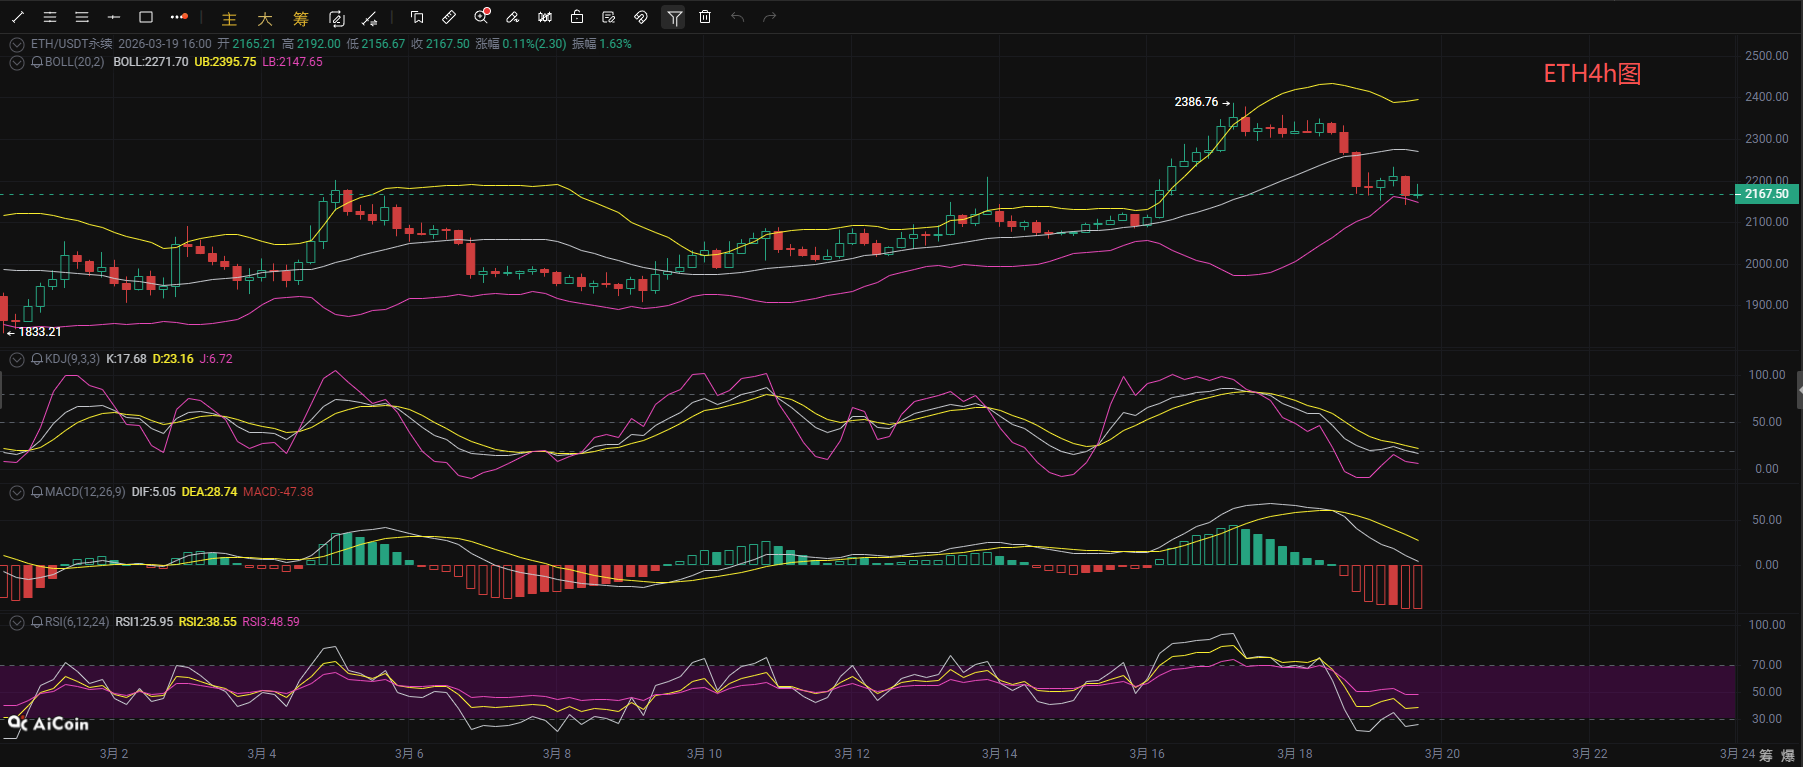
Ethereum operates in sync with Bitcoin. From the 4-hour level, after a high spike, Ethereum's price has continuously declined and has currently fallen to the lower band of the Bollinger Bands. The BOLL is opening downwards, and the MACD indicator has created a death cross and is continuing to expand, with the DIF and DEA increasing the gap, showing a continuous strengthening of bearish momentum. The KDJ indicator shows all three lines are below 20 in the oversold area, with the J-line touching the bottom and releasing weak rebound signals; the RSI three lines are simultaneously falling to around 30, with an overall pessimistic sentiment, not yet out of the weak zone. The upper zone of 2220-2240 is a strong resistance band, while the lower zone of 2140-2120 is a key support level; if the rebound cannot break through the 2220 resistance, the price will continue its correction trend. If it effectively breaks below 2140, it will open up greater downward space. It is suggested to watch more and act less in the short term, waiting for a clear direction before deciding when to enter the market.
Waves in the Coin Sea: March 19 Ethereum Short-Term Reference:
Short position: short in the 2000-2250 range, with a stop loss of 30 points, targeting 2150-2100,
Long position: long in the 2070-2120 range, with a stop loss of 30 points, targeting 2150-2200,
[The above analysis and strategies are for reference only. Risks are to be borne by oneself. The article's review and publication may have delays, and strategies may lack timeliness. Please do not act blindly]

The content of this article is originally shared by [Waves in the Coin Sea], representing only personal views. There may be delays in sending the article, for reference only, and please do not act blindly! Want to get more daily real-time trades? Then follow my public account! Here, you can engage in online technical study of the market and learn about relevant knowledge of liquidation and exit strategies. I have years of research experience in the market, focusing on the major trends in the cryptocurrency circle. Mainly responsible for analyzing and guiding investment operations in BTC, ETH, SOL, BCH, and other coins. Welcome to study and explore together.
免责声明:本文章仅代表作者个人观点,不代表本平台的立场和观点。本文章仅供信息分享,不构成对任何人的任何投资建议。用户与作者之间的任何争议,与本平台无关。如网页中刊载的文章或图片涉及侵权,请提供相关的权利证明和身份证明发送邮件到support@aicoin.com,本平台相关工作人员将会进行核查。