Cryptocurrency Scholar: On April 21, Ethereum's daily line firmly stands above key moving averages, bullish signals emerge, along with short-term entry and stop-loss points! Latest market analysis and trading suggestions
Ethereum's current price is 2327. To be honest, trading in the cryptocurrency market is about who can remain more stable. Yesterday, I sent multiple messages indicating that the low support was effective for a move upward. Now, looking at the bottom position at 2280, that gives me confidence. No matter how volatile the market gets, as long as the trend remains intact, just hold on and wait for the right moment. Don’t let short-term fluctuations affect your rhythm, manage your stop-loss, control your position, and the profits from this ambush are already securely in hand!
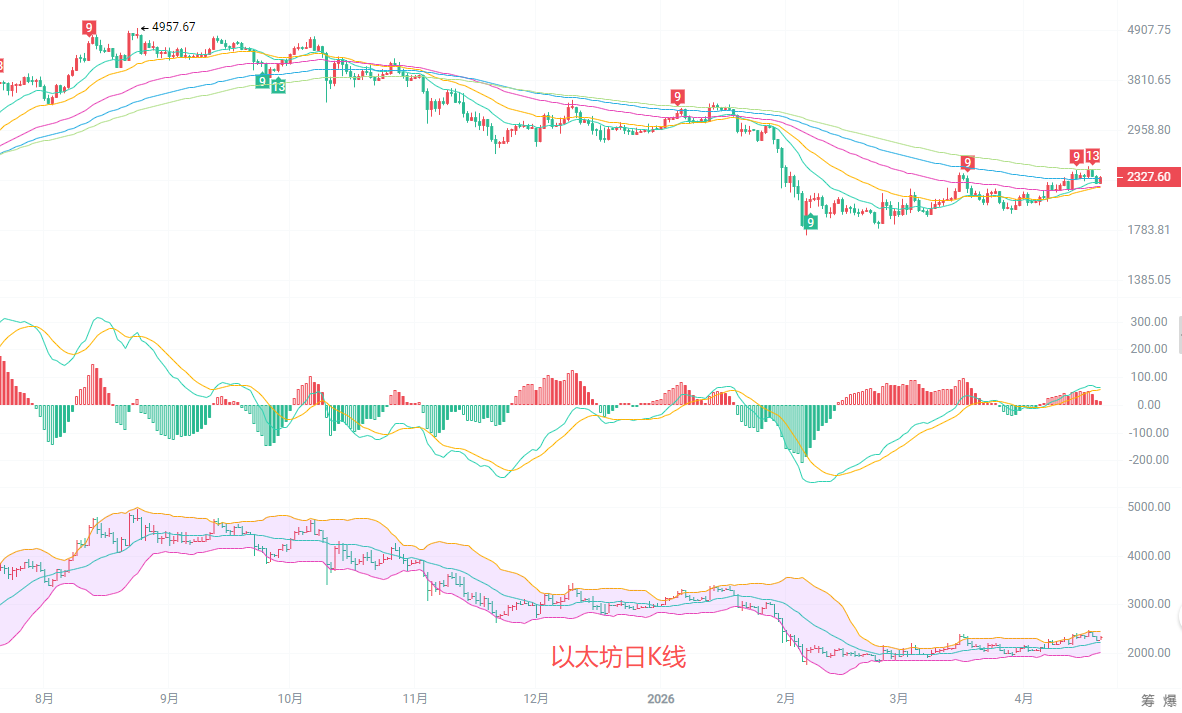
The daily KK line is stable above the EMA15, EMA30, and EMA60 moving averages. Short-term moving averages are arranged upwards, providing strong support. The MACD red bars continue to exist, and the DIF and DEA are still in the upward area, indicating that the rebound trend has not yet ended. The middle track of the Bollinger Bands around 2230 is a strong support level, with the price repeatedly testing it without breaking. The upper track at 2456 represents a strong resistance in the short term; if it cannot break through, it is highly likely to maintain sideways fluctuations.
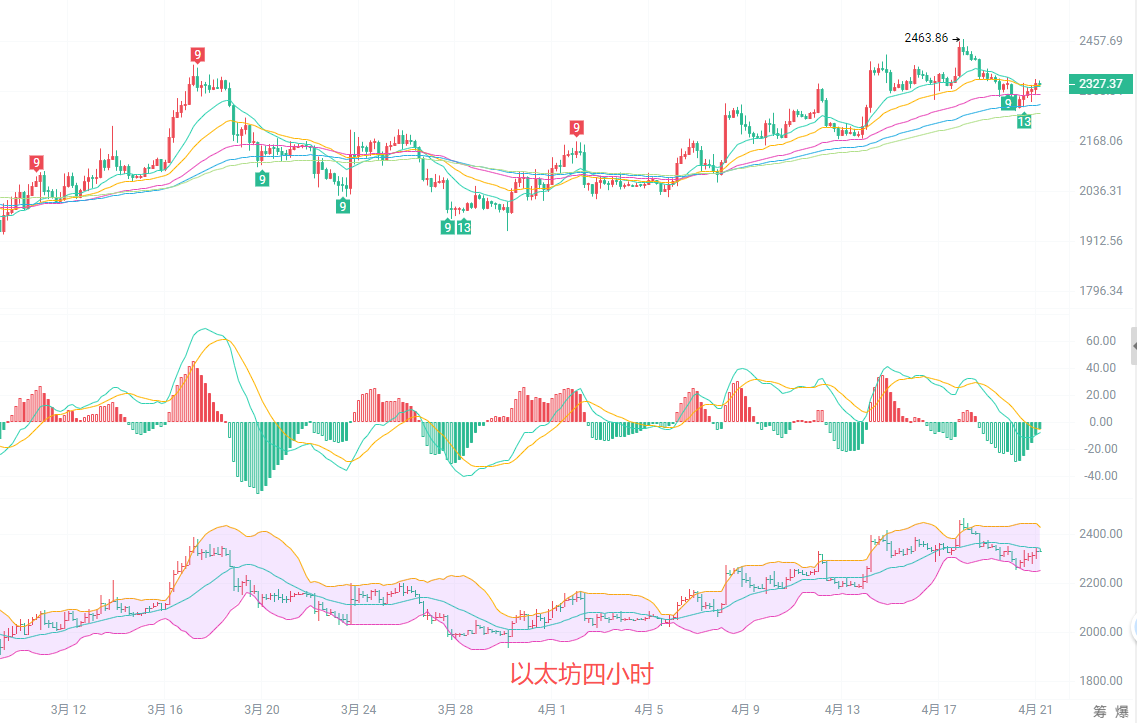
The four-hour K-line has pulled back from a high of 2463 and is currently oscillating around 2330. EMA15 and EMA30 moving averages are flattening out, with the price fluctuating above and below the averages, showing significant oscillation characteristics. The MACD red bars continue to decrease, and upward momentum is weakening, with the potential for a death cross forming. There is fierce contention between bulls and bears around the middle track of the Bollinger Bands near 2339, while the lower track at 2253 is a key support level. If it breaks down, further correction may occur.
Short-term reference: (Practical data has been updated; details can be consulted with the author)
For movements upward from 2280 to 2300, stop-loss at 2245, with targets set at 2370 to 2400
For movements downward from 2390 to 2410, stop-loss at 2465, with targets set at 2320 to 2285
To be honest, this market is now a frustrating oscillation period. Don’t think about taking a big gamble to reap maximum profits; a steady and cautious approach is key. I hold my position firmly at 2280. Now, it’s just about waiting for the direction to reveal itself. Don’t let short-term rises and falls affect your mindset; manage your stop-loss, follow the trend, and we will gradually profit.

Friendly Reminder: The above content is solely created by the author for the public account. Advertisements at the end of the article and in the comments section are unrelated to the author; please discern carefully, thank you for reading.
免责声明:本文章仅代表作者个人观点,不代表本平台的立场和观点。本文章仅供信息分享,不构成对任何人的任何投资建议。用户与作者之间的任何争议,与本平台无关。如网页中刊载的文章或图片涉及侵权,请提供相关的权利证明和身份证明发送邮件到support@aicoin.com,本平台相关工作人员将会进行核查。