Coin Circle Liying: On April 23, the daily level golden cross of Ethereum continues, but insufficient volume limits short-term upward space! Latest market analysis and trading suggestions
Family members! Ethereum is now at 2402, like a resting platform halfway up a mountain. It has recently risen from over 2100, and now it is swaying just above 2400, with a bit of hesitation both up and down. The upper line of the purple Bollinger Band is around 2429, resembling a small hurdle; while the previous high of 2463 looks like a more prominent peak. From the trend, every time it dips, it can be bought up, indicating that there are many buyers below, but pushing above 2400 feels a bit strenuous, and buyers are beginning to hesitate. Simply put, it wants to rise, but it's a bit exhausting to surge all at once; it wants to drop, yet there are several hands below supporting it, with both bulls and bears wrestling, waiting to see who is stronger. Moving forward, if it can surge past the previous high of 2463 in one go, the path will be clear; if multiple attempts to rise fail, it may turn back to seek support.
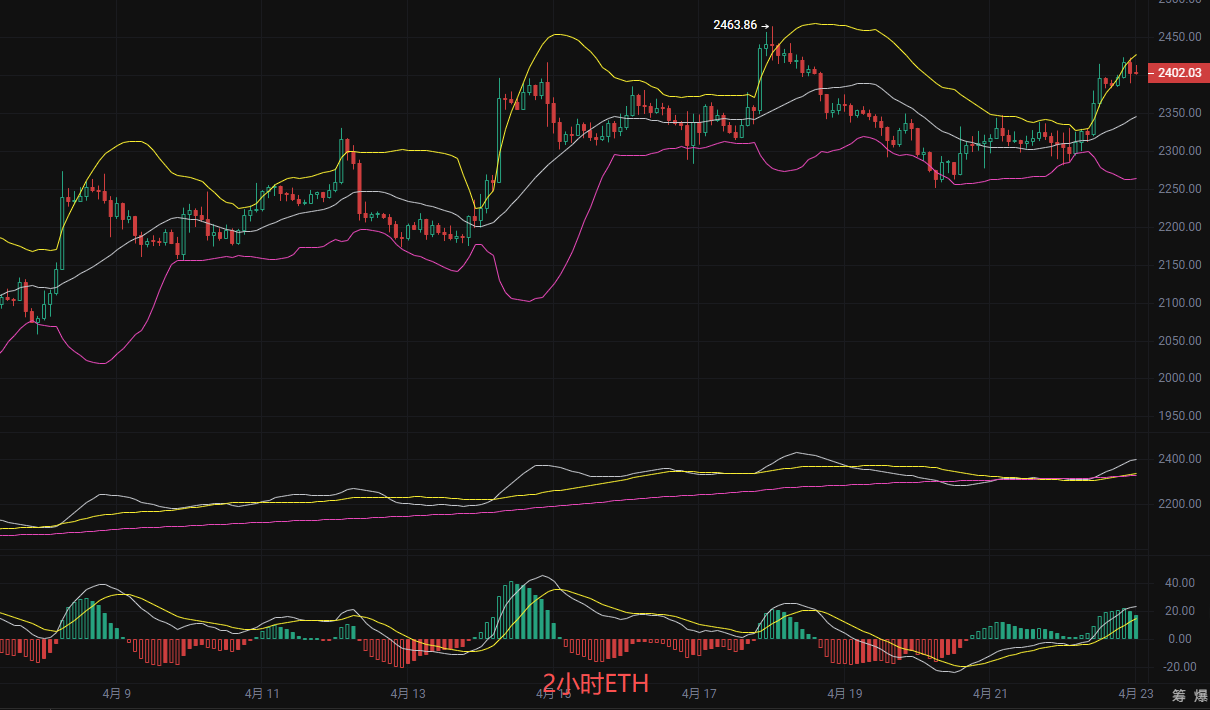
The 2-hour K-line is operating between the middle and upper bands of the Bollinger Band, with the Bollinger Band showing an upward opening trend, indicating that price fluctuations may intensify, with a directional choice imminent. The moving average system is in a typical bullish arrangement, with short, medium, and long-term averages arranged from top to bottom, and the price is steadily operating above all moving averages, indicating that the overall upward trend structure is good, with the MA30 below and the middle track of the Bollinger Band at 2346 forming a key support area. The MACD indicator shows that the DIF line and the DEA line maintain a golden cross state above the zero axis, and the red momentum bars continue to expand, confirming the current bullish momentum advantage. However, it should be noted that the price is approaching the previous important high of 2463, which will constitute direct resistance. If subsequent trading volume can be effectively expanded in conjunction, a breakout is expected; if there is a contraction in volume and stagnation, short-term pullback risks should be heeded.
Short-term practical strategy (Liying personally teaches, accurately aligning with the market)
Long position idea: 2345-3355, stop loss 2300, target 2450 aiming for 2500
Short position idea: 2450-2480, stop loss 2510, target 2400 aiming for 2350
Overall strategy: Currently in a consolidation phase before the key resistance level, it is recommended to focus on buying on dips, while shorting should be quick in and out. All trades must strictly set stop losses to control position risk.
Note: The above analysis is solely derived from Liying's technical logic and does not constitute investment advice. The market has risks, and investments should be cautious.

Friendly reminder: The above content is solely created by the author of the public account. The advertisements at the end of the article and in the comment section are unrelated to the author, please discern carefully, thank you for reading.
免责声明:本文章仅代表作者个人观点,不代表本平台的立场和观点。本文章仅供信息分享,不构成对任何人的任何投资建议。用户与作者之间的任何争议,与本平台无关。如网页中刊载的文章或图片涉及侵权,请提供相关的权利证明和身份证明发送邮件到support@aicoin.com,本平台相关工作人员将会进行核查。