Wave in the Currency Sea: 4.24 Ethereum (ETH) Market Analysis Reference:
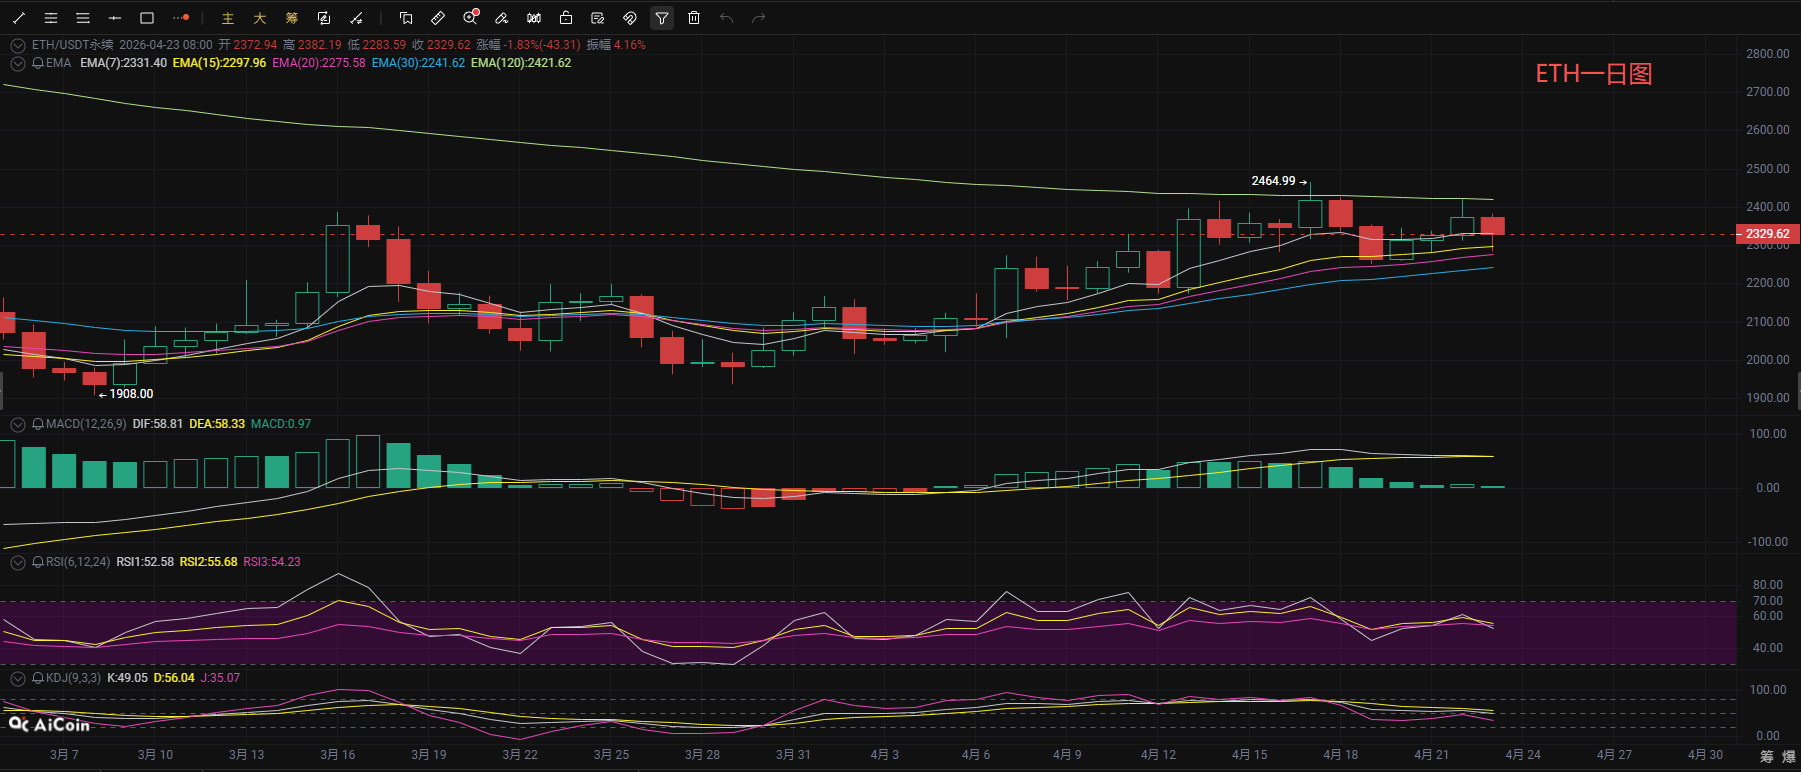
Ethereum continues to fluctuate downwards, completely giving back previous gains. Observing from the daily chart, the price of Ethereum is currently receiving initial support near the middle band of the Bollinger Bands and the EMA20 moving average. In the MACD indicator, the fast and slow lines are consolidating above the zero axis, showing signs of forming a death cross, with the histogram continuing to shrink, indicating a significant reduction in bullish momentum; the RSI indicator has retreated from the previous high into a neutral range, with upward momentum weakening; the KDJ indicator is diverging downwards, with short-term adjustment pressure still present. Overall, the daily upward trend has not yet been broken, but bullish momentum has clearly weakened, and the price is likely entering a phase of fluctuation and digestion, with a focus on the effectiveness of the Bollinger Bands' middle band support at 2270 in the future.
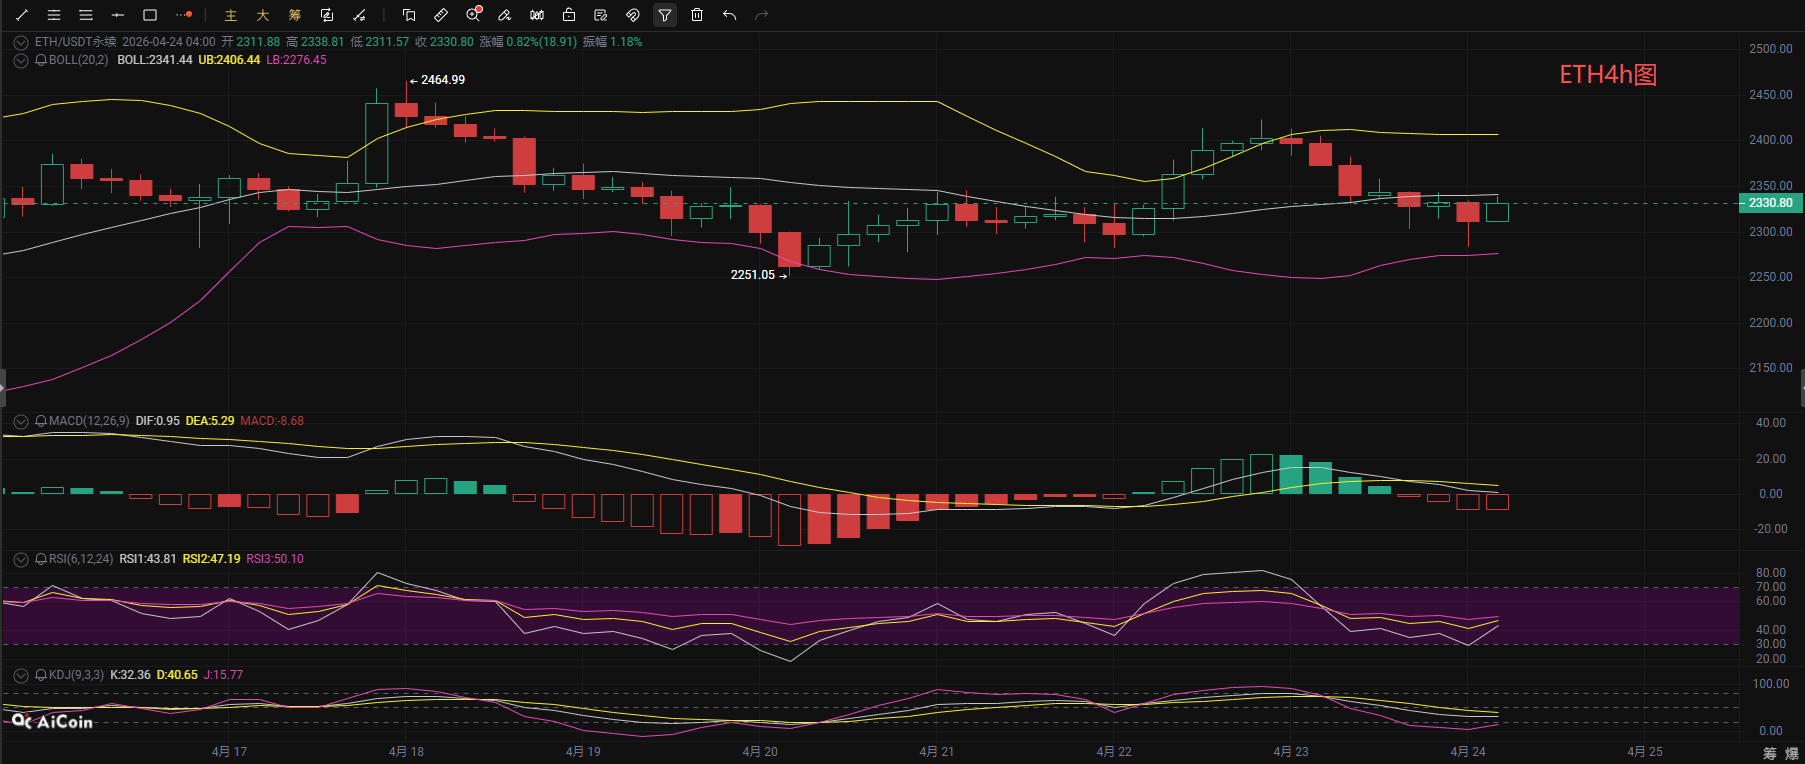
From the short-term hourly chart, after facing pressure at the highs, the price at the 4-hour level has retraced, currently operating below the middle band of the Bollinger Bands, with short-term moving averages EMA7 and EMA15 forming a death cross, indicating clear price pressure. In the MACD indicator, the DIF has crossed below the DEA, forming a death cross with the histogram turning negative, releasing bearish momentum; the RSI indicator has fallen below the 50 level, a key dividing line; the KDJ indicator is operating at a low level, in a weak range. Currently, the price is within a short-term adjustment channel, with the upper focus on the Bollinger Bands' middle band and EMA15 resistance levels, and the lower focus on the Bollinger Bands' lower band at 2275 and the previous low around 2250 for support. If the support holds, the trend at the daily level is expected to continue after the adjustment.
Wave in the Currency Sea: 4.24 Ethereum Short-term Reference:
Short Position: Short in the range of 2420-2370, stop loss 30 points, target looking at 2350-2290,
Long Position: Long in the range of 2250-2290, stop loss 30 points, target looking at 2310-2370,
【The above analysis and strategy are for reference only. Please bear the risks. The publication or review of this article may have delays, and the strategy may lack timeliness, so do not act blindly】

The content of this article is originally shared by 【Wave in the Currency Sea】 and represents personal views only. There may be delays in article distribution, it is for reference only, and do not act blindly! If you want to get more daily real-time trades? Then follow my public account! Here, you can engage in online technical learning of the market, and also understand knowledge related to strategies for exiting positions. I have years of research experience in the market, focusing on the major trends in the cryptocurrency circle. Mainly responsible for analysis and guidance on investment operations for BTC, ETH, SOL, BCH, and other coins. Welcome to study and research together.
免责声明:本文章仅代表作者个人观点,不代表本平台的立场和观点。本文章仅供信息分享,不构成对任何人的任何投资建议。用户与作者之间的任何争议,与本平台无关。如网页中刊载的文章或图片涉及侵权,请提供相关的权利证明和身份证明发送邮件到support@aicoin.com,本平台相关工作人员将会进行核查。