Dear students, I am your old friend Qinglan. Today we will continue to use the Qinglan TPV three-point verification trading system to analyze and clarify this market. Everyone, please take a seat, and let's start the class!
First, let's take a look at the big picture, which is the overall trend across multiple timeframes. We need to clarify the trends, moving averages, price positions, and key support and resistance levels for the four timeframes, and then combine that with on-chain data and news to see what the market sentiment really is.
Step 1: Look at the big picture (Overall trend across multiple timeframes)
Daily: Bullish trend, moving averages MA5/10/30 are in bullish alignment, and the price is above MA5 (78084.34), but not far from it. The key resistance is at the recent high of 78961.0, and support is near MA10 (77027.06). The on-chain Fear and Greed Index is 47, neutral to cautious; the total market value has increased by 1.29% in the last 24 hours, indicating that market sentiment is warming up, but it has not reached a frenzy. Headlines like "Reversal signal confirmed, Bitcoin downtrend technically ends" and "BTC fluctuates upward recapturing 78500" resonate with the bullish trend on the daily chart.
4-hour: Moving averages are intertwined, MA5 (78294.74) and MA10 (77926.17) are tangled near MA30 (77977.44), indicating an unclear short-term trend and oscillation. The price is swaying back and forth near the moving averages, with key resistance at the recent high of 79472.82 and support near MA30 (77977.44). On-chain Bitcoin dominance is 58.22%, quite high, indicating that funds still prefer Bitcoin, while altcoins are relatively weak. News such as "Whale sells 300 BTC" might intensify the oscillation at this 4-hour level.
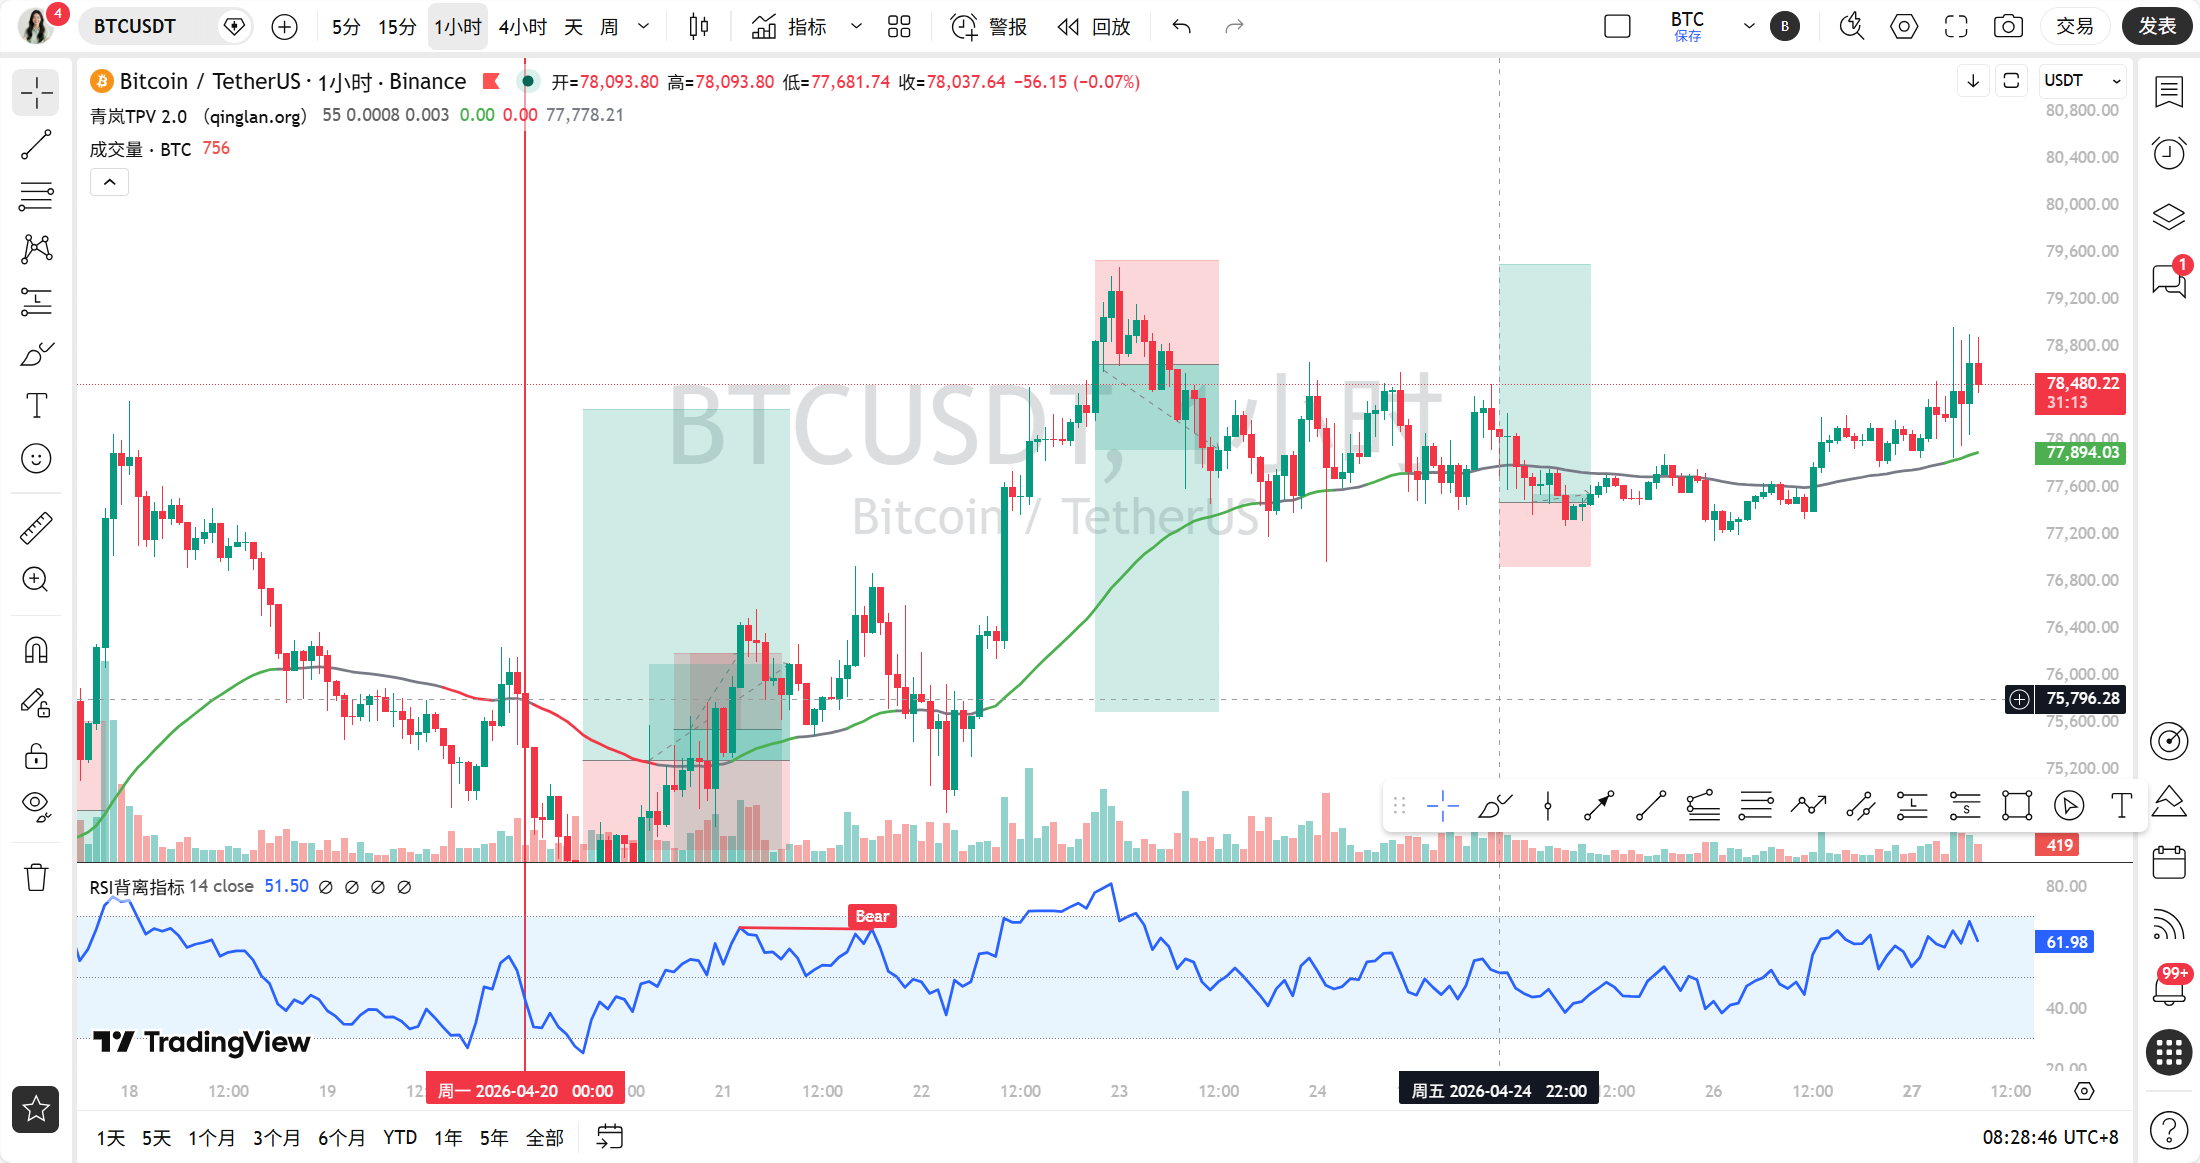
1-hour: Bullish trend, moving averages MA5/10/30 are in bullish alignment, with the price above MA5 (78405.45), but closely following it. Key resistance is at the recent high of 79472.82, with support near MA30 (77927.16). In this timeframe, both MACD and RSI are showing strength, but news like "Shooting incident at White House dinner" could increase volatility at the 1-hour level.
15-minute: Bullish alignment, MA5 (78489.39) is above MA10 (78449.67) and MA30 (78268.74), with the price near MA5. Key resistance is at the recent high of 78961.0 and support near MA30 (78268.74). In this timeframe, RSI is 55.81, neutral to strong, but the MACD bars are shrinking, indicating a slight weakening of short-term upward momentum. Macroeconomic news like "US-Iran negotiation deadlock" has little impact on this ultra-short term period.
Step 2: Identify pivot points and draw key lines (Valid highs and lows + trend lines)
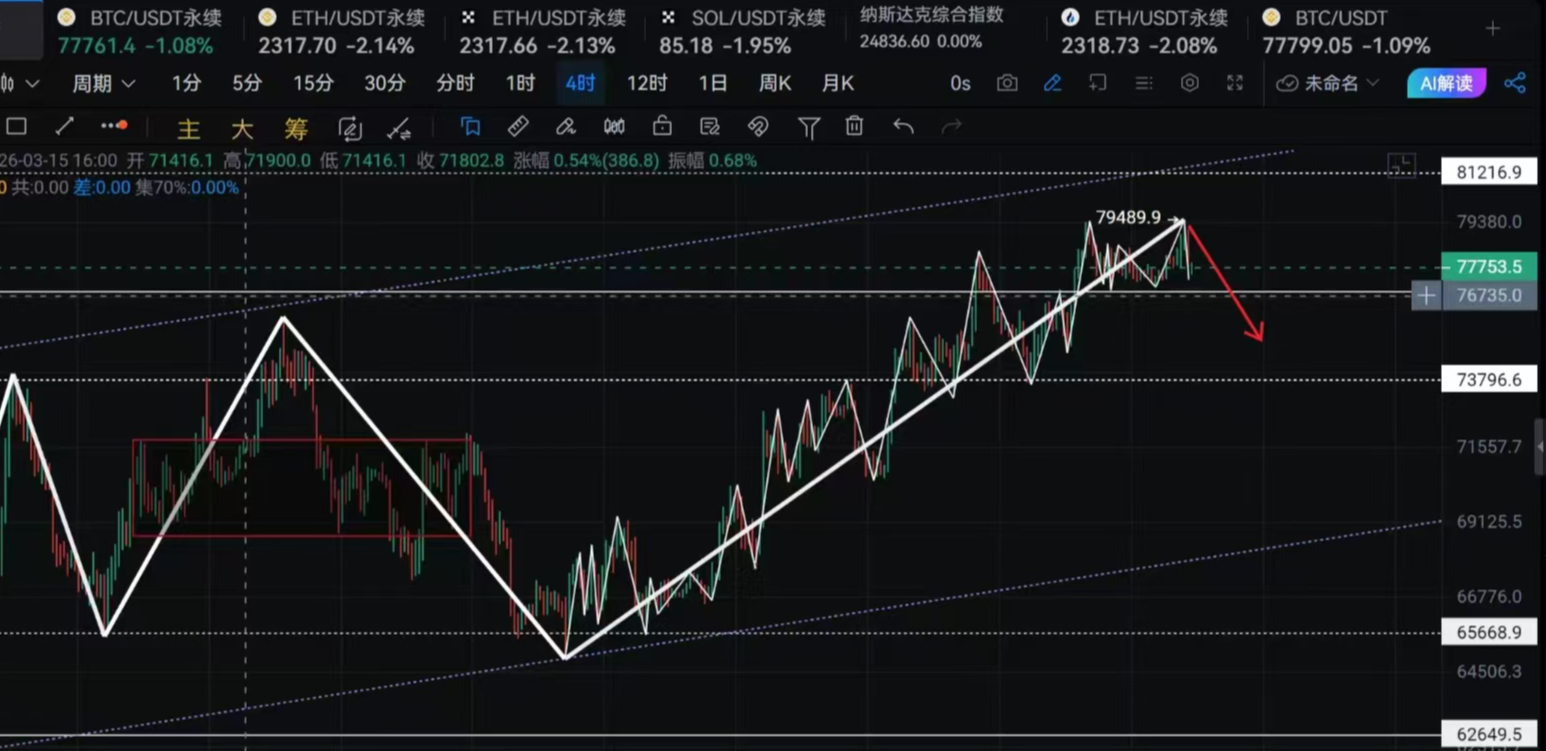
Daily: The valid high is at 78961.0 (04-27) and the valid low is at 65000.0 (04-14). These two points have been confirmed by subsequent candles, indicating high validity. We can draw an upward trend line connecting the low of 65000.0 to the recent low of 77264.08; this line has been touched multiple times and serves as core support at the daily level. The news "Reversal signal confirmed" happens to appear near this pivot point, reinforcing its validity.
4-hour: The valid high is at 79472.82 (04-27) and the valid low is at 73724.31 (04-24). These two points have also been confirmed. We can draw an upward trend line from the low of 73724.31 to the recent low of 77264.08; this line has been touched at the 4-hour level and acts as short-term support.
1-hour: The valid high is at 79472.82 and the valid low is at 77140.23 (04-26). These two points have been confirmed. We can draw an upward trend line from the low of 77140.23 to the recent low of 77264.08; this line has been touched at the 1-hour level.
15-minute: The valid high is at 78961.0 and the valid low is at 77193.79 (04-26). These two points have been confirmed. We can draw an upward trend line from the low of 77193.79 to the recent low of 77264.08; this line has been touched at the 15-minute level.
Step 3: Use indicators for support (Technical indicators verification)
Daily: MACD in a golden cross state, DIF and DEA are above the zero axis, and the bars are expanding, indicating strong momentum. RSI is 65.24, close to neutral but strong, without being overbought. The indicators verify the validity of the bullish trend.
4-hour: MACD in a golden cross, but the bars are shrinking, indicating a slight weakening of upward momentum. RSI is 62.58, neutral to strong. The indicators verify the oscillation state caused by intertwined moving averages, and trend strength is not as strong as that on the daily chart.
1-hour: MACD in a golden cross, and the bars are expanding, indicating strong momentum. RSI is 60.31, neutral to strong. The indicators verify the short-term bullish trend.
15-minute: MACD in a golden cross, but the bars are shrinking, indicating weakening momentum. RSI is 55.81, neutral. The indicators verify insufficient short-term upward momentum, indicating the need for a pullback. There is no divergence here.
Step 4: The tug of war between bulls and bears (News + On-chain)
News:
Positive factors: "Reversal signal confirmed", "BTC fluctuates upward recapturing 78500", "Vietnam to launch regulated crypto trading pilot in 2026", "Michael Saylor forecasts further purchases". The core factor is "Reversal signal confirmed", and this expectation has been brewing but needs more reinforcement.
Negative factors: "Shooting incident at White House dinner", "US-Iran negotiation deadlock", "Whale sells 300 BTC", "Insider trading". The core factor is "US-Iran negotiation deadlock", which will continuously affect the market's risk appetite.
Technical and news elements resonate, as bullish news supports the bullish trend, while bearish news may lead to short-term pullbacks.On-chain data:
The Fear and Greed Index is 47, neutral, indicating that market sentiment is not extreme, allowing for upward space but without frenzy. Bitcoin dominance is 58.22%, which is high, indicating funds are concentrated in Bitcoin. The total market value has increased by 1.29% in the last 24 hours, indicating that the overall market is recovering. Technical analysis and on-chain data resonate, as neutral to slightly bullish sentiment supports the bullish trend.
Step 5: The path of least resistance (Trading strategy)
In summary, the current bullish trend is clear, but short-term momentum is weakening, indicating a need for a pullback. Therefore, the suggested trading direction is: primarily long on pullbacks, without chasing highs. The key entry area can be set near the daily MA10 (77027.06) or near the 4-hour MA30 (77977.44). The stop-loss can be set just below the daily low at 77264.08. The target area should look at the previous daily high of 78961.0, and if it breaks through, then look at 79472.82.
Step 6: How will things go today (Market forecast)
Current (within a few hours): Ultra-short timeframe likely oscillating between 15-minute MA30 (78268.74) and 1-hour MA5 (78405.45), with a bullish bias but insufficient momentum.
Today's and recent key points: The most important support today is at 15-minute MA30 (78268.74); if it breaks, watch 4-hour MA30 (77977.44). The most important resistance level is the daily previous high of 78961.0. The trend line to focus on is the daily upward trend line, located around 77264.08.
Trading thoughts: The only suitable trading direction right now is "Long on pullbacks." The reason is that the daily and 1-hour bullish trends are clear, with on-chain data being neutral to slightly bullish; a pullback to the key support level is a good entry opportunity.
Summary: To summarize the current market's core contradiction in one sentence: The bullish trend is clear, but short-term momentum is weakening, necessitating a pullback to build strength.
Trading quote: In light of the news "US-Iran negotiation deadlock" and "Reversal signal confirmed", let's say: The market is like the US-Iran negotiations, containing a reversal within the deadlock; patiently waiting, and dawn is just ahead.
[Qinglan's personal opinion]
Students, when trading, the worst thing is being anxious. When you see it rise, you want to chase; when you see it fall, you want to cut losses. Today’s chart clearly shows a bullish trend on the daily, but weakening momentum on the 15-minute, illustrating a typical opportunity of "look for direction in the big cycle, find entry in the small cycle." What we need to do is wait for the signal to appear that shows a pullback to the key support level, then enter steadily. Remember, good trading is not about predicting; it’s about responding. If you want to receive the latest entry opportunities captured by my TPV system first-hand, feel free to visit the Qinglan Crypto Classroom official website www.qinglan.org
免责声明:本文章仅代表作者个人观点,不代表本平台的立场和观点。本文章仅供信息分享,不构成对任何人的任何投资建议。用户与作者之间的任何争议,与本平台无关。如网页中刊载的文章或图片涉及侵权,请提供相关的权利证明和身份证明发送邮件到support@aicoin.com,本平台相关工作人员将会进行核查。