Cryptocurrency Expert: On April 29, the Ethereum daily chart level bottom reversal has formed, and this wave of correction is our opportunity! Latest market analysis and trading advice
The current price of Ethereum is 2293. The current fluctuating market of Ethereum is essentially a repair after a downward trend and a key point in the north-south game. Many people cannot understand the arrangement of moving averages and MACD signals, only guessing directions blindly. Today, I will use daily and four-hour real-time data to analyze the current trend, momentum, and key levels, helping you understand the essence of ETH's fluctuations. Whether for short-term trading or medium-to-long-term positioning, you can find clear operational logic, rejecting blind following.

Since the daily candlestick chart rebounded from the low of 1736, it has formed a fluctuating upward channel centered around EMA30. The current price of 2293 is above the medium-to-short-term moving average system, with EMA15, EMA30, and EMA60 arranged upwards in succession, effectively reversing the medium-term downward trend. In the MACD indicator, DIF and DEA have formed a dead cross above the zero axis, the green bars continue to narrow, the downward momentum is gradually weakening, and the upward momentum is slowly accumulating; the Bollinger Bands are narrowing, and the price is running below the middle track, indicating insufficient short-term upward momentum, and the fluctuation accumulation phase has not yet ended. The upper key breakthrough or breakdown point is 2427, and the lower key point is 2199.
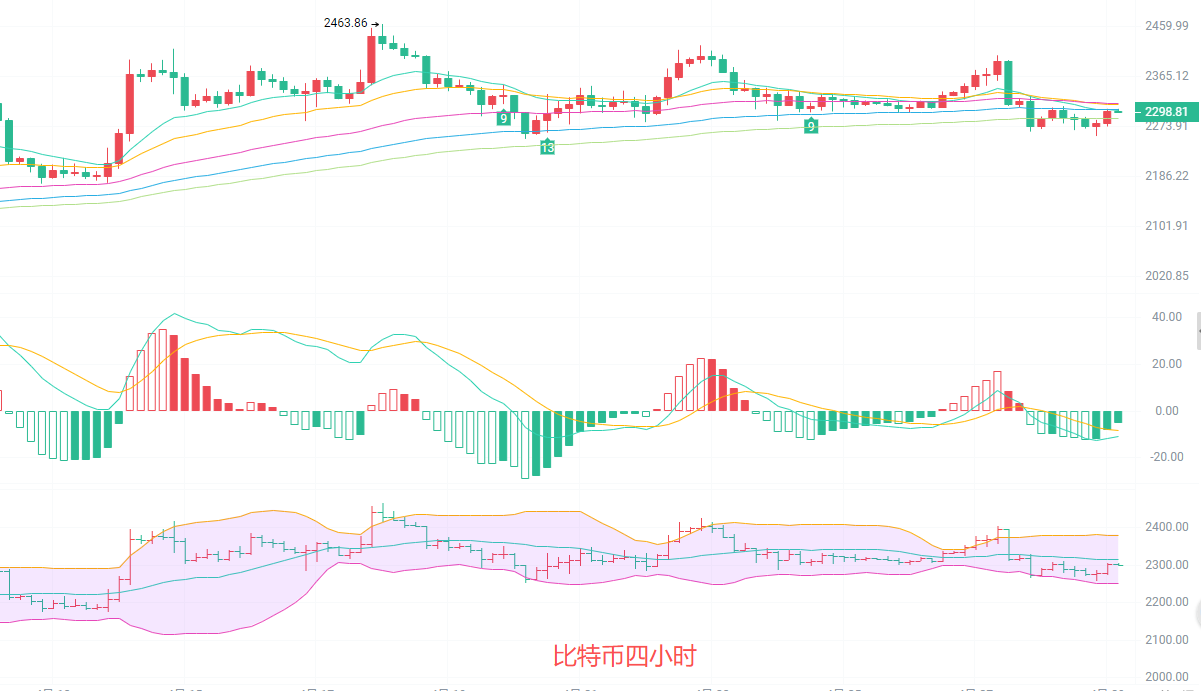
The four-hour candlestick chart has formed a clear fluctuating box in the range of 2250-2463, and the moving average system shows an upward arrangement. EMA30 and EMA60 continue to rise, providing strong support for the price. The MACD indicator has formed a dead cross, with DIF crossing below DEA, and the green bars slightly increasing, indicating the release of short-term correction momentum. The price has retraced to near EMA15 but has not yet broken the key support level. The middle track of the Bollinger Bands around 2315 has formed short-term resistance, with clear support near the lower track at 2250. The current correction is a technical adjustment in the upward process, and no trend reversal signal has appeared, maintaining the integrity of the upward fluctuation structure.
Short-term reference: (Real-time data has been updated, details can be consulted with the author)
Upwards from 2270 to 2230, stop loss at 2200, target at 2330 to 2400
Downwards from 2345 to 2370, stop loss at 2400, target at 2290 to 2260
The current market of ETH is a typical trend repair period, with no clear one-sided direction, and both bulls and bears are pulling in a key range. This kind of market is most likely to experience a situation where the direction is correct, but the level is wrong. I hope you are still here when the market comes.

Warm reminder: The above content is exclusively created by the author for the public account. The advertisements at the end of the article and in the comment area are unrelated to the author. Please discern carefully. Thank you for reading.
免责声明:本文章仅代表作者个人观点,不代表本平台的立场和观点。本文章仅供信息分享,不构成对任何人的任何投资建议。用户与作者之间的任何争议,与本平台无关。如网页中刊载的文章或图片涉及侵权,请提供相关的权利证明和身份证明发送邮件到support@aicoin.com,本平台相关工作人员将会进行核查。